. 2020 Jan;52(1):95-105.
doi: 10.1038/s41588-019-0545-1. Epub 2019 Dec 16.

Epigenomic analysis of gastrulation identifies a unique chromatin state for primed pluripotency

Affiliations

Epigenomic analysis of gastrulation identifies a unique chromatin state for primed pluripotency

Yunlong Xiang et al. Nat Genet. 2020 Jan.

Abstract

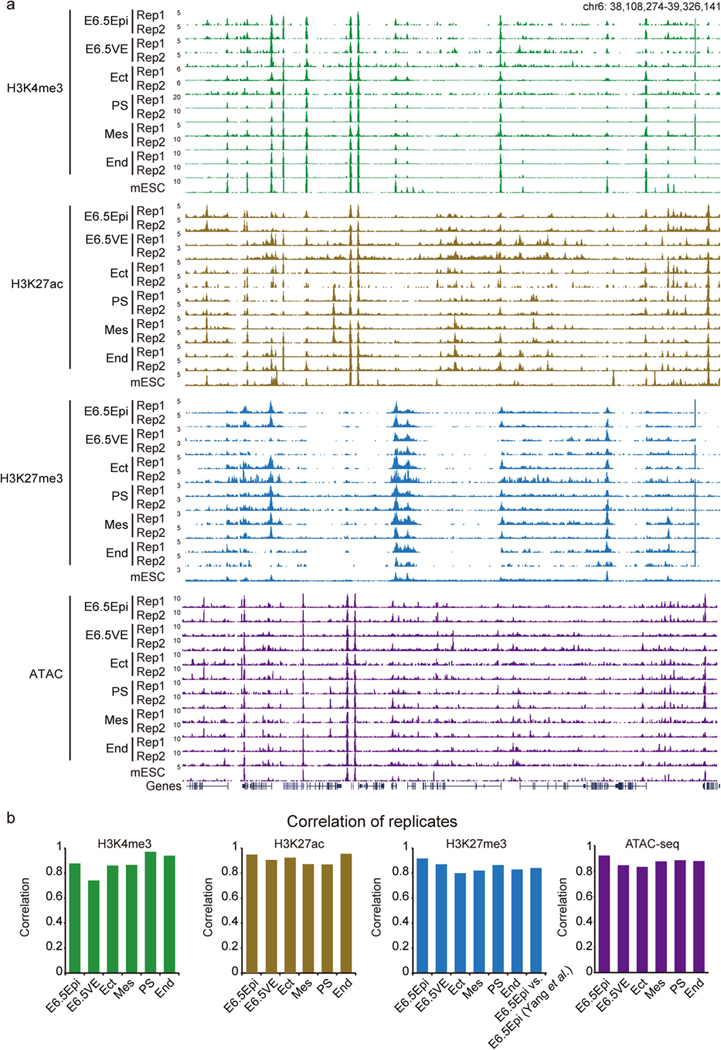
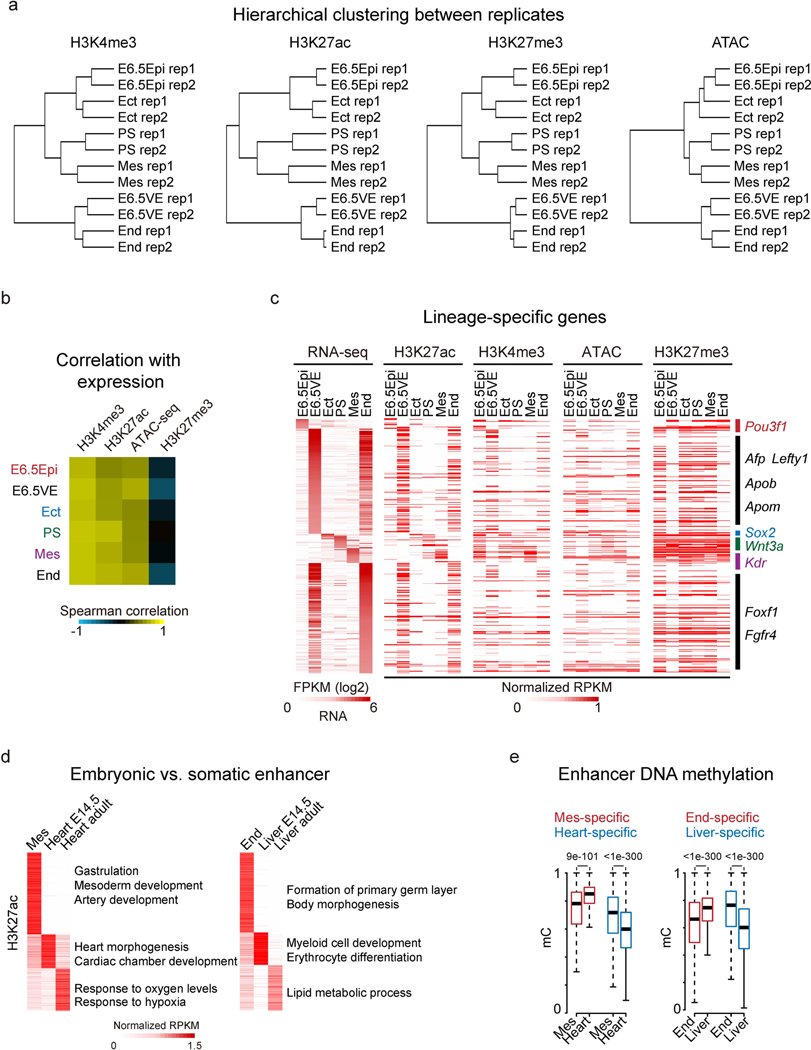
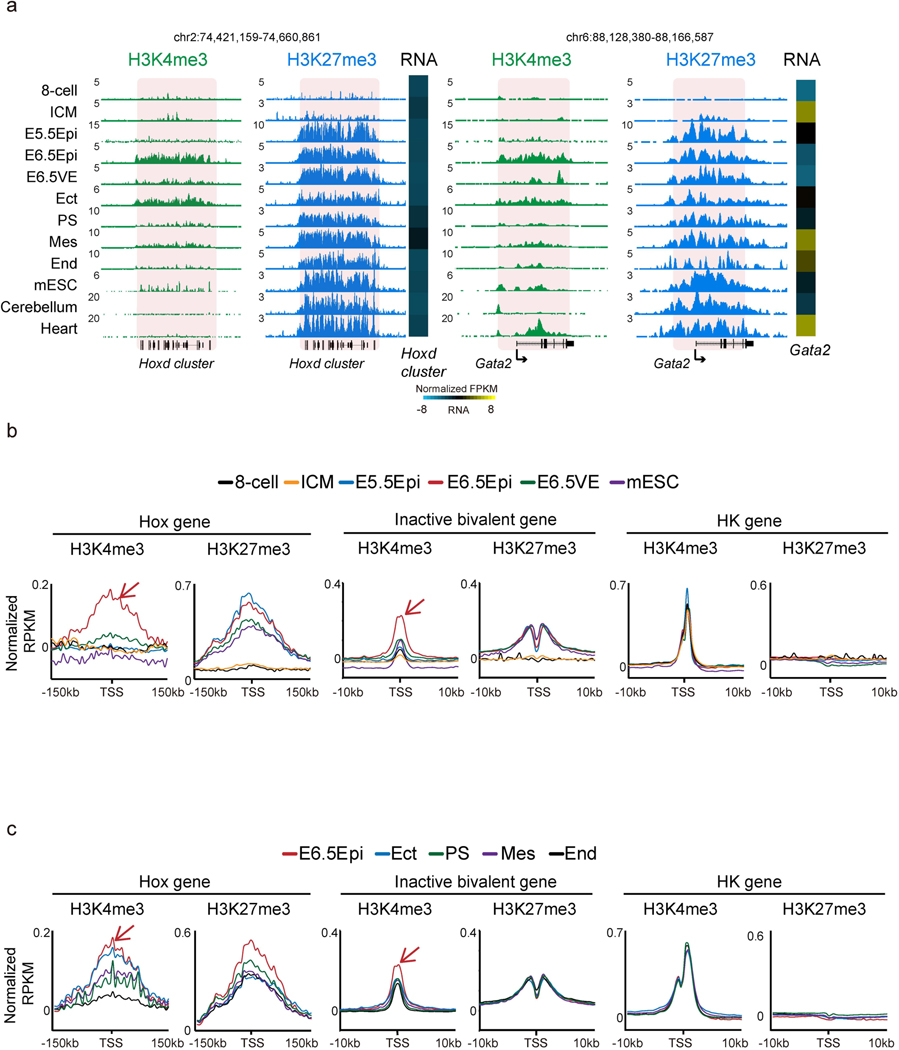
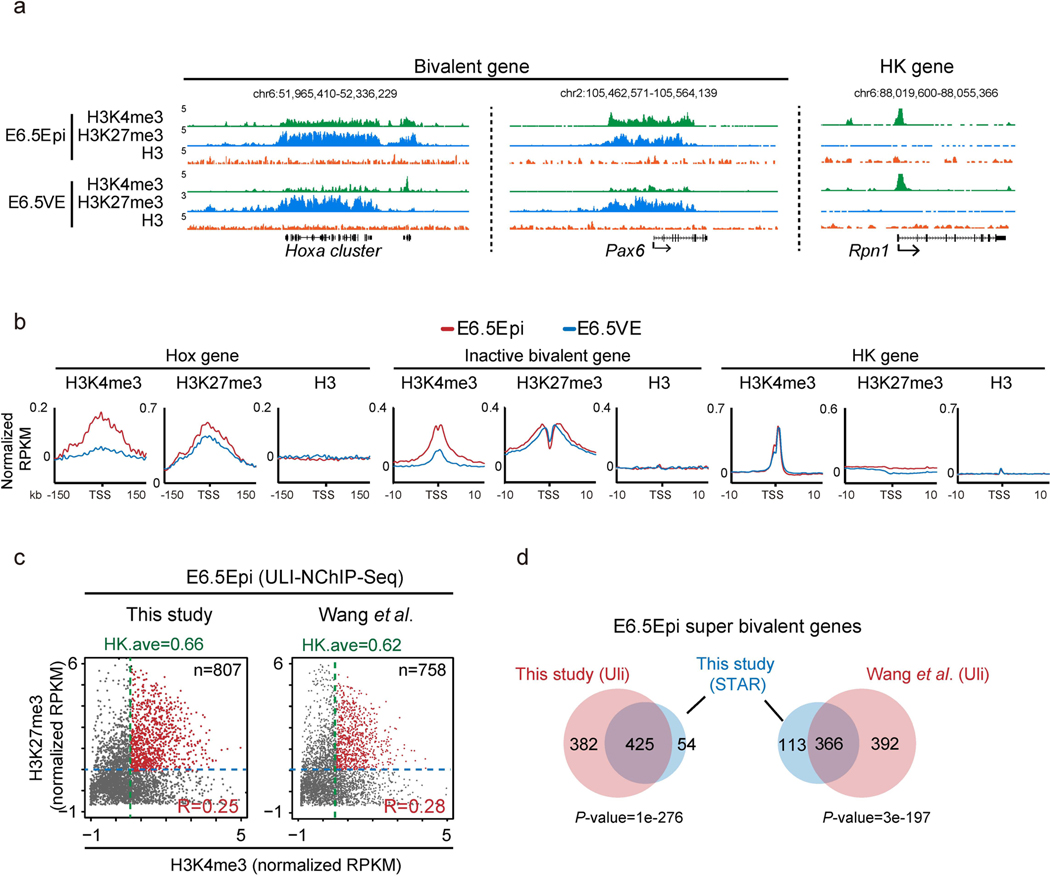
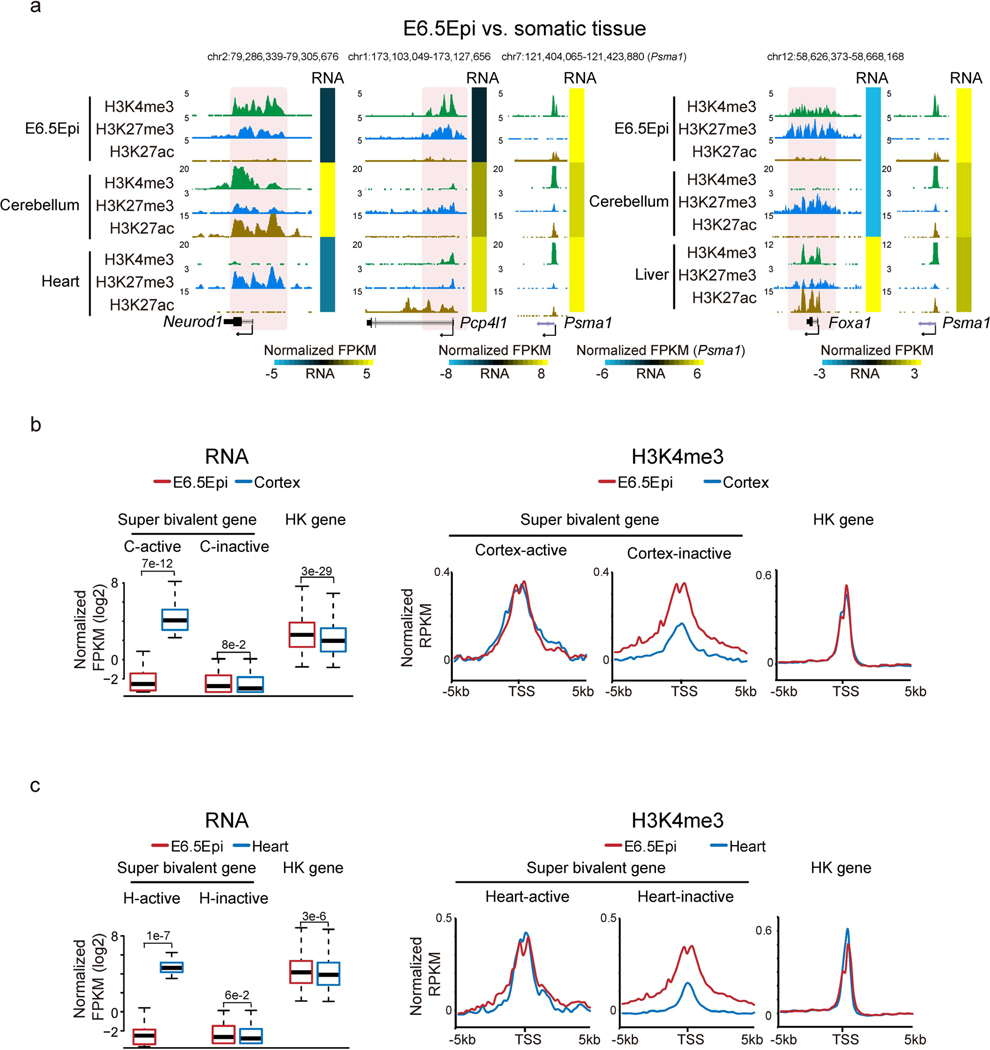
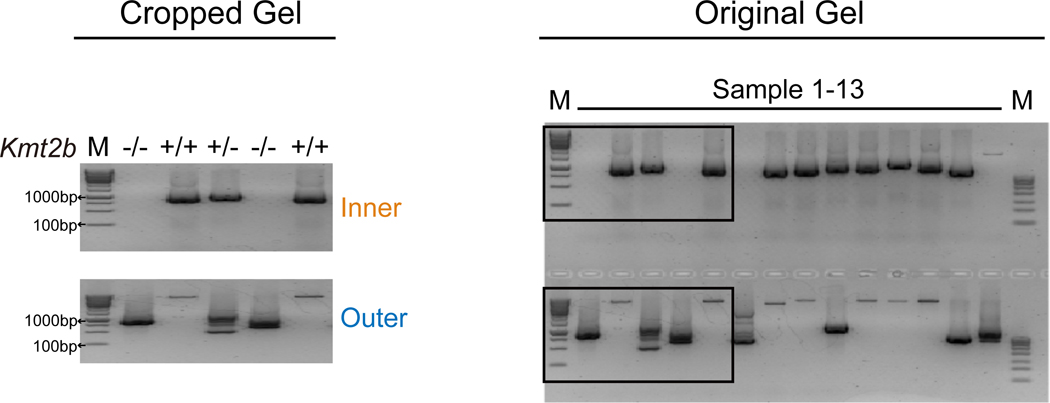
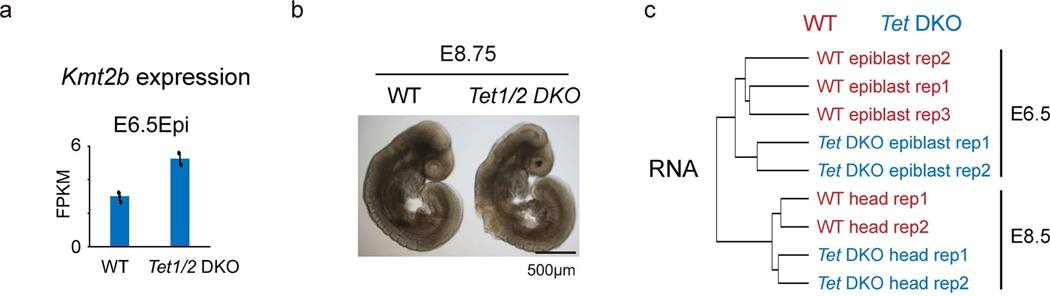
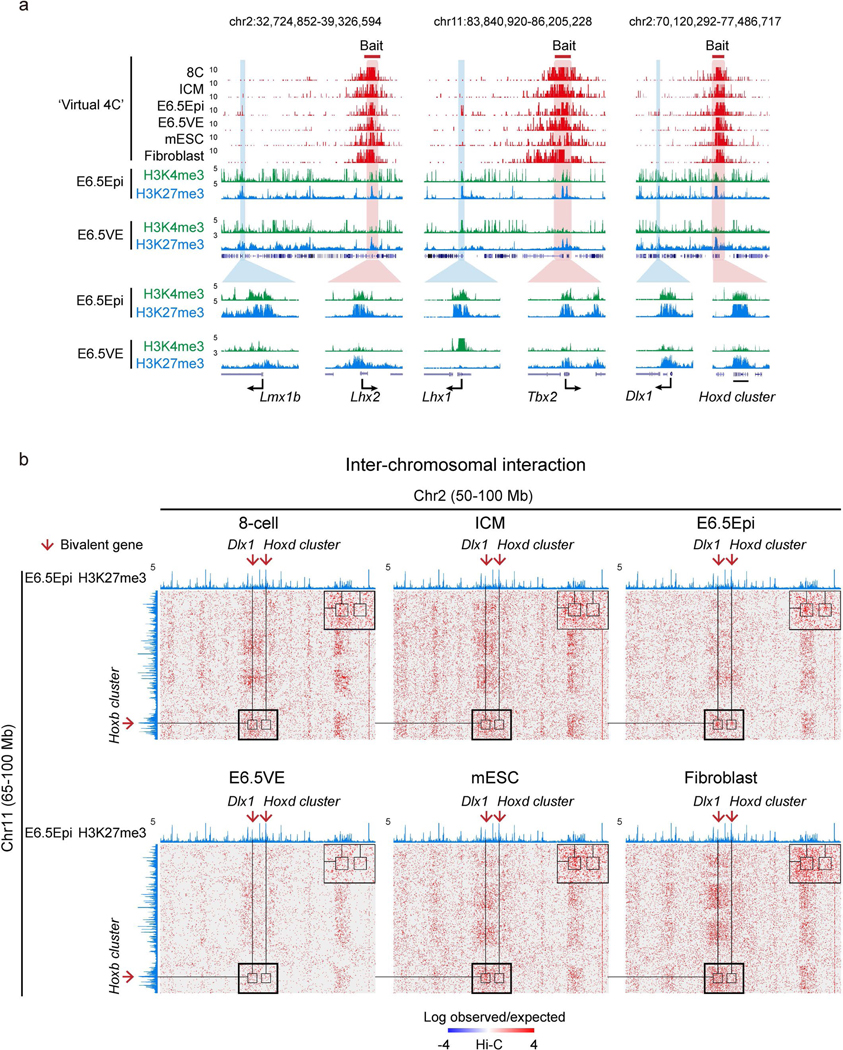
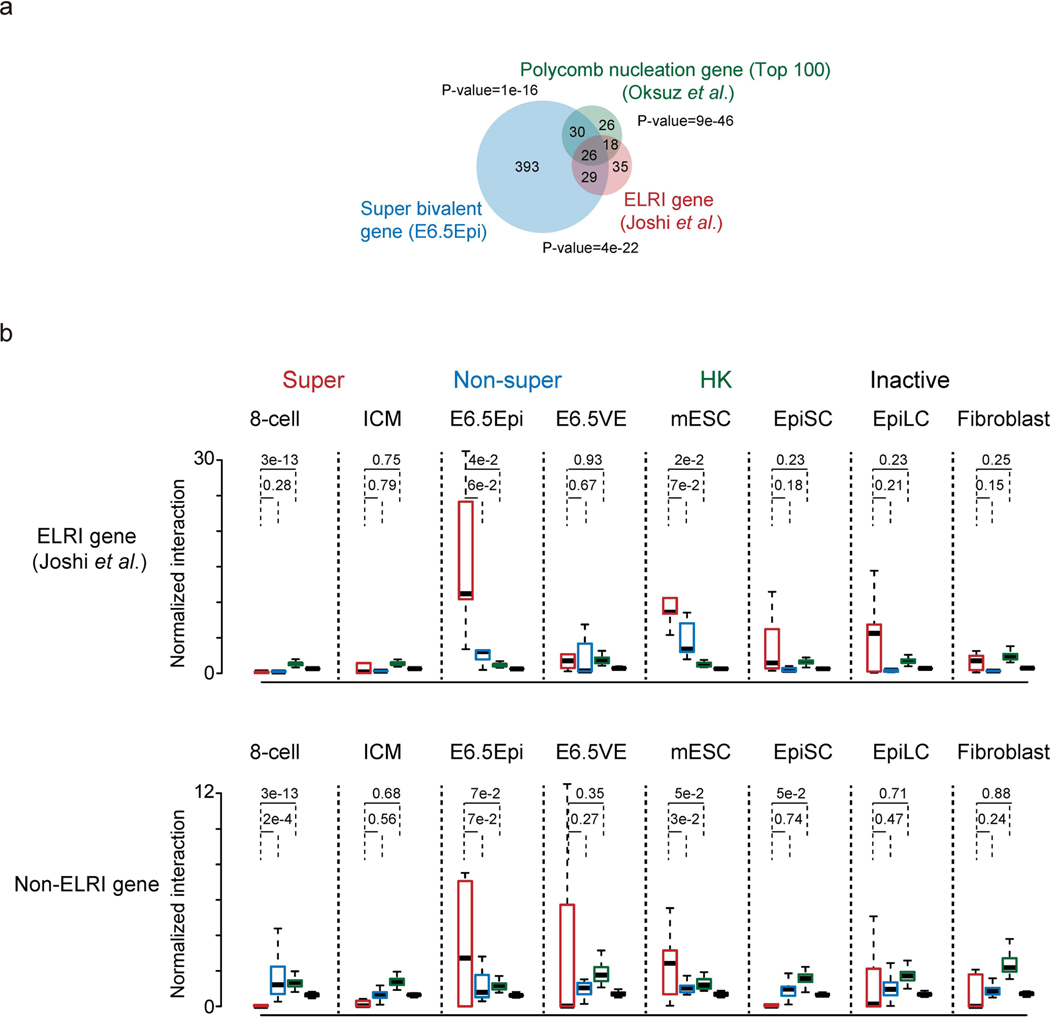
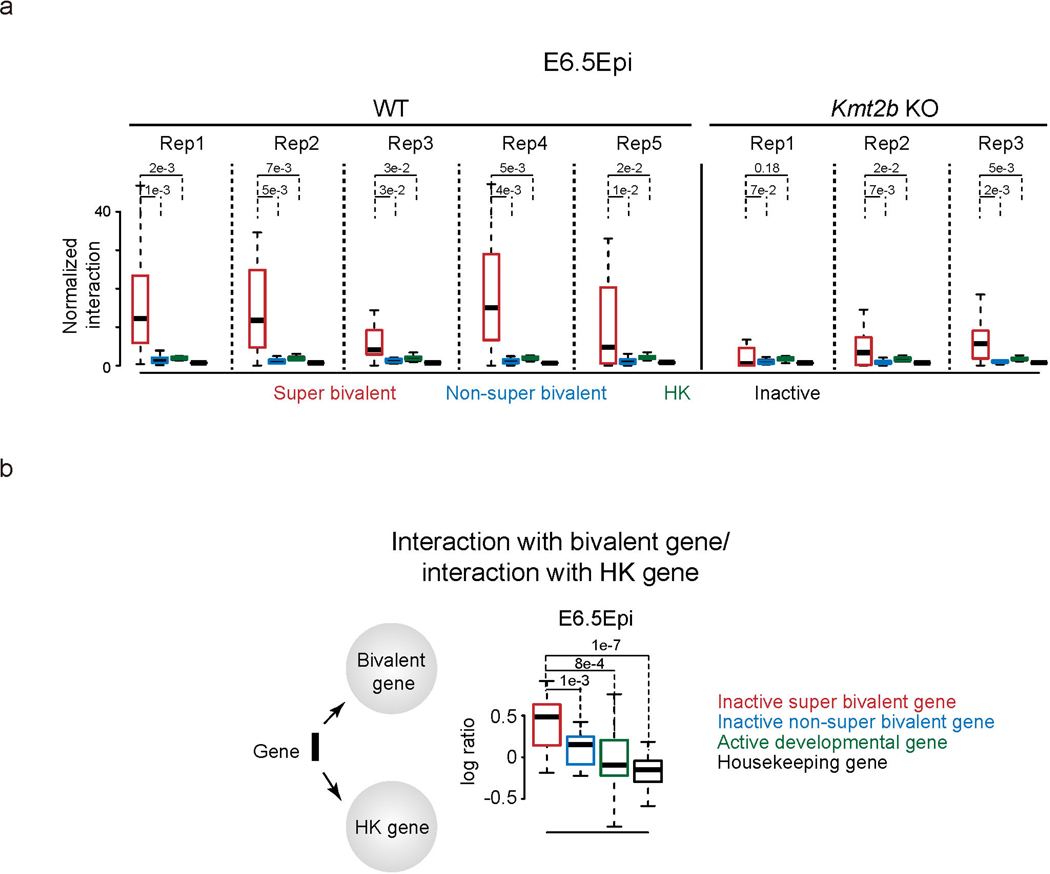
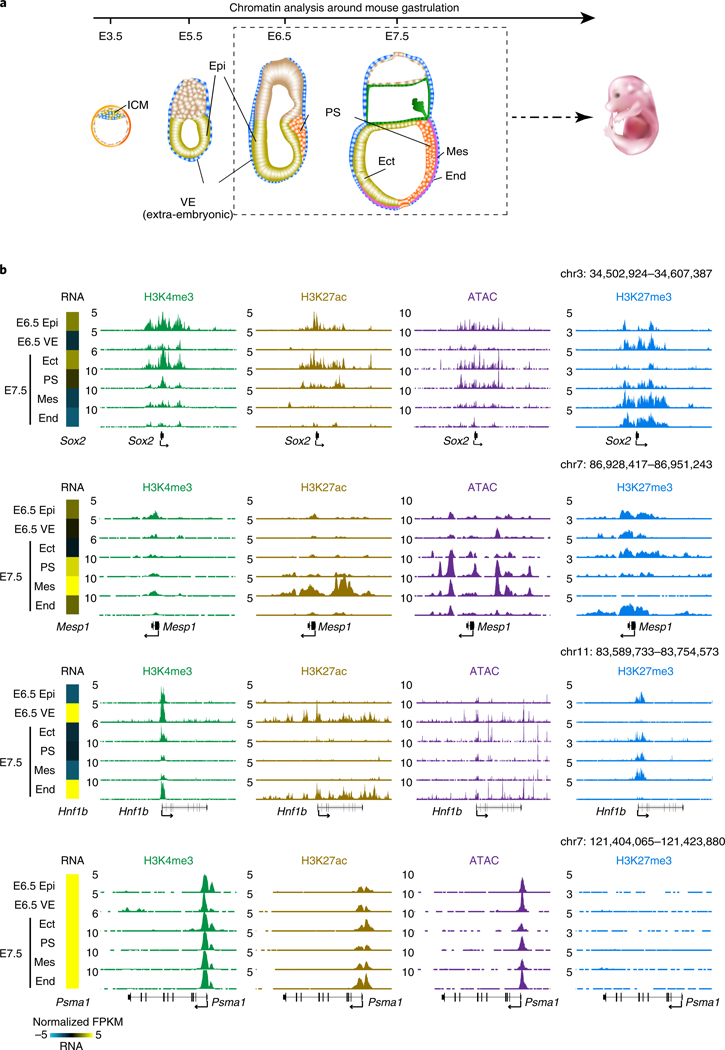
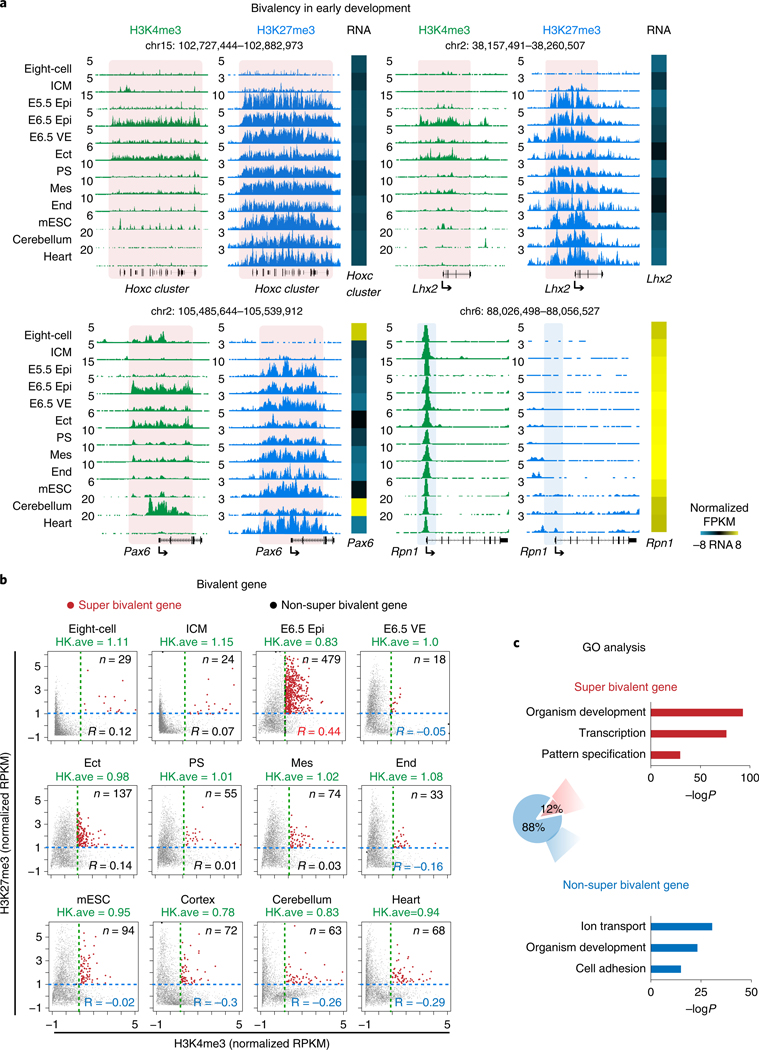
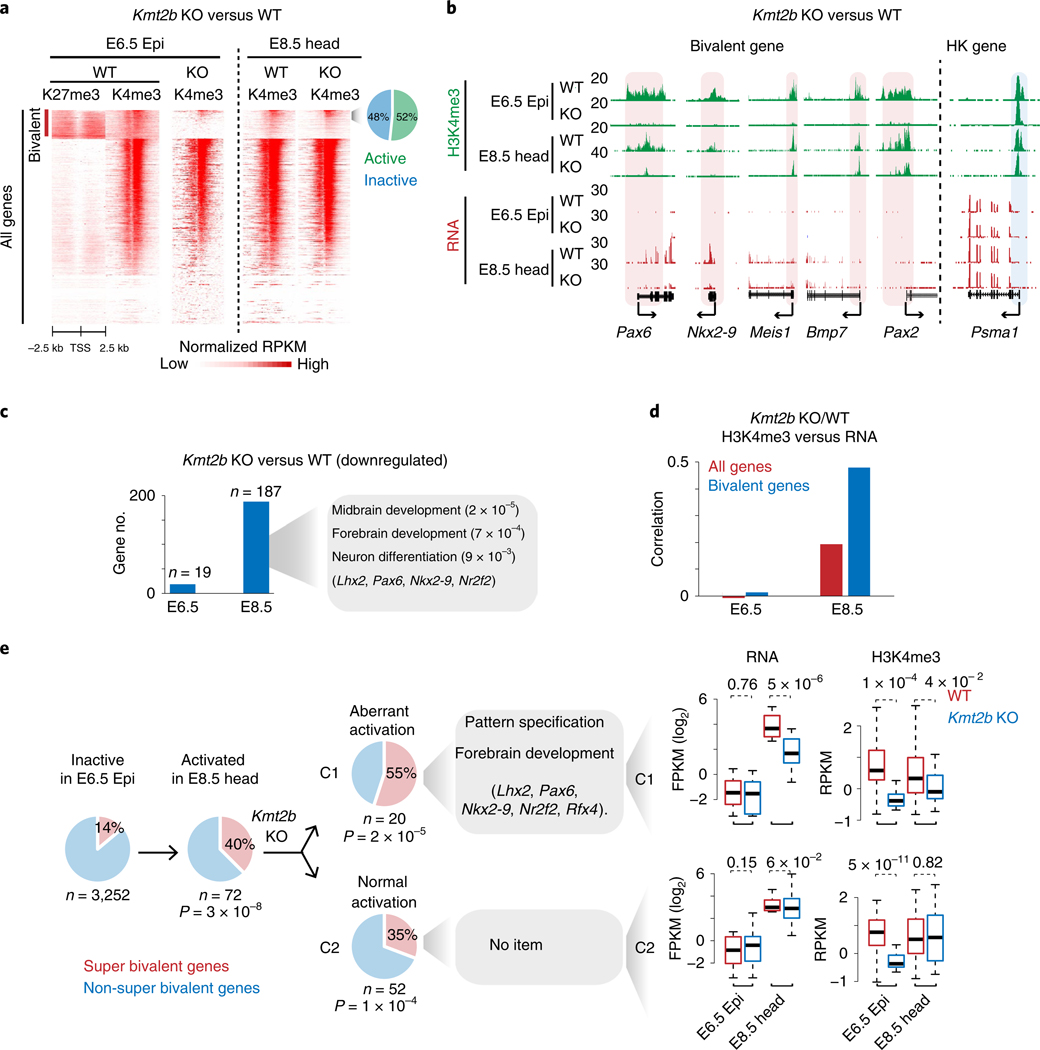
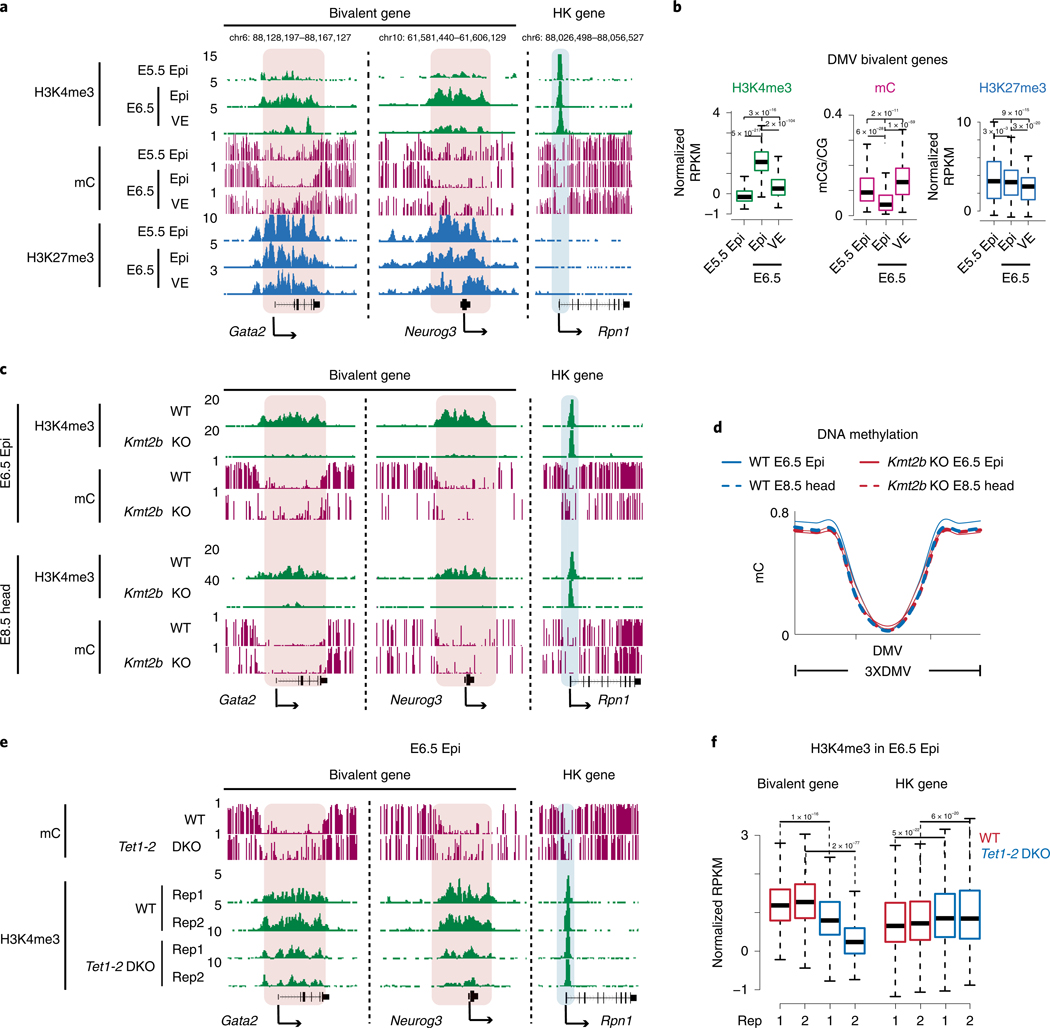
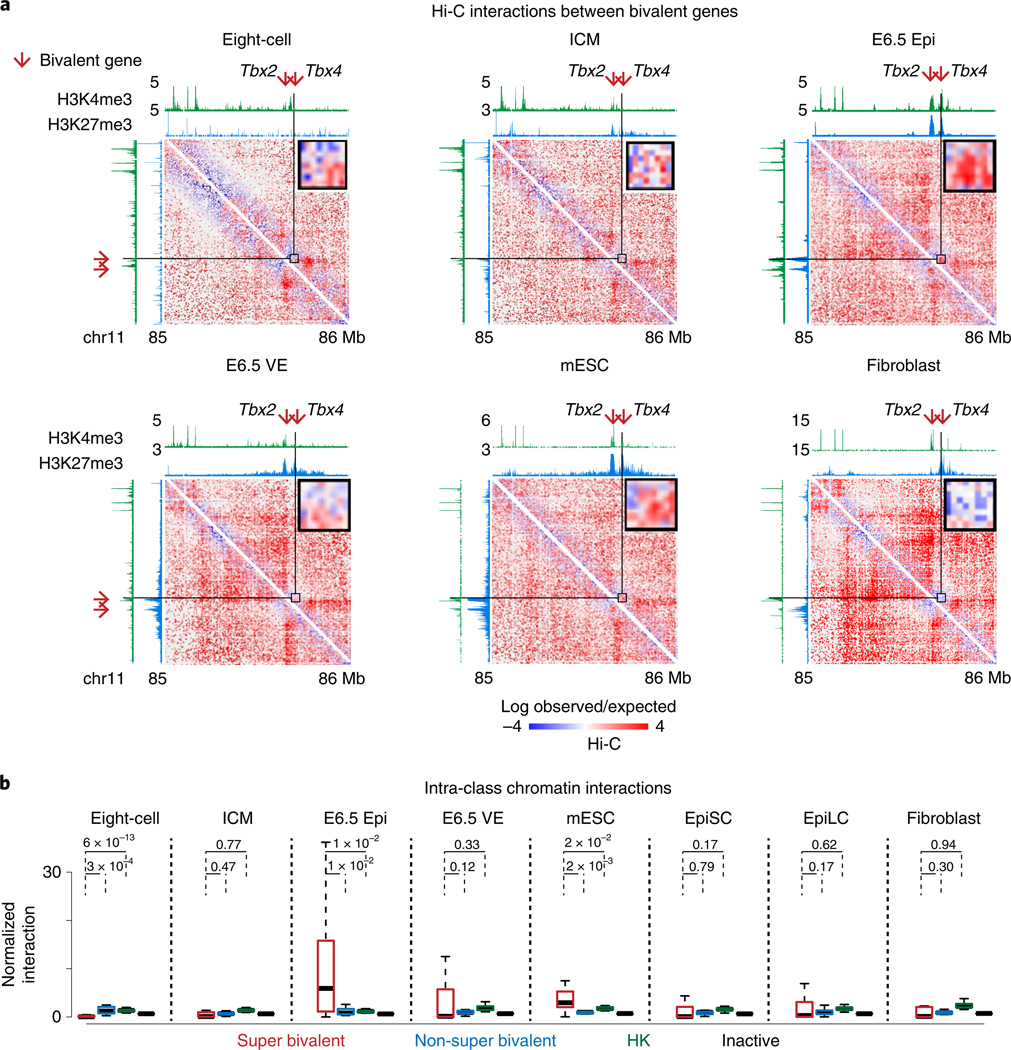
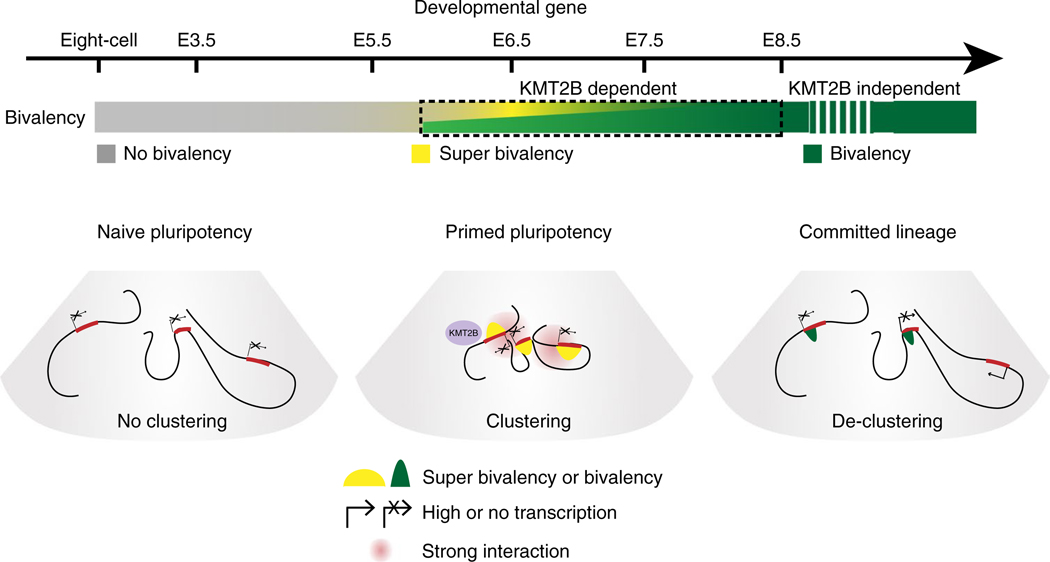
Around implantation, the epiblast (Epi) transits from naïve to primed pluripotency, before giving rise to the three germ layers. How chromatin is reconfigured during this developmental window remains poorly understood. We performed a genome-wide investigation of chromatin landscapes during this period. We find that enhancers in ectoderm are already pre-accessible in embryonic day 6.5 (E6.5) Epi when cells enter a primed pluripotent state. Unexpectedly, strong trimethylation of histone H3 at lysine 4 (H3K4me3) emerges at developmental gene promoters in E6.5 Epi and positively correlates with H3K27me3, thus establishing bivalency. These genes also show enhanced spatial interactions. Both the strong bivalency and spatial clustering are virtually absent in preimplantation embryos and are markedly reduced in fate-committed lineages. Finally, we show that KMT2B is essential for establishing bivalent H3K4me3 at E6.5 but becomes partially dispensable later. Its deficiency leads to impaired activation of developmental genes and subsequent embryonic lethality. Thus, our data characterize lineage-specific chromatin reconfiguration and a unique chromatin state for primed pluripotency.


Figures

Extended Data Fig. 1 |
Extended Data Fig. 1 |. Global view of histone modifications and chromatin accessibility in mouse early lineages.
a, Snapshots showing two replicates of H3K4me3, H3K27ac, H3K27me3, and ATAC-seq in E6.5Epi, E6.5VE, Ect, PS, Mes, and End at E7.5. mESC data from ENCODE are also shown for comparison. The genome browser view scales were adjusted based on the global data range. b, The Pearson correlation between two replicates for H3K4me3, H3K27me3, H3K27ac, and ATAC-seq in post-implantation lineages. The correlation between our dataset and a published dataset for H3K27me3 in E6.5 epiblast is also shown.
Extended Data Fig. 2 |
Extended Data Fig. 2 |. Global view of histone modifications, chromatin accessibility, and dynamics of putative enhancers during mouse early lineage specification.
a, Hierarchical clustering of two replicates for histone modifications and ATAC-seq data at promoters among post-implantation tissues. b, The heatmap showing the Spearman correlation between gene expression and enrichment of histone modifications and open chromatin at promoters in the post-implantation embryos. c, Heatmaps showing gene expression and related histone modifications/open chromatin enrichment at promoters for lineage-specific genes. d, Heatmaps showing tissue-specific enhancers from mesoderm to heart (left), and endoderm to liver (right). GO terms enriched for each tissue-specific enhancers are also listed. Somatic enhancers were obtained from a previous study. e, Boxplots showing the dynamics of DNA methylation for tissue-specific enhancers, during development. The median of each dataset is shown by the center line. The bottom, top edges and whiskers represent the twenty-fifth and seventy-fifth percentiles, and 1.5 times the interquartile range (IQR), respectively.
Extended Data Fig. 3 |
Extended Data Fig. 3 |. Bivalency establishment in early embryo.
a, Snapshots showing H3K4me3 and H3K27me3 enrichment at developmental genes Hoxd cluster and Gata2 in various cell types (n=2). Gene expression is also shown (log2 transformed FPKM). mESC and somatic tissue data from ENCODE are shown. Published data in 8-cell embryos and ICM, are also shown for comparison. The genome browser view scales were adjusted based on the global data range. b, Average plots showing H3K4me3 and H3K27me3 enrichment at the Hox genes, bivalent genes inactive at all stages examined (8-cell, ICM, E5.5Epi, E6.5Epi, E6.5VE, and mESC), and housekeeping genes. The H3K4me3 enrichment is normalized against H3K4me3 signals at housekeeping (HK) gene promoters for each lineage. Arrows indicate E6.5 Epi. c, Average plots showing H3K4me3 and H3K27me3 enrichment at inactive bivalent genes (inactive at E6.5Epi, Ect, PS, Mes, and End), and housekeeping genes. The H3K4me3 enrichment is normalized against H3K4me3 signals at housekeeping (HK) gene promoters for each lineage. Arrows indicate E6.5 Epi.
Extended Data Fig. 4 |
Extended Data Fig. 4 |. Bivalency states in E6.5Epi and E6.5VE.
a, The UCSC genome browser views showing the enrichment of H3K4me3 (n=2), H3K27me3 (n=2) and H3 (n=1) at developmental genes Hoxa cluster, Pax6, as well as a housekeeping gene Rpn1 in mouse E6.5Epi and E6.5VE. b, Average plots showing H3K4me3 (n=2), H3K27me3 (n=2) and H3 (n=1) enrichment at the Hox gene cluster, inactive bivalent genes (inactive in E6.5Epi and E6.5VE), and housekeeping genes in E6.5Epi and E6.5VE. c, The scatter plot showing the enrichment of H3K4me3 (ULI-NChlP-seq), either done in this study (left) or in a previous study (right), and H3K27me3 (STAR ChlP-seq) of all bivalent genes (n=3,992) for E6.5 epiblast. The average H3K4me3 enrichment of housekeeping gene (HK.ave) is shown for each tissue. The number of super bivalent genes (top right) and Pearson correlation of H3K4me3 and H3K27me3 for each tissue (bottom right) are shown. d, The Venn diagram shows the overlap of super bivalent genes identified by ULI-NChlP-seq (Uli) and STAR ChIP-seq in E6.5 epiblast. The P-values was calculated by Fisher’s test.
Extended Data Fig. 5 |
Extended Data Fig. 5 |. Super bivalency marks primed pluripotent state in early lineages and somatic tissues.
a, Snapshots comparing the enrichment of H3K4me3, H3K27me3, and H3K27ac in E6.5 epiblast and somatic tissues from ENCODE at developmental genes Neurod1, Pcp4l1, and Foxa1. The heatmaps showing related gene expression levels. The genome browser view scales were adjusted based on the global data range. b, Left, the boxplot showing the expression levels of super bivalent genes and housekeeping genes in E6.5Epi and cortex. The median of each dataset is shown by the center line. The bottom, top edges and whiskers represent the twenty-fifth and seventy-fifth percentiles, and 1.5 times the interquartile range (IQR), respectively. Two-sided P-values calculated by t-test are also shown. Super bivalent genes are identified in E6.5Epi (inactive). C-active, E6.5Epi super bivalent genes that become active in cortex (FPKM > 5); C-inactive, E6.5Epi super bivalent genes that remain inactive in cortex (FPKM < 2). Right, average plots showing the enrichment of H3K4me3 around the active and inactive super bivalent genes and housekeeping genes in E6.5Epi and cortex. c, A similar analysis as b in E6.5Epi and heart. H-active, E6.5Epi super bivalent genes that become active in heart (FPKM > 5); H-inactive, E6.5Epi super bivalent genes that remain inactive in heart (FPKM < 2).
Extended Data Fig. 6 |
Extended Data Fig. 6 |. Loss of super bivalent H3K4me3 is associated with aberrant developmental gene activation.
a, Gene expression of Kmt2b in pre- and post-implantation embryos is shown as bar graphs using previously published datasets,. b, Left, a schematic showing Kmt2b knockout strategy using Cas9/CRISPR as previously described. Inner and outer primers for genotyping are shown. Right, the genotyping results of identified wild-type and Kmt2b−/− embryos using extra-embryonic tissues at E6.5. One representative image from three independent experiments is shown. Uncropped gel is also shown in Source data. M, DNA ladder; +/+, wild-type; +/−, heterozygote; −/−, homozygote. c, Average plots showing H3K4me3 enrichment at super bivalent/non-super bivalent/housekeeping genes (defined in E6.5 epiblast) for wild-type (n=2) and Kmt2b−/− E6.5Epi (n=3) and E8.5 head (n=2). The H3K4me3 enrichment is normalized against H3K4me3 signals at housekeeping (HK) gene promoters for each lineage. d, The morphology of wild-type and Kmt2b KO embryos from E6.5 to E9.5. Three independent experiments were performed. e, Hierarchical clustering based on gene expression in wild-type and Kmt2b KO embryos from E6.5 to E9.5. Arrow indicates E9.5 Kmt2b−/− embryo.
Extended Data Fig. 7 |
Extended Data Fig. 7 |. WT vs. Tet1/2 DKO embryos in E6.5 epiblasts.
a, Bar chart showing the expression levels of Kmt2b in wild-type (n=3) and Tet1/2 DKO (n=2) E6.5 epiblasts. The error bar represents the S.D with the barplot showing the the mean value. b, The morphology of wild type and Tet1/2 DKO embryos at E8.75. Two independent experiments were performed. c, Hierarchical clustering based on gene expression in wild-type and Tet1/2 DKO embryos from E6.5 to E8.5.
Extended Data Fig. 8 |
Extended Data Fig. 8 |. Spatial interactions of super bivalent genes in E6.5 epiblast.
a, The snapshots showing the Virtual 4C (converted from Hi-C datasets) among bivalent genes in 8-cell, ICM, E6.5Epi, E6.5VE, mESC, and fibroblast. The enrichment of H3K4me3 and H3K27me3 in E6.5Epi (n=2) and E6.5VE (n=2) are shown below. Magnified views of interactions between bivalent genes are also shown. b, Heatmaps showing the inter-chromosomal interactions between chromosomes 2 and 11. Boxes show the zoomed-in views of interactions between Dlx, Hoxd cluster (chr2) and Hoxb clusters (chr11). A UCSC genome browser of H3K27me3 enrichment in wild-type E6.5Epi is shown on the top to indicate the positions of Polycomb targets.
Extended Data Fig. 9 |
Extended Data Fig. 9 |. Super bivalent genes show strong spatial clustering.
a, A Venn diagram shows the overlap between ELRI genes (n=108), top 100 Polycomb nucleation genes, and super bivalent genes identified in E6.5Epi (see Methods). The P-values showing the overlap among pairwise comparison were calculated by Fisher test. b, Boxplots showing the normalized interaction frequencies among different gene groups in 8-cell, ICM, E6.5Epi, E6.5VE, mESC, EpiSC, EpiLC and fibroblast for ELRI bivalent genes(top) and non-ELRI bivalent genes (bottom). Super, super bivalent genes; Non-super, non-super bivalent genes; HK, housekeeping genes; Inactive, non-bivalent inactive genes (Methods). The median of each dataset is shown by the center line. The bottom, top edges and whiskers represent the twenty-fifth and seventy-fifth percentiles, and 1.5 times the interquartile range (IQR), respectively. Two-sided P-values calculated by t-test are also shown.
Extended Data Fig. 10 |
Extended Data Fig. 10 |. Strong spatial clustering of developmental genes in E6.5 epiblast.
a, Boxplots showing the normalized interaction frequencies among genes in each gene group in wild-type (n = 5) and Kmt2b−/− (n=3) E6.5 Epi. P-values calculated by two-sided t-test are also shown. b, Left, a schematic diagram shows the relative spatial position of a selected gene defined by its interactions with developmental genes divided by its interactions with housekeeping genes. Right, boxplots showing the log ratios of such bivalent/housekeeping gene interactions for different gene groups (inactive, active developmental genes, housekeeping genes) in E6.5 epiblast.
Fig. 1 |
Fig. 1 |. Global view of chromatin states during gastrulation in mouse embryos.
a, A schematic showing the overview of peri- to post-implantation embryonic development. Dashed box indicates isolated lineages in this study for chromatin analysis, including Epi (E6.5), VE (E6.5), Ect (E7.5), PS (E7.5), Mes (E7.5) and End (E7.5). b, Snapshots of UCSC genome browser showing the distributions of histone modifications (n = 2) and chromatin accessibility (n = 2) near lineage-specific marker genes. Gene expression is also displayed in heatmaps (log2 FPKM). The genome browser view scales were adjusted on the basis of the global data range.
Fig. 2 |
Fig. 2 |. Epigenetic regulation of lineage-restricted putative enhancers.
a, Snapshots showing the enrichment of H3K4me3 (n = 2), H3K27ac (n = 2) and ATAC-seq (n = 2) signals at lineage-specific enhancers in postimplantation embryos. Ect-, PS- and Mes-specific putative enhancers are shaded. Arrows indicate the pre-accessible putative ectoderm enhancers in E6.5 Epi. b, The heatmaps showing the H3K27ac and ATAC-seq signals in the putative lineage-specific enhancers in E6.5 Epi and germ layers. GREAT analysis results for each lineage-specific enhancers are listed on the right. c, The enrichment of transcription factor-binding sites at putative enhancers in postimplantation embryos. Motif enrichment was identified from distal H3K27ac (n = 2) peaks against the whole genome. Motif enrichment is shown by the area of the circle, and the expression level of the corresponding transcription factor is color-coded.
Fig. 3 |
Fig. 3 |. Super bivalency identified in primed pluripotent Epi in vivo.
a, The UCSC genome browser views showing the enrichment of H3K4me3 (n = 2) and H3K27me3 (n = 2) at developmental genes Hoxc cluster, Lhx2, Pax6, as well as a housekeeping gene Rpn1 in mouse early embryos, mESCs and somatic tissues. Eight-cell and ICM data are adopted from previously published datasets,. mESCs, cerebellum and heart data are from ENCODE. Heatmaps show the expression of corresponding genes in each lineage. The genome browser view scales were adjusted on the basis of the global data range. b, The scatter plots showing the enrichment of H3K4me3 and H3K27me3 of all bivalent genes (n = 3,992) for various cell types. The mESC and cortex ChIP-seq were performed with the same method as early lineages (STAR ChIP-seq). The average H3K4me3 enrichment of the housekeeping gene (HK.ave) is shown for each tissue. The numbers of super bivalent genes (top right) and Pearson correlations of H3K4me3 and H3K27me3 (bottom right) for each tissue are both shown. c, A pie chart showing the percentages of super and non-super bivalent genes in E6.5 Epi. The GO analysis results are also shown.
Fig. 4 |
Fig. 4 |. Loss of super bivalent H3K4me3 is associated with aberrant activation of developmental genes.
a, Heatmaps showing H3K27me3 and H3K4me3 enrichment at all promoters for WT and Kmt2b−/− embryos. The pie chart shows the percentages of active and inactive bivalent genes with enriched H3K4me3 (normalized RPKM > 0.5) in E8.5 Kmt2b−/− tissues. b, Snapshots showing H3K4me3 and gene expression at developmental genes for both WT and Kmt2b−/− embryos. The housekeeping gene Psma1 is shown as a control. Promoter H3K4me3 is shaded. The genome browser view scales were adjusted on the basis of the global data range. c, Bar charts showing the numbers of genes that are downregulated in E6.5 Epi and E8.5 head tissues in Kmt2b−/− embryos. GO and example genes at E8.5 are listed. d, Bar charts showing the Spearman correlation of changes between promoter H3K4me3 and gene expression for all genes and bivalent genes in WT (n = 3) and Kmt2b−/− (n = 3 for E6.5, n = 2 for E8.5) embryos. e, The pie charts show the percentages of super and non-super bivalent genes for inactive (FPKM < 2, n = 3,252) bivalent genes in E6.5 Epi (left). Among 72 genes that are activated (FPKM > 5) in E8.5 head (middle), 52 (C2) are activated normally while 20 (C1) show defective activation in Kmt2b−/− E8.5 embryos (right). The GO terms are also listed. The P values (hypergeometric test) show the enrichment of super bivalent genes in C1 or C2 (versus all inactive bivalent genes in E6.5 Epi). Boxplots show the gene expression and H3K4me3 enrichment in C1 or C2 for WT (n = 2) and Kmt2b−/− (n = 2) embryos. The P values were calculated by a one-tailed t-test. The median of each dataset is indicated by the center line. The bottom, top edges and whiskers represent the 25th and 75th percentiles and 1.5 times the interquartile range (IQR), respectively.
Fig. 5 |
Fig. 5 |. TET proteins promote super bivalent H3K4me3 in E6.5 Epi.
a, Snapshots showing H3K4me3, DNA methylation and H3K27me3 enrichment at two developmental genes Gata2 and Neurog3, and a housekeeping gene Rpn1 in E5.5 Epi (n = 2), E6.5 Epi (n = 2) and E6.5 VE (n = 2). The genome browser view scales were adjusted on the basis of the global data range. b, Boxplots showing H3K4me3, DNA methylation and H3K27me3 enrichment at DMVs in E5.5 Epi, E6.5 Epi and E6.5 VE. The median of each dataset is indicated by the center line. The bottom, top edges and whiskers represent the 25th and 75th percentiles and 1.5 times the IQR, respectively. The P values were calculated by two-sided t-test. c, Snapshots showing H3K4me3 and DNA methylation in WT and Kmt2b−/− E6.5 Epi (n = 3) and E8.5 head (n = 2). The genome browser view scales were adjusted on the basis of the global data range. d, Metaplots showing DNA methylation of DMVs at bivalent genes between WT and Kmt2b−/− E6.5 Epi or E8.5 head. e, Snapshots showing DNA methylation and H3K4me3 enrichment in WT and Tet1/2 DKO E6.5 Epi (n = 2). The genome browser view scales were adjusted on the basis of the global data range. f, Boxplots showing H3K4me3 for DMV bivalent genes and housekeeping genes between WT (n = 2) and Tet1/2 double knockout (n = 2) E6.5 Epi. The median of each dataset is indicated by the center line. The bottom, top edges and whiskers represent the 25th and 75th percentiles and 1.5 times the IQR, respectively. The P values were calculated by a two-sided t-test.
Fig. 6 |
Fig. 6 |. Super bivalent genes show strong spatial clustering.
a, Heatmaps (5-kb resolution) showing the normalized interaction frequencies in eight-cell, ICM, E6.5 Epi, E6.5 VE, mESCs and fibroblasts at chromosome 11 (85–86Mb). A magnified view shows interactions between super bivalent genes Tbx2 and Tbx4. Each sample has comparable c/s-long reads (−115 million). The enrichment of H3K4me3 and H3K27me3 at each stage from this study and previous work,,, is shown above the interaction heatmaps. b, Boxplots showing the normalized interaction frequencies among genes in each gene group in various cell types. Super bivalent, super bivalent genes; non-super bivalent, non-super bivalent genes; HK, housekeeping genes; inactive, nonbivalent inactive genes (Methods). The median of each dataset is indicated by the center line. The bottom, top edges and whiskers represent the 25th and 75th percentiles and 1.5 times the IQR, respectively. P values calculated by two-sided t-test are also shown.
Fig. 7 |
Fig. 7 |. Dynamic chromatin regulation of developmental genes from naïve pluripotency to committed lineages in vivo.
In mice, bivalency is absent from the promoters of developmental genes in preimplantation embryos including ICM, which shows naïve pluripotency in vivo. These developmental genes are mostly silenced and do not show spatial clustering. After implantation, developmental genes gain strong or super bivalency and strong spatial clustering in Epi, which shows primed pluripotency. After lineage specification, super bivalency and spatial clustering among developmental genes are significantly reduced. KMT2B is required for the onset of super bivalency, but only in a short period (from E6.5 to E8.5).

Similar articles

Cited by

References

    1. Rossant J & Tam PP Emerging asymmetry and embryonic patterning in early mouse development. Dev. Cell 7, 155–164 (2004). - PubMed
    1. Zernicka-Goetz M, Morris SA & Bruce AW Making a firm decision: multifaceted regulation of cell fate in the early mouse embryo. Nat. Rev. Genet. 10, 467–477 (2009). - PubMed
    1. Arnold SJ & Robertson EJ Making a commitment: cell lineage allocation and axis patterning in the early mouse embryo. Nat. Rev. Mol. Cell Biol. 10, 91–103 (2009). - PubMed
    1. Lawson KA, Meneses JJ & Pedersen RA Clonal analysis of epiblast fate during germ layer formation in the mouse embryo. Development 113, 891–911 (1991). - PubMed
    1. Bielinska M, Narita N & Wilson DB Distinct roles for visceral endoderm during embryonic mouse development. Int. J. Dev. Biol. 43, 183–205 (1999). - PubMed

Publication types