. 2019 Dec;576(7787):471-476.
doi: 10.1038/s41586-019-1821-z. Epub 2019 Dec 11.

Targeting REGNASE-1 programs long-lived effector T cells for cancer therapy

Affiliations

Targeting REGNASE-1 programs long-lived effector T cells for cancer therapy

Jun Wei et al. Nature. 2019 Dec.

Abstract

Adoptive cell therapy represents a new paradigm in cancer immunotherapy, but it can be limited by the poor persistence and function of transferred T cells1. Here we use an in vivo pooled CRISPR-Cas9 mutagenesis screening approach to demonstrate that, by targeting REGNASE-1, CD8+ T cells are reprogrammed to long-lived effector cells with extensive accumulation, better persistence and robust effector function in tumours. REGNASE-1-deficient CD8+ T cells show markedly improved therapeutic efficacy against mouse models of melanoma and leukaemia. By using a secondary genome-scale CRISPR-Cas9 screening, we identify BATF as the key target of REGNASE-1 and as a rheostat that shapes antitumour responses. Loss of BATF suppresses the increased accumulation and mitochondrial fitness of REGNASE-1-deficient CD8+ T cells. By contrast, the targeting of additional signalling factors-including PTPN2 and SOCS1-improves the therapeutic efficacy of REGNASE-1-deficient CD8+ T cells. Our findings suggest that T cell persistence and effector function can be coordinated in tumour immunity and point to avenues for improving the efficacy of adoptive cell therapy for cancer.


Conflict of interest statement

Competing interests

H.C. and J.W. are authors of a patent application related to Regnase-1 and BATF.

Figures
Extended Data Figure 1.
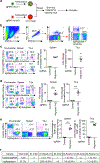
Extended Data Figure 1.. Validation of the effect of Regnase-1 deletion on CD8+ T cell accumulation in tumor immunity using the in vivo dual transfer system.
(a) Diagram of the in vivo dual transfer system. OT-I cells transduced with sgRNA viral vectors expressing distinct fluorescent proteins were mixed and transferred into the same tumor-bearing hosts where further analyses were performed. (b) Gating strategy for sgRNA-transduced OT-I cell analysis. (c, d) OT-I cells transduced with non-targeting control sgRNA (mCherry+) were mixed at a 1:1 ratio with either cells transduced with control sgRNA (Ametrine+) (c (n = 2), d (n = 5), upper left) or two different sgRNAs targeting Regnase-1 (sgRegnase-1, Ametrine+, c (n = 4), lower left; or sgRegnase-1 #2, Ametrine+, d (n = 5), lower left), and transferred into tumor-bearing hosts. Mice were analyzed at 7 days after adoptive transfer for the proportion of OT-I cells in CD8α+ cells (c, d, left), and quantification of relative OT-I cell percentage in CD8α+ cells normalized to input in the spleen and TILs (c, d, right). Numbers in plots indicate frequencies of OT-I cells. (e) OT-I cells transduced with control sgRNA (Ametrine+) were mixed at a 1:1 ratio with cells transduced with sgRegnase-1 (mCherry+), and transferred into tumor-bearing hosts (n = 5). Mice were analyzed at 7 days after adoptive transfer for the proportion of OT-I cells in CD8α+ cells (left), and quantification of relative OT-I cell percentage in CD8α+ cells normalized to input in the spleen and TILs (right). Numbers in plots indicate frequencies of OT-I cells. (f) Indel mutations after CRISPR targeted disruption in OT-I cells transduced with either control sgRNA or sgRegnase-1, via deep sequencing analysis of indels generated at the exonic target site of Regnase-1 gene, including 97.3% indel events in sgRegnase-1-transduced cells isolated from tumors as compared to 1.3% in control sgRNA-transduced cells. Mean ± s.e.m. in ce. ***P < 0.001; two-tailed unpaired Student’s t-test in d, e. Data are representative of two (e) independent experiments.
Extended Data Figure 2.
Extended Data Figure 2.. Tumor-infiltrating and peripheral Regnase-1-null CD8+ T cells show distinct immune signatures.
(a, b) GSEA enrichment plots of antigen-specific CXCR5+ and CXCR5 exhausted CD8+ T cells from chronic infection using gene targets repressed by Regnase-1 (i.e. top 100 upregulated genes in TIL sgRegnase-1- compared to control sgRNA-transduced OT-I cells as identified by RNA-Seq). (c) Representative images (left) and quantification of mean fluorescence intensity (MFI; right) of TCF-1 expression (pink) in control sgRNA- (mCherry+; red) and sgRegnase-1-transduced OT-I cells (Ametrine+; green) in the whole tumor section (n = 4 mice). Scale bars, 20 μm. (d, e) Gene expression heat maps normalized by row (z-score) for the naïve or memory T-cell−associated transcription factors (d) or effector or exhausted T-cell−associated transcription factors (e) in control sgRNA- (n = 4) and sgRegnase-1- (n = 5) transduced OT-I cells isolated from TILs. Specifically, control sgRNA- and sgRegnase-1-transduced OT-I cells were mixed and transferred into tumor-bearing mice, and tumor-infiltrating OT-I cells were isolated at day 7 for transcriptional profiling by RNA-Seq. (f) Real-time PCR analysis of Irf4 mRNA expression in control sgRNA- (n = 4 samples) and sgRegnase-1- (n = 5 samples) transduced OT-I cells isolated from TILs. (g) Summary of ATAC-Seq motif enrichment data showing log2 (odds ratio) and –log10 (FDR) of cells from control sgRNA- and sgRegnase-1-transduced OT-I cells isolated from TILs (n = 4 samples each group). Specifically, control sgRNA- and sgRegnase-1-transduced OT-I cells were mixed and transferred into tumor-bearing mice, and tumor-infiltrating OT-I cells were isolated at day 7 for ATAC-Seq analysis. (h) Tn5 insert sites from ATAC-Seq analysis were aligned to motifs for transcription factors from the TRANSFAC database, and the binding profiles of TCF-1, Bach2, Bcl6 and IRF4 are shown. (i) Venn diagram showing the overlap of significantly upregulated (left, sgRegnase-1- (n = 5 samples) versus control sgRNA-transduced OT-I cells (n = 4 samples)) or downregulated genes (right, sgRegnase-1- versus control sgRNA-transduced OT-I cells) by RNA-Seq profiling between TIL and peripheral lymph node (PLN) OT-I cells. Specifically, control sgRNA- and sgRegnase-1-transduced OT-I cells were mixed and transferred into tumor-bearing mice, and OT-I cells were isolated at day 7 for transcriptional profiling by RNA-Seq. (j) GSEA enrichment plots of PLN sgRegnase-1- (n = 5) versus control sgRNA- (n = 4) transduced OT-I cells using gene sets of four different tumor-infiltrating CD8 T-cell activation states. Specifically, control sgRNA- and sgRegnase-1-transduced OT-I cells were mixed and transferred into tumor-bearing mice, and PLN OT-I cells were isolated at day 7 for transcriptional profiling by RNA-Seq. (k) OT-I cells transduced with control sgRNA (mCherry+) and sgRegnase-1 (Ametrine+) were mixed and transferred into tumor-bearing mice (n = 5 mice), and OT-I cells in the spleen were analyzed at day 7 for expression of TCF-1 (upper), and quantification of frequency of TCF-1+ cells (lower). Numbers in graphs indicate frequencies of cells in gates. Mean ± s.e.m. in c, f, k. *P < 0.05; **P < 0.01; ***P < 0.001; Kolmogorov-Smirnov test followed by Benjamini-Hochberg correction in a, b, j, two-tailed unpaired Student’s t-test in c, f, k, two-sided Fisher’s exact test followed by Benjamini-Hochberg correction in g, and two-sided Fisher’s exact test in i. Data are representative of two (c, f, k) independent experiments.
Extended Data Figure 3.
Extended Data Figure 3.. Upstream signals regulate Regnase-1 expression and Regnase-1-null cell phenotypes.
(a) Immunoblot analysis of Regnase-1 expression in control sgRNA-transduced OT-I cells isolated from PLN and TILs at 7 days after adoptive transfer (n = 4 samples each group) (upper). Quantification of relative intensity of Regnase-1 expression (lower). β-actin is loading control. (b) GSEA enrichment plots of PLN and TIL control sgRNA-transduced OT-I cells (n = 4) used in (a) by using gene targets repressed by Regnase-1 (i.e. top 100 upregulated genes in TIL sgRegnase-1- compared to control sgRNA-transduced cells as identified by RNA-Seq). (c) OT-I cells were stimulated with αCD3 and αCD28 for overnight before viral transduction, and then cultured in IL-7 and IL-15-containing medium for another 3 days in vitro. Pre-activated OT-I cells were then stimulated with αCD3, IL-2 or IL-21 for 0, 1 and 4 h (n = 5 samples each group) for immunoblot analysis of full length and cleaved Regnase-1 (upper), and quantification of relative intensity of cleaved Regnase-1 expression (lower). β-actin is loading control. (d, e) OT-I cells transduced with control sgRNA (mCherry+) and sgRegnase-1 (Ametrine+) were mixed at a 1:1 ratio and transferred into mice bearing B16-Ova (n = 6 mice) or B16-F10 (n = 6 mice) tumors. Mice were analyzed at day 7 after adoptive transfer for quantification of relative OT-I cell percentage in total cells normalized to input in the TILs (d), and expression of TCF-1 (e, left), and quantification of frequency of TCF-1+ cells (e, right) in tumor-infiltrating OT-I cells. (f, g) OT-I cells were stimulated with αCD3 and αCD28 for overnight before viral transduction, and then cultured in IL-2, IL-7 and IL-15-containing medium for another 3 days in vitro. Pre-activated OT-I cells were then continuously cultured in normoxia (21% O2) or hypoxia (1% O2) condition for 48 h for immunoblot analysis of expression of HIF1α, Regnase-1 and BATF (f), and for flow cytometry analysis of expression of BATF, CD69, GzmB, CD25 and TCF-1 (g). Numbers in graphs indicate MFI (g). β-actin is loading control. Mean ± s.e.m. in a, ce. *P < 0.05; **P < 0.01; ***P < 0.001; two-tailed unpaired Student’s t-test in a, Kolmogorov-Smirnov test followed by Benjamini-Hochberg correction in b, and one-way ANOVA in ce. Data are representative of two (c, f, g) independent experiments, or pooled from two (d, e) independent experiments.
Extended Data Figure 4.
Extended Data Figure 4.. Proliferation and survival analyses of Regnase-1-null CD8+ T cells in tumor immunity.
(a) List of the top 10 significantly (FDR < 0.05) upregulated and downregulated pathways in TIL sgRegnase-1-transduced OT-I cells, as revealed by performing GSEA using “Hallmark” gene sets. Specifically, control sgRNA- (n = 4) and sgRegnase-1- (n = 5) transduced OT-I cells were mixed and transferred into tumor-bearing mice, and tumor-infiltrating OT-I cells were isolated at day 7 for transcriptional profiling by RNA-Seq. (b) GSEA enrichment plots of TIL sgRegnase-1-transduced OT-I cells using cell cycling-associated gene sets, including E2F targets (upper), G2M checkpoint (middle) and mitotic spindle (lower). (cg) OT-I cells transduced with control sgRNA (mCherry+) and sgRegnase-1 (Ametrine+) were mixed and transferred into tumor-bearing mice, and tumor-infiltrating OT-I cells were analyzed at day 7 (dg) (n = 6 mice) and day 14 (c) (n = 5 mice) by flow cytometry for Ki-67 expression (c, left; e, left), BrdU incorporation (d, upper; pulse for 18 h), active caspase-3 expression (f, left), Ser139 phosphorylation of histone variant H2A.X (g, upper), and quantification of MFI of Ki-67 (c, right; e, right), frequency of BrdU+ cells (d, lower), frequency of active caspase-3+ cells (f, right) and frequency of Ser139 phosphorylated histone variant H2A.X+ cells (g, lower). Numbers in graphs indicate MFI of Ki-67 (c, right; e, left). Numbers in plots indicate frequencies of BrdU+ cells (d, upper), active caspase-3+ cells (f, left) and Ser139 phosphorylated histone variant H2A.X+ cells (g, upper). (h) List of the top 15 significantly (FDR < 0.05) upregulated and top 4 significantly downregulated pathways in PLN sgRegnase-1-transduced OT-I cells, as revealed by performing GSEA using “Hallmark” gene sets. Specifically, control sgRNA- (n = 4) and sgRegnase-1- (n = 5) transduced OT-I cells were mixed and transferred into tumor-bearing mice, and PLN OT-I cells were isolated at day 7 for transcriptional profiling by RNA-Seq. (i, j) OT-I cells transduced with control sgRNA (mCherry+) and sgRegnase-1 (Ametrine+) were mixed and transferred into tumor-bearing mice, and OT-I cells in the spleen were analyzed at day 7 (i, j) (n = 6 mice) by flow cytometry for BrdU incorporation (i, upper; pulse for 18 h) and active caspase-3 expression (j, upper), and quantification of frequencies of BrdU+ cells (i, lower) and active caspase-3+ cells (j, lower). Numbers in plots indicate frequencies of BrdU+ cells (i, upper) and active caspase-3+ cells (j, upper). Mean ± s.e.m. in cg, i, j. *P < 0.05; **P < 0.01; ***P < 0.001; Kolmogorov-Smirnov test followed by Benjamini-Hochberg correction in a, b, h, two-tailed unpaired Student’s t-test in cg, i, j. Data are representative of two (c) independent experiments, or pooled from two (dg, i, j) independent experiments.
Extended Data Figure 5.
Extended Data Figure 5.. Effector molecule expression of tumor-infiltrating Regnase-1-null CD8+ T cells.
(a, b) OT-I cells transduced with control sgRNA (mCherry+) or sgRegnase-1 (Ametrine+) were mixed at a 5:1 ratio and transferred into tumor-bearing mice (n = 5 mice), and tumor-infiltrating OT-I cells were analyzed at day 7 for the expression of CD69, CD25, CD49a, KLRG1, ICOS, Lag3, PD-1 and CTLA4 (a, upper) and CD44 and CD62L (b, upper), and quantification of MFI of CD69, CD25, CD49a, KLRG1, ICOS, Lag3, PD-1 and CTLA4 (a, lower) and frequency of CD44+CD62L cells (b, lower). Numbers in graphs indicate MFI (a, upper). Numbers in plots indicate frequency of CD44+CD62L cells (b, upper). (cf) OT-I cells transduced with control sgRNA (mCherry+) or sgRegnase-1 (Ametrine+) were mixed at a 5:1 ratio and transferred into tumor-bearing mice, and analyzed at days 7 (n = 10 mice) or 14 (n = 10 mice). Flow cytometry analysis of expression of IFN-γ (c, upper), GzmB (c, lower), TNF-α (e, upper) and IL-2 (e, lower) in TIL OT-I cells, and quantification of the numbers of IFN-γ+ cells (d, upper), GzmB+ cells (d, lower), TNF-α+ cells (f, left) and IL-2+ cells (f, right) normalized to input per gram tissue. Numbers adjacent to outlined areas indicate frequency of IFN-γ+ cells and MFI of IFN-γ in IFN-γ+ cells (c, upper), and frequency of GzmB+ cells and MFI of GzmB in GzmB+ cells (c, lower), and frequencies of TNF-α+ cells (e, upper), or IL-2+ cells (e, lower). Mean ± s.e.m. in a, b, d, f. *P < 0.05; **P < 0.01; ***P < 0.001; two-tailed unpaired Student’s t-test in a, b, and two-tailed paired Student’s t-test in d, f. Data are representative of two (ac, e) independent experiments, or pooled from two (d, f) independent experiments.
Extended Data Figure 6.
Extended Data Figure 6.. scRNA-Seq and flow cytometry analyses of tumor-infiltrating Regnase-1-null OT-I cells.
(ae) scRNA-Seq analysis of control sgRNA- and sgRegnase-1-transduced OT-I cells isolated from TILs. Specifically, control sgRNA- and sgRegnase-1-transduced OT-I cells were mixed and transferred into tumor-bearing mice, and tumor-infiltrating OT-I cells were isolated at day 7 for transcriptional profiling by scRNA-Seq. tSNE visualization of Pdcd1 (a, upper), Havcr2 (a, lower), Ifng (c, upper), Gzmb (c, lower), Batf (d) and Id2 (e) gene expression, and “CXCR5+ exhausted CD8 (Ahmed)” (b, upper) and “CXCR5+ exhausted CD8 (Yu)” (b, lower) gene signatures in individual cells. (f) OT-I cells transduced with control sgRNA and sgRegnase-1 were mixed and transferred into tumor-bearing mice (n = 5 mice; data from one representative mouse were shown), and tumor-infiltrating OT-I cells were analyzed at day 7 for the expression of TOX, Slamf6, CD127, KLRG1, Tim3 and PD-1 in TCF-1+ and TCF-1 cells of control sgRNA- and sgRegnase-1-transduced OT-I cells. Numbers in graphs indicate mean ± s.e.m. of MFI of markers on the x-axis after gating on TCF-1+ or TCF-1 subsets. Data are representative of two (f) independent experiments.
Extended Data Figure 7.
Extended Data Figure 7.. Genome-scale CRISPR screening identifies BATF as an important Regnase-1 functional target in tumor immunity.
(a) Scatterplot of the enrichment of each gene versus its adjusted P value in genome-scale CRISPR screening. Gene enrichment was calculated by averaging the enrichment of their sgRNAs (n = 4 for each gene) in tumor-infiltrating OT-I cells relative to input (log2 ratio (TIL/input)), with the most extensively enriched (red) and selectively depleted (blue) genes (adjusted P < 0.05), as well as ‘dummy’ genes (green; generated by random combinations of 4 out of 1,000 non-targeting control sgRNAs per ‘dummy’ gene). (b) Venn diagram showing the overlap of genes between top depleted genes in genome-scale CRISPR screening (by less than −3.5 log2 (TIL/input) fold change; adjusted P < 0.05) and top upregulated genes in TIL sgRegnase-1- versus control sgRNA-transduced OT-I cells as identified by RNA-Seq (by greater than 1.5 log2 fold change; P < 0.05). (c) Tn5 insert sites from ATAC-Seq analysis were aligned to motifs for transcription factors from the TRANSFAC database, and the binding profiles of BATF are shown. (d) Enrichment of BATF-binding motifs in the genomic regions with upregulated accessibility in Regnase-1-null cells. First, we analyzed common regions in our Regnase-1-null ATAC-Seq data and published BATF ChIP-Seq peaks (GSE54191). Next, we scanned these common regions with TRANSFAC motifs for BATF, and numbers of motif matches and associated Fisher’s exact test P values and log2 (odds ratios) are shown (a positive log2 (odds ratio) value indicates that a motif is more likely to occur in Regnase-1-null cells than in wild-type samples; ‘E − x’ denotes ‘×10−x’). (e) Luciferase activity of HEK293T cells measured at 48 h after transfection with Il2 mRNA 3’ UTR (upper) or Il4 mRNA 3’ UTR (lower) luciferase reporter plasmid, together with control (mock), wild-type or D141N Regnase-1-expressing plasmid (n = 3 samples each group). (f) OT-I cells transduced with control sgRNA (mCherry+; spike) were mixed at a 1:1 ratio with cells transduced with control sgRNA (Ametrine+), sgRegnase-1 (Ametrine+), sgBatf (GFP+) or sgBatf/Regnase-1 (GFP+ and Ametrine+), and transferred into tumor-bearing hosts individually (n = 4 mice each group). Mice were analyzed at 5 days after adoptive transfer for quantification of relative OT-I cell percentage in CD8α+ cells normalized to spike in the spleen (f, left) and TILs (f, right), and quantification of relative MFI of BATF normalized to spike in the tumor-infiltrating OT-I cells (f). (g) Immunoblot analysis of Regnase-1 and BATF expression in in vitro cultured OT-I cells 3 days after transduction with control sgRNA or sgBatf/Regnase-1. Hsp90 is loading control. (hk) The same transfer system as in (f) was used. Five days after adoptive transfer, mice were analyzed for quantification of relative OT-I cell percentage in CD8α+ cells normalized to spike in the spleen (h, left, n = 4) and TILs (h, right, n = 4). Tumor-infiltrating OT-I cells were analyzed at day 5 (n = 4 mice each group) for quantification of relative frequency of active caspase-3+ cells normalized to spike (i), and quantification of relative frequency of TCF-1+ cells normalized to spike (j), or at day 7 (n = 6 mice each group) for quantification of relative frequency of IFN-γ+ cells normalized to spike (k). (l) 4 × 10⁶ pmel-1 cells transduced with sgRegnase-1 (Ametrine+) (n = 10 recipients) or sgBatf/Regnase-1 (GFP+ and Ametrine+) (n = 10 recipients) were transferred into mice at day 12 after B16-F10 melanoma engraftment, followed by analysis of tumor size. Mean ± s.e.m. in f, hk. Mean ± s.d. in e. *P < 0.05; **P < 0.01; ***P < 0.001; two-tailed unpaired Student’s paired t-test followed by Bonferroni correction in a, two-sided Fisher’s exact test in d, one-way ANOVA in e, f, hk, and two-way ANOVA in l. Data are representative of two (e) or three (h) independent experiments, or pooled from two (f, g, il) independent experiments.
Extended Data Figure 8.
Extended Data Figure 8.. BATF overexpression markedly enhances CD8+ T cell antitumor responses.
(a) OT-I cells were stimulated with αCD3 and αCD28 for overnight before viral transduction, and then cultured in IL-7 and IL-15-containing medium for another 3 days in vitro. Control sgRNA- and sgRegnase-1-transduced OT-I cells were then stimulated with αCD3, IL-2 or IL-21 for overnight for flow cytometry analysis of BATF expression (upper), and quantification of the MFI of BATF (lower) (n = 6 samples each group). Numbers in graphs indicate MFI (upper) and fold change between comparisons (lower). (bh) OT-I cells transduced with control retrovirus (mCherry+) were mixed at a 1:1 ratio with cells transduced with Batf-overexpressing retrovirus (GFP+), and transferred into tumor-bearing hosts. Mice were analyzed at day 4 (e) (n = 4 mice), day 5 (b, h) (n = 4 mice), day 7 (c, d, f, g) (n = 6–8 mice) or day 14 (c, d) (n = 6 mice) for the expression of BATF (b, left), active caspase-3 (f, left), IFN-γ, GzmB, TNF-α and IL-2 (g, left), and TCF-1 (h, upper) in TIL OT-I cells, and quantification of MFI of BATF in TIL OT-I cells (b, right), and quantification of frequencies of active caspase-3+ cells (f, right), IFN-γ+, GzmB+, TNF-α+ and IL-2+ cells (g, right), and TCF-1+ cells (h, lower) in TIL OT-I cells, and analysis of the proportion of donor-derived OT-I cells in total CD8α+ cells in TILs and spleen (c), and quantification of relative OT-I cell percentage in CD8α+ cells normalized to input in the spleen (d), and the dilution of CellTrace Violet (CTV) in TIL OT-I cells (e, left), and quantification of MFI of CTV in TIL OT-I cells (e, right). Numbers in graphs indicate MFI (b, left; e, left), frequencies of OT-I cells in gates (c), frequency of active caspase-3+ cells (f, left), frequencies of IFN-γ+, GzmB+, TNF-α+ or IL-2+ cells (g, left), and frequency of TCF-1+ cells (h, upper). Mean ± s.e.m. in a, b, dh. *P < 0.05; **P < 0.01; ***P < 0.001; two-tailed unpaired Student’s t-test in a, b, dh. Data are representative of two (a, c) independent experiments, or pooled from two (b, dh) independent experiments.
Extended Data Figure 9.
Extended Data Figure 9.. Genome-scale CRISPR screening identifies mitochondrial metabolism as an important downstream pathway of Regnase-1 and BATF.
(a) Chromatin accessibility heat maps normalized by row (z-score) for 7,480 genes with significantly increased chromatin accessibility (by |log2 FC| > 0.5; P < 0.05) in sgRegnase-1-transduced OT-I cells as compared to control sgRNA-transduced cells. Specifically, OT-I cells transduced with control sgRNA (mCherry+) (n = 4), sgRegnase-1 (Ametrine+) (n = 4), sgBatf (GFP+) (n = 2) or sgBatf/Regnase-1 (GFP+ and Ametrine+) (n = 4) were transferred into tumor-bearing hosts individually. OT-I cells were isolated from TILs at day 7 for ATAC-Seq analysis. We annotated the differential accessibility (DA) regions in ATAC-Seq for the nearest genes, and identified 7,480 genes with significantly increased chromatin accessibility in Regnase-1-null cells as compared to wild-type cells. BATF co-deletion reversed the upregulated chromatin accessibility for a large proportion of these genes (5,052 in total). Also, 2,527 among these 5,052 genes showed significantly downregulated chromatin accessibility in BATF-null cells as compared to wild-type cells. (b) Functional enrichment plots of the top 10 significantly (FDR < 0.05) enriched pathways in top-ranking depleted genes (n = 4 sgRNAs for each gene) identified in the genome-scale CRISPR screening (by less than −3.5 log2 (TIL/input) fold change; adjusted P < 0.05). (c) GSEA enrichment plots of TIL sgRegnase-1-transduced OT-I cells using the OXPHOS “Hallmark” gene set. Specifically, control sgRNA- and sgRegnase-1-transduced OT-I cells were mixed and transferred into tumor-bearing mice, and tumor-infiltrating OT-I cells were isolated at day 7 for transcriptional profiling by RNA-Seq. (d) Representative images (upper) and quantification of mitochondrial volume (stained with Tom20, white) per cell (lower) in control sgRNA- (mCherry+; red) and sgRegnase-1-transduced OT-I cells (Ametrine+; green) in tumors at 7 days after adoptive transfer (n = 4 mice). (e) Oxygen consumption rate (OCR) bioenergetic profiling of control sgRNA- and sgRegnase-1-transduced OT-I cells cultured in vitro for basal (left) and maximal (right) OCR (n = 9 samples each group). (f) List of the top 2 significantly (FDR < 0.05) upregulated and top 8 significantly downregulated pathways in TIL sgBatf/Regnase-1- (n = 3 samples) versus sgRegnase-1-transduced (n = 3 samples) OT-I cells isolated from TILs, as revealed by performing GSEA using “Hallmark” gene sets. Specifically, sgRegnase-1- and sgBatf/Regnase-1-transduced OT-I cells were mixed and transferred into tumor-bearing mice, and tumor-infiltrating OT-I cells were isolated at day 7 for transcriptional profiling by microarray. (g) GSEA enrichment plots of TIL sgBatf/Regnase-1- (n = 3 samples) versus sgRegnase-1-transduced OT-I cells (n = 3 samples) using OXPHOS gene set. (h) OT-I cells transduced with control sgRNA (mCherry+; spike) were mixed at a 1:1 ratio with cells transduced with control sgRNA (Ametrine+), sgRegnase-1 (Ametrine+), sgBatf (GFP+) or sgBatf/Regnase-1 (GFP+ and Ametrine+), and transferred into tumor-bearing hosts individually (n = 4 mice each group). Mice were analyzed at 5 days after adoptive transfer for quantification of relative MFI of TMRM (left) and Mitotracker (right) normalized to spike in tumor-infiltrating OT-I cells. (i) Chromatin accessibility heat maps normalized by row (z-score) for mitochondrial genes with significantly increased chromatin accessibility (by |log2 FC| > 0.5; P < 0.05) in sgRegnase-1-transduced OT-I cells as compared to control sgRNA-transduced cells as determined by ATAC-Seq as described in a. We annotated the DA regions in ATAC-Seq for the nearest genes, and superimposed these genes with 1,158 mitochondrial genes defined in MitoCarta 2.0 database. A total of 341 mitochondrial genes showed significantly upregulated chromatin accessibility in the absence of Regnase-1, 214 of which were blocked by BATF co-deletion in BATF/Regnase-1-null cells. Moreover, 96 among these 214 genes showed significantly downregulated chromatin accessibility in BATF-null cells as compared to wild-type cells. Mean ± s.e.m. in d, e, h. *P < 0.05; **P < 0.01; ***P < 0.001; two-sided Fisher’s exact test in a, i, right-tailed Fisher’s exact test in b, Kolmogorov-Smirnov test followed by Benjamini-Hochberg correction in c, f, g, two-tailed unpaired Student’s t-test in d, e, and one-way ANOVA in h. Data are representative of two (d, e) independent experiments, or pooled from two (h) independent experiments.
Extended Data Figure 10.
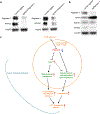
Extended Data Figure 10.. PTPN2 and SOCS1 deletion efficiency and expression in Regnase-1-null cells, and model of Regnase-1 functions in tumor-specific CD8+ T cells.
(a) Immunoblot analysis of Regnase-1, PTPN2 and SOCS1 expression in in vitro cultured OT-I cells 3 days after transduction with control sgRNA, sgPtpn2/Regnase-1 (left), or sgSocs1/Regnase-1 (right). Hsp90 is loading control. (b) Immunoblot analysis of Regnase-1, BATF, SOCS1 and PTPN2 expression in control sgRNA- and sgRegnase-1-transduced OT-I cells cultured in vitro for 3 days after viral transduction. β-actin is loading control. (c) Regnase-1 is a major negative regulator of CD8+ T cell antitumor responses, and TCR and IL-2 inhibit its expression and activity. Deletion of Regnase-1 unleashes potent therapeutic efficacy of engineered tumor-specific CD8+ T cells against cancers by coordinating transcriptional and metabolic programs to achieve greatly improved cell accumulation and function. As a key functional target of Regnase-1, excessive BATF drives robust cell accumulation and effector function, in part through enhancing mitochondrial metabolism, in Regnase-1-null CD8+ T cells. Regnase-1 deletion also reprograms cells to acquire increased naïve/memory cell-associated gene signatures and gain survival advantage, which contribute to the improved persistence of Regnase-1-null effector CD8+ T cells. Targeting PTPN2 and SOCS1 (not depicted here) acts in coordination with Regnase-1 inhibition to promote CD8+ T cell antitumor responses. Data are representative of three (a, b) independent experiments.
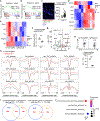
Figure 1.
Figure 1.. In vivo CRISPR screening identifies Regnase-1 as a major negative regulator of CD8+ T cell antitumor responses.
(a) Diagram of CRISPR screening for metabolic regulators of ACT. (b) Scatterplot of the enrichment of candidates (n = 6 sgRNAs per gene) with the most extensively enriched (red) and selective depleted (blue) genes, as well as ‘dummy’ genes (green; generated by random combinations of 6 out of 1,000 non-targeting control sgRNAs per ‘dummy’ gene) highlighted. (c) Representative images (left) and quantification of relative OT-I cell number per area (μm2) normalized to input (right) in the tumor section (n = 4). OT-I cells transduced with control sgRNA (red) and sgRegnase-1 (green) were mixed at a 10:1 ratio and transferred into tumor-bearing mice, and analyzed at day 7. Scale bars, 500 μm. (d, e) Control sgRNA- and sgRegnase-1-transduced OT-I cells were mixed at a 10:1 ratio and transferred into tumor-bearing mice, followed by analyses of the proportion of OT-I cells in total CD8α+ cells (d), and quantification of normalized OT-I cell number relative to input (e) at days 7 (n = 10), 14 (n = 10) and 21 (n = 6). Cell number in the tumor indicates per gram tissue. Mean ± s.e.m. in c, e. *P < 0.05; **P < 0.01; ***P < 0.001; two-tailed paired Student’s t-test followed by Bonferroni correction in b, two-tailed unpaired Student’s t-test in c, e. Data are representative of two (c, d), or pooled from two (e) independent experiments.
Figure 2.
Figure 2.. Deletion of Regnase-1 enhances efficacy of ACT against solid and blood cancers.
OT-I (a, b), pmel-1 (c, d) or CD8+ CAR-T (e, f) cells (5 × 10⁶) transduced with non-targeting control sgRNA or sgRegnase-1 were transferred into mice at day 12 after B16-Ova (a, b) or B16-F10 (c, d) melanoma engraftment, or at day 7 after Ph+ B-ALL cell engraftment (e, f), followed by analyses of tumor size (a, c), mouse survival (b, d, e) and tumor burden via Xenogen imaging of bioluminescent signal intensities (f). Non-treatment control mice received no T cell transfer. *P < 0.05; **P < 0.01; ***P < 0.001; two-way ANOVA in a, c, and Log-rank (Mantel-Cox) test in b, d, e. Data are representative of two (a, b, e, f) or four (c, d) independent experiments.
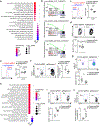
Figure 3.
Figure 3.. Deletion of Regnase-1 reprograms tumor-infiltrating CD8+ T cells to long-lived effector cells.
(a) GSEA enrichment plots of RNA-Seq from sgRegnase-1- (n = 5) versus non-targeting control sgRNA- (n = 4) transduced OT-I cells isolated from TILs from the dual transfer system, using gene sets of tumor-infiltrating CD8+ T cell activation states. (bd) Tumor-infiltrating sgRNA-transduced OT-I cells from the dual transfer system (n = 5) were analyzed at days 7 (b) and 14 (c, d) for the quantification of frequencies of TCF-1+ (b), BrdU+ (c) and active caspase-3+ (d) cells. (eg) Diagram of in vivo persistence assay (e): sgRNA-transduced OT-I cells were isolated from TILs, mixed at a 1:1 ratio (1 × 10⁵ each) and transferred into tumor-bearing hosts (f) or naïve mice (g). Quantification of normalized OT-I cell frequency in TILs of tumor-bearing hosts (n = 6) (f) or in the spleen of naïve hosts (n = 6) (g). (hk) Tumor-infiltrating sgRNA-transduced OT-I cells from the dual transfer system were analyzed at days 7 (n = 10) and 14 (n = 10) for the quantification of frequencies of IFN-γ+ cells (h, left), GzmB+ cells (h, right), TNF-α+ cells (j, left), IL-2+ cells (j, right) and polyfunctional IFN-γ+TNF-α+IL-2+ cells (k, left) in OT-I cells, and mean fluorescence intensity (MFI) of IFN-γ and GzmB in IFN-γ+ and GzmB+ cells, respectively (i), and cell number (normalized to input) per gram tissue (k, right) of polyfunctional IFN-γ+TNF-α+IL-2+ OT-I cells. (ln) scRNA-Seq analysis of tumor-infiltrating sgRNA-transduced OT-I cells isolated from the dual transfer system at day 7. tSNE visualization of OT-I cells indicating genotypes (l, left), Tcf7hi and Tcf7lo cells (l, right), and Tcf7 (m, left), Slamf6 (m, right) and Tox (n) gene expression in individual cells. Mean ± s.e.m. in bd, f–k. *P < 0.05; **P < 0.01; ***P < 0.001; Kolmogorov-Smirnov test followed by Benjamini-Hochberg correction in a; two-tailed unpaired Student’s t-test in bd, f, g; two-tailed paired Student’s t-test in h–k. Data are representative of three (b), or pooled from two (c, d, f–k) independent experiments.
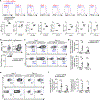
Figure 4.
Figure 4.. BATF is a key Regnase-1 functional target to mediate mitochondrial fitness and effector responses.
(a) Diagram of secondary genome-scale CRISPR screening. (b) Tumor-infiltrating sgRNA-transduced OT-I cells from the dual transfer system (n = 6) were analyzed at day 7 for BATF expression (left), and quantification of BATF MFI (right). (c) Luciferase activity of HEK293T cells after transfection with Batf mRNA 3’ UTR reporter, together with control (mock), wild-type or D141N Regnase-1-expressing plasmid (n = 3). (d, e) In vivo accumulation of sgRNA- and double sgRNA-transduced OT-I cells (d) or Batf-overexpressing retrovirus-transduced OT-I cells (e) in the dual transfer system (n = 6). OT-I cell percentage in CD8α+ cells was normalized to co-transferred non-targeting control sgRNA-transduced spike cells (d). (f–h) Tumor-infiltrating OT-I cells transduced with sgRNA (f; n = 6), double sgRNA (g; n = 6) and Batf-overexpressing retrovirus (h; n = 8) from the dual transfer system were analyzed at day 7 for the quantification of MFI of TMRM (left) and Mitotracker (right). MFI of TMRM and Mitotracker was normalized to those of co-transferred control sgRNA-transduced spike cells (g). Mean ± s.e.m. in b, dh. Mean ± s.d. in c. *P < 0.05; **P < 0.01; ***P < 0.001; two-tailed paired Student’s t-test in f, two-tailed unpaired Student’s t-test in b, e, h, and one-way ANOVA in c, d, g. Data are representative of two (c), or pooled from two (b, dh) independent experiments.
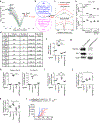
Figure 5.
Figure 5.. Genome-scale CRISPR screening identifies PTPN2 and SOCS1 as additional targets to enhance Regnase-1-null CD8+ T cell antitumor activity.
(ae) OT-I cells transduced with non-targeting control sgRNA (spike) were mixed at a 1:1 ratio with cells transduced with non-targeting control sgRNA, sgRegnase-1, sgPtpn2, sgPtpn2/Regnase-1, sgSocs1 or sgSocs1/Regnase-1, and transferred into tumor-bearing hosts individually (n = 6). Tumor-infiltrating OT-I cells were analyzed at day 7 for quantification of relative OT-I cell percentage in CD8α+ cells normalized to spike (a), quantification of relative MFI of TMRM (b), Mitotracker (c) and BATF (d) normalized to spike, and quantification of relative frequency of TCF-1+ cells normalized to spike (e). (f) sgRNA- or double sgRNA-transduced pmel-1 cells (4 × 10⁶) were transferred into mice at day 12 after B16-F10 melanoma engraftment, followed by analysis of tumor size. Non-treatment control mice received no T cell transfer. Mean ± s.e.m. in ae. *P < 0.05; **P < 0.01; ***P < 0.001; one-way ANOVA in ae, and two-way ANOVA in f. Data are pooled from two (af) independent experiments.

Comment in

Similar articles

Cited by

References

    1. Lim WA & June CH The Principles of Engineering Immune Cells to Treat Cancer. Cell 168, 724–740, doi:10.1016/j.cell.2017.01.016 (2017). - DOI - PMC - PubMed
    1. Gattinoni L et al. Acquisition of full effector function in vitro paradoxically impairs the in vivo antitumor efficacy of adoptively transferred CD8+ T cells. J Clin Invest 115, 1616–1626, doi:10.1172/JCI24480 (2005). - DOI - PMC - PubMed
    1. Kishton RJ, Sukumar M & Restifo NP Metabolic Regulation of T Cell Longevity and Function in Tumor Immunotherapy. Cell Metab 26, 94–109, doi:10.1016/j.cmet.2017.06.016 (2017). - DOI - PMC - PubMed
    1. Muri J et al. The thioredoxin-1 system is essential for fueling DNA synthesis during T-cell metabolic reprogramming and proliferation. Nat Commun 9, 1851, doi:10.1038/s41467-018-04274-w (2018). - DOI - PMC - PubMed
    1. Peng M et al. Aerobic glycolysis promotes T helper 1 cell differentiation through an epigenetic mechanism. Science 354, 481–484, doi:10.1126/science.aaf6284 (2016). - DOI - PMC - PubMed

Publication types

MeSH terms

Substances