. 2019 Dec 11;10(1):5658.
doi: 10.1038/s41467-019-13605-4.

Extracellular matrix hydrogel derived from decellularized tissues enables endodermal organoid culture

Affiliations

Extracellular matrix hydrogel derived from decellularized tissues enables endodermal organoid culture

Giovanni Giuseppe Giobbe et al. Nat Commun. .

Abstract

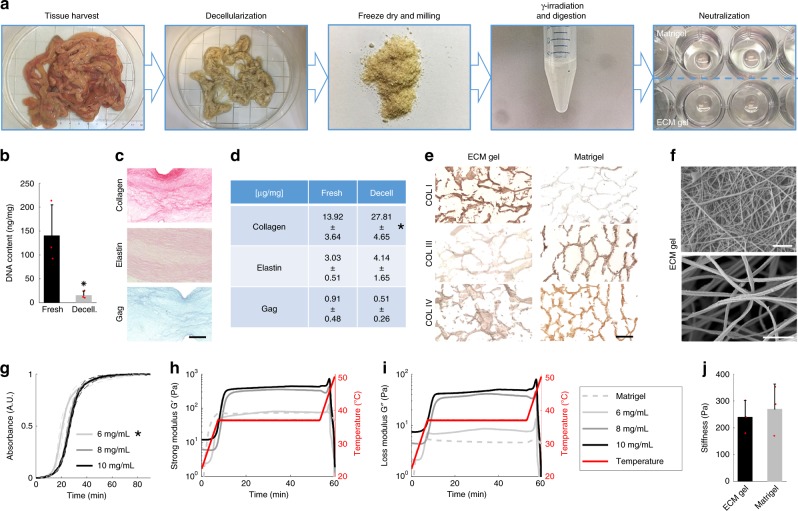
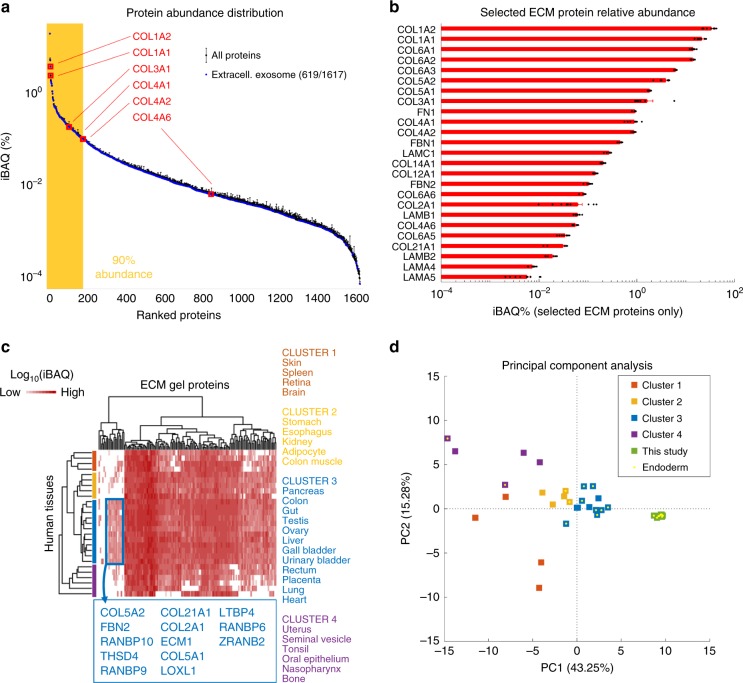
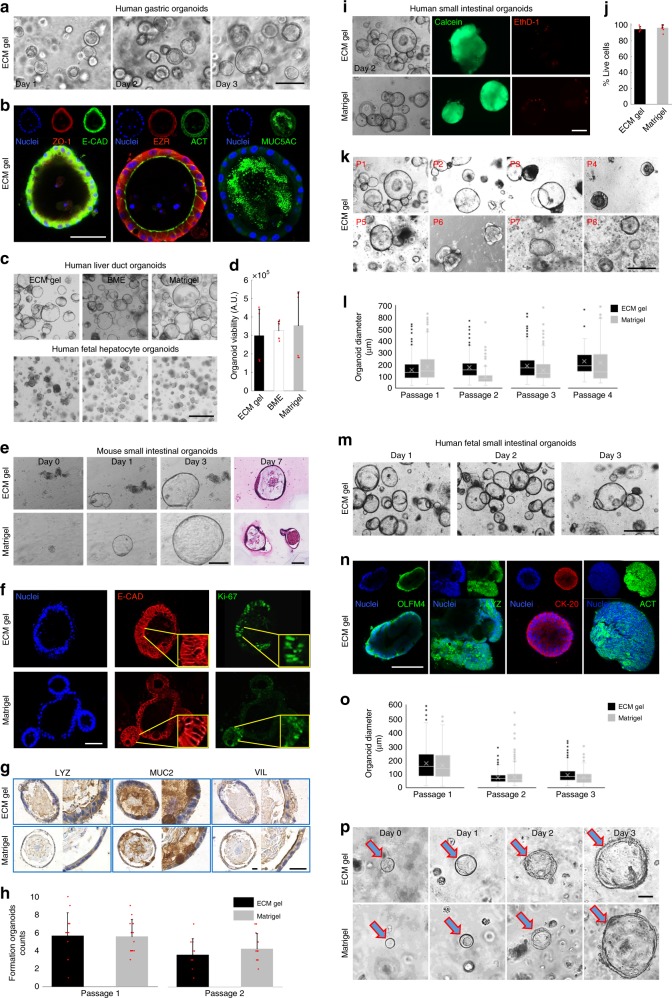
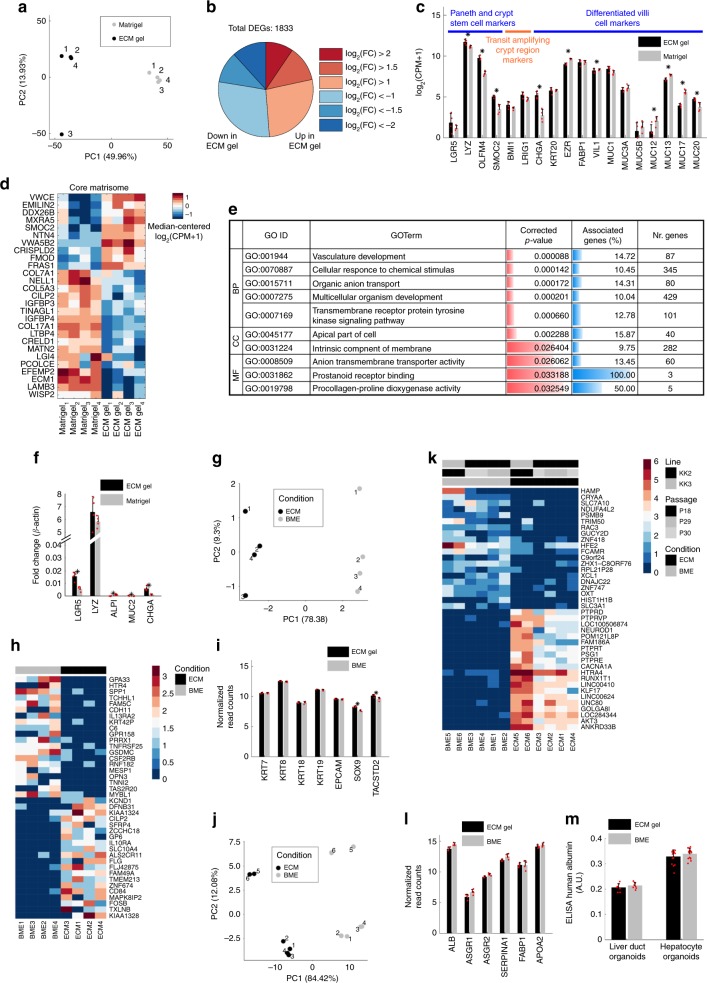
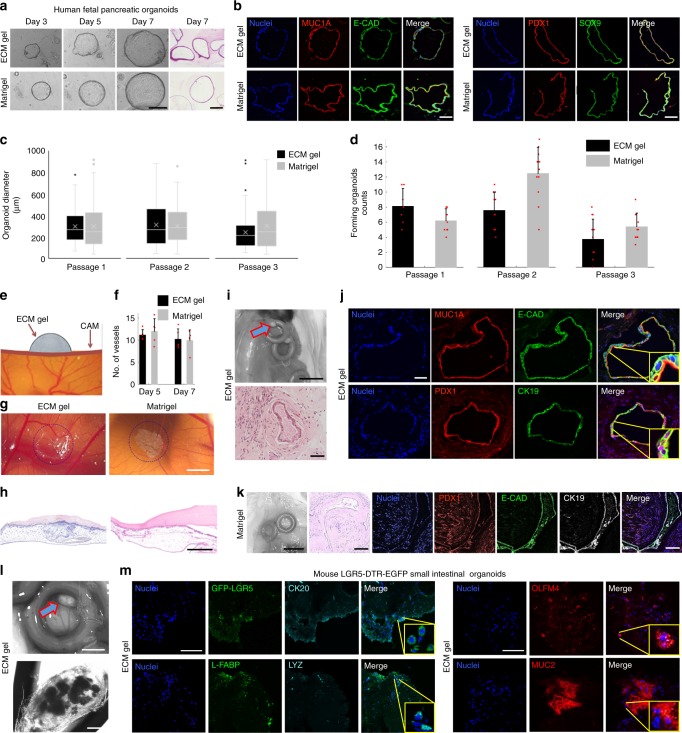
Organoids have extensive therapeutic potential and are increasingly opening up new avenues within regenerative medicine. However, their clinical application is greatly limited by the lack of effective GMP-compliant systems for organoid expansion in culture. Here, we envisage that the use of extracellular matrix (ECM) hydrogels derived from decellularized tissues (DT) can provide an environment capable of directing cell growth. These gels possess the biochemical signature of tissue-specific ECM and have the potential for clinical translation. Gels from decellularized porcine small intestine (SI) mucosa/submucosa enable formation and growth of endoderm-derived human organoids, such as gastric, hepatic, pancreatic, and SI. ECM gels can be used as a tool for direct human organoid derivation, for cell growth with a stable transcriptomic signature, and for in vivo organoid delivery. The development of these ECM-derived hydrogels opens up the potential for human organoids to be used clinically.


Conflict of interest statement

G.G.G., C.C., N.E., and P.D.C. declare that part of the results have been submitted for patent consideration. H.C. and K.K. are inventors on patent applications/patents related to organoid technology. The other authors of this study declare that they do not have anything to disclose regarding funding or conflict of interest with respect to this manuscript.

Figures

Fig. 1
Fig. 1. Extracellular matrix hydrogel characterization.
a The gelation preparation protocol consists of decellularization of the SI mucosa/submucosa, freeze-drying process, milling into a fine powder, gamma-irradiating and digesting the powder in pepsin and HCl for 72 h, and neutralization to a physiological pH, salinity and temperature. b DNA quantification in fresh (immediately after organ harvest) and decellularized piglet mucosa. Mean ± S.D. (n = 3 small intestines). Two-sided t-test *P < 0.05. Asterisk denotes significance. Red dots show individual data points. c Histological sections of fixed ECM gel drops stained with Picrosirius Red, Verhoeff’s and Alcian Blue for collagen, elastin and glycosaminoglycans, respectively. Scale bar 200 μm. d Quantification of ECM proteins: collagen, elastin and GAG. Mean ± S.D. (n = 3 gel batches). Two-sided t-test *P < 0.05. e Analysis of the collagen types in ECM gel and Matrigel by staining for collagen I, III, and IV. Scale bar 100 μm. f Scanning electron microscopy (SEM) images of the ECM gel displaying the interconnected fibrous network. Scale bars 1 µm. g Spectrophotometry used to assess the turbidity of the samples during gelation. Mean ± S.D. (n = 2 gel batches). Two-sided t-test *P < 0.05 of Tlag. h, i Oscillatory rheology provides a rheological profile of various concentrations of the ECM gel and Matrigel, for both h storage modulus and i loss modulus. j Elastic modulus measured by nanoindentation of 6 mg/mL ECM gel vs. Matrigel in 30 µL drops. Mean ± S.D. (n = 3 gel droplets). Two-sided t-test *P < 0.05.
Fig. 2
Fig. 2. ECM proteomic analysis.
a Protein abundance range, with 619 (on 1617 total) proteins mapped to GO-CC:0070062~extracellular exosomes highlighted. Yellow-shaded area represents the range covering 90% of total protein abundance. Collagens analyzed in Fig. 1e are also highlighted. Mean ± SEM (n = 3 batches, with three technical replicates each). b Relative abundance of selected ECM proteins. Black dots represent individual data points. Mean ± SEM (n = 3 batches, with three technical replicates each). c Hierarchical clustering analysis of mass spectrometry native human tissue data from a draft map of the human proteome, conducted for proteins in our data mapped to GO-CC:0031012~ECM. Four main clusters are identified whose color-coded tissues are reported on the right. A small group of proteins especially expressed in cluster 3 is highlighted. A fully detailed version of this heat map is reported in Supplementary Fig. 3. d Principal component analysis (PCA) of data from native human tissue reported in (c), and of data generated in this study. Tissues and samples having endodermal origin are also highlighted.
Fig. 3
Fig. 3. 3D culture of endodermal organoids in ECM gel and Matrigel.
a Human pediatric gastric enteroids in ECM gel. Scale bar 200 µm. b Planes of whole-mount immunofluorescence of 7-days gastric organoids showing both epithelial (zonula occludens-1, epithelial cadherin and actin) and gastric (ezrin and mucin-5AC) markers. Scale bar 50 µm. c Culture of liver ductal and hepatocyte human organoids in ECM gel, BME and Matrigel. Scale bar 500 µm. d Hepatocyte organoid viability. Mean ± S.D. (n = 8 organoid cultures). e Bright field and H&E images of mouse intestinal organoids in ECM gel and Matrigel. Scale bars 100 µm. f Immunofluorescence analysis of sections of mouse SI organoids in ECM gel and Matrigel, showing epithelial cadherin staining and proliferation marker Ki-67+. Scale bar 50 µm. g Immunohistochemical staining of mouse intestinal organoids in ECM gel and Matrigel. Scale bars 25 µm. h Forming mouse intestinal organoids per field of view at day 4 of culture in ECM gel and Matrigel over two passages. Mean ± S.D. (n = 12 organoid cultures). i Live/Dead assay of human pediatric SI organoids cultured in ECM gel and Matrigel. Calcein-AM shows living cells. Ethidium homodimer-1 shows dead cells. Scale bar 200 µm. j Quantification of vital cells from Live/Dead assay. Mean ± S.D. (n = 8 organoid cultures). k Morphology of eight consecutive passages over a period of 2 months of human pediatric SI organoids in ECM gels. Scale bar 300 µm. l Analyses of four consecutive passages of human pediatric SI organoids diameters at day 3 of culture in ECM gel and Matrigel. Mean ± S.D. (n ≈ 200 organoids). m Bright field of human fetal SI organoids in ECM gel. Scale bar 200 µm. n Whole-mount immunofluorescence Z-Planes of human fetal SI organoids showing crypt stem cell marker olfactomedin-4, crypt Paneth cell marker lysozyme, villi enterocyte marker keratin-20 and actin staining. Scale bar 100 µm. o Analyses of three consecutive passages of human fetal SI organoids diameters at day 3 of culture. (n ≈ 380 organoids). p Single-cell colony (arrows) formation capacity assessed over 3 days in disaggregated human fetal SI organoids in ECM gel and Matrigel. Scale bar 25 µm. Box plots are represented with the central line indicating the median of values, bounds of box indicating first and third quartiles, and whiskers to show minimum and maximum outside the first and third quartiles.
Fig. 4
Fig. 4. Transcriptomic analysis results of different ECM organoids.
ae Pediatric SI organoids. a PCA analysis. b Number of DEGs upregulated and downregulated in ECM compared to Matrigel for different absolute log-fold change ratios. c Expression of genes selected for their involvement in the indicated processes. Mean ± S.D. (n = 4 biological replicates). Black asterisks indicate DEGs. d Heat map of expression of core matrisome DEGs ordered according to hierarchical clustering. Supplementary Fig. 6a reports the corresponding analysis for matrisome-associated transcripts. e Selected GO categories enriched in DEGs between ECM and Matrigel involved in the interaction of cells with the extracellular space. Full results are reported in Supplementary Data 2 and Supplementary Fig. 6b. f Real-time PCR analysis of SI transcripts. Mean ± SEM (n = 4 biological replicates). Two-sided t-test p-value < 0.05. g PCA plot on human ductal liver organoids cultured in ECM gel vs BME. h Heat map of top 20 upregulated and top 20 downregulated genes ECM gel vs BME ductal organoids. i Ductal liver transcripts plot comparison in ECM gel vs. BME. Mean ± S.D. (n = 4 biological replicates). Black asterisks indicate DEGs. j PCA plot on human fetal hepatocyte organoids cultured in ECM gel vs. BME. k Heat map of top 20 upregulated and top 20 downregulated genes ECM gel vs BME hepatocyte organoids. l Hepatic transcripts plot comparison in ECM gel vs. BME. Mean ± S.D. (n = 4 biological replicates). m Comparison of ALB expression in ductal and hepatocyte organoids by ELISA assay. Mean ± S.D. (n = 3 biological, with four technical replicates each). Red dots on the bar charts represent single data points throughout the figure.
Fig. 5
Fig. 5. In vivo delivery of ECM gel-cultured organoids.
a 3D culture of human fetal pancreatic ducts in ECM gel and Matrigel. Bright field and H&E images of the pancreatic organoids. Scale bars 100 µm. b Immunofluorescence analysis of sections of pancreatic organoids in ECM gel and Matrigel, showing expression of mucin-1A, epithelial cadherin, together with insulin promoter factor 1 and cytokeratin-19. Scale bar 50 µm. c Analyses of three consecutive passages of pancreatic organoid diameters at day 6 of culture in ECM gel and Matrigel. Mean ± S.D. (n ≈ 55 organoids). Box plots are represented with the central line indicating the median of values, bounds of box indicating first and third quartiles, and whiskers to show minimum and maximum outside the first and third quartiles. d Forming pancreatic ducts per field of view at day 6 of culture in ECM gel and Matrigel. Mean ± S.D. (n ≈ 10 organoid droplets). e Evaluation of the ECM gel angiogenic potential through Chick Chorioallantoic Membrane (CAM) Assay. f Quantification of the number of blood vessels directed towards the gel on the CAM in ECM gel and Matrigel. Mean ± S.D. (n = 5 biological replicates). g ECM gel and Matrigel on the CAM, circled in blue. Scale bar 1 mm. h H&E staining of the CAM in ECM gel and Matrigel. Scale bar 250 µm. i Mouse subcutaneous transplantation of human fetal pancreatic ducts in ECM gels. (Top) Recovery of silicon rings from mouse back with ECM gels (arrow) after 2.5 weeks. Scale bar 5 mm. (Bottom) H&E staining of pancreatic ducts after in vivo transplantation in ECM gel. Scale bar 100 µm. j Immunofluorescence staining of pancreatic organoids in ECM gel after 2.5 weeks in vivo, expression of pancreatic markers mucin-1A, epithelial cadherin, insulin promoter factor 1 and cytokeratin-19. Scale bar 25 µm. k Recovery of silicon rings with pancreatic ducts in Matrigel after 2.5 weeks (left scale bar 5 mm), H&E staining, and immunofluorescence staining (central/right scale bars 100 µm). l Mouse subcutaneous transplantation of murine LGR5-DTR-EGFP SI organoids in ECM gels. (Top) Recovery of silicon rings from mouse back with ECM gels (arrow) after 4 weeks. Scale bar 1 mm. (Bottom) Bright field image of ECM gel with intestinal organoids inside. Scale bar 200 µm. m Immunofluorescence staining of SI organoids in ECM gel after 4 weeks in vivo, showing crypt/stem markers anti-GFP-LGR5, olfactomedin-4 and lysozyme, together with villi/differentiation markers cytokeratin-20, L-type fatty acid binding protein and mucin-2. Scale bars 100 µm.

Similar articles

Cited by

References

    1. Fatehullah A, Tan SH, Barker N. Organoids as an in vitro model of human development and disease. Nat. Cell Biol. 2016;18:246–254. doi: 10.1038/ncb3312. - DOI - PubMed
    1. Barker N, et al. Identification of stem cells in small intestine and colon by marker gene Lgr5. Nature. 2007;449:1003–1007. doi: 10.1038/nature06196. - DOI - PubMed
    1. Barker N, et al. Lgr5+ve stem cells drive self-renewal in the stomach and build long-lived gastric units in vitro. Cell Stem Cell. 2010;6:25–36. doi: 10.1016/j.stem.2009.11.013. - DOI - PubMed
    1. Fukuda M, et al. Small intestinal stem cell identity is maintained with functional Paneth cells in heterotopically grafted epithelium onto the colon. Genes Dev. 2014;28:1752–1757. doi: 10.1101/gad.245233.114. - DOI - PMC - PubMed
    1. Schwank G, et al. Functional repair of CFTR by CRISPR/Cas9 in intestinal stem cell organoids of cystic fibrosis patients. Cell Stem Cell. 2013;13:653–658. doi: 10.1016/j.stem.2013.11.002. - DOI - PubMed

Publication types