. 2019 Dec 10;29(11):3736-3750.e8.
doi: 10.1016/j.celrep.2019.11.042.

Integrated Cross-Species Analysis Identifies a Conserved Transitional Dendritic Cell Population

Affiliations

Integrated Cross-Species Analysis Identifies a Conserved Transitional Dendritic Cell Population

Rebecca Leylek et al. Cell Rep. .

Abstract

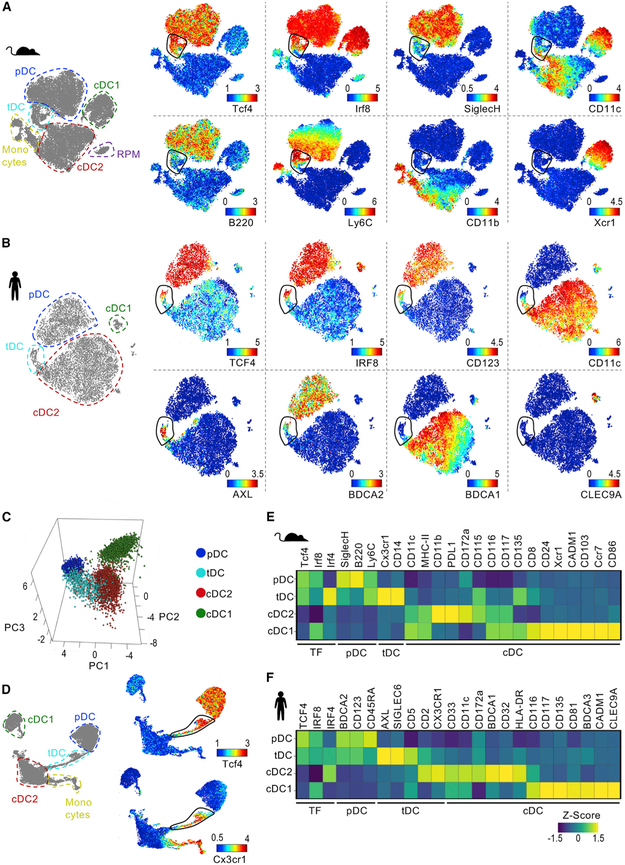
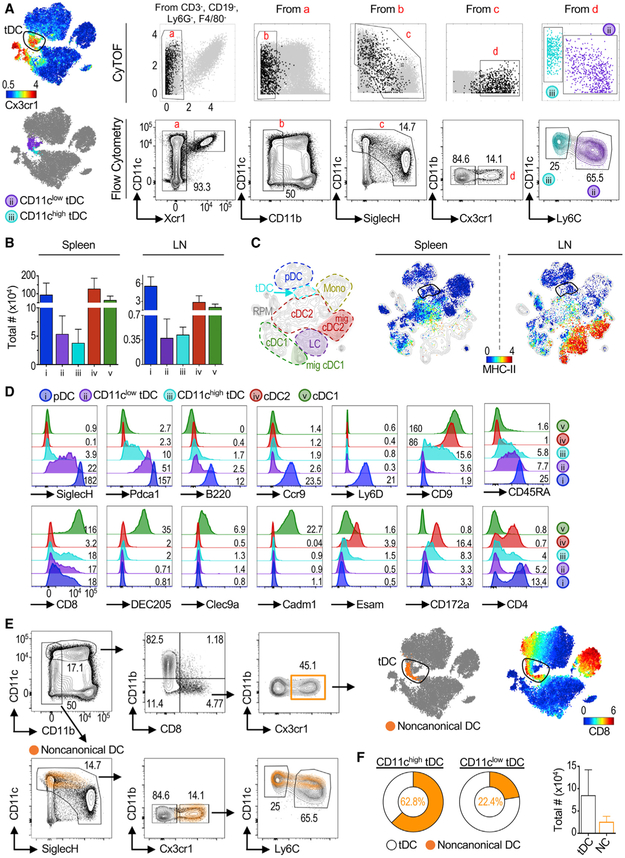
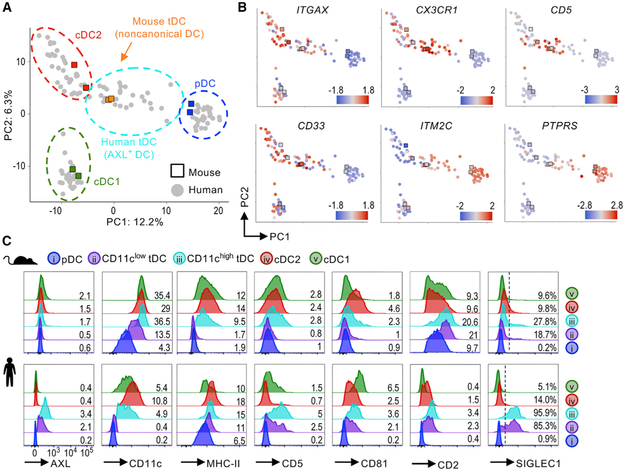
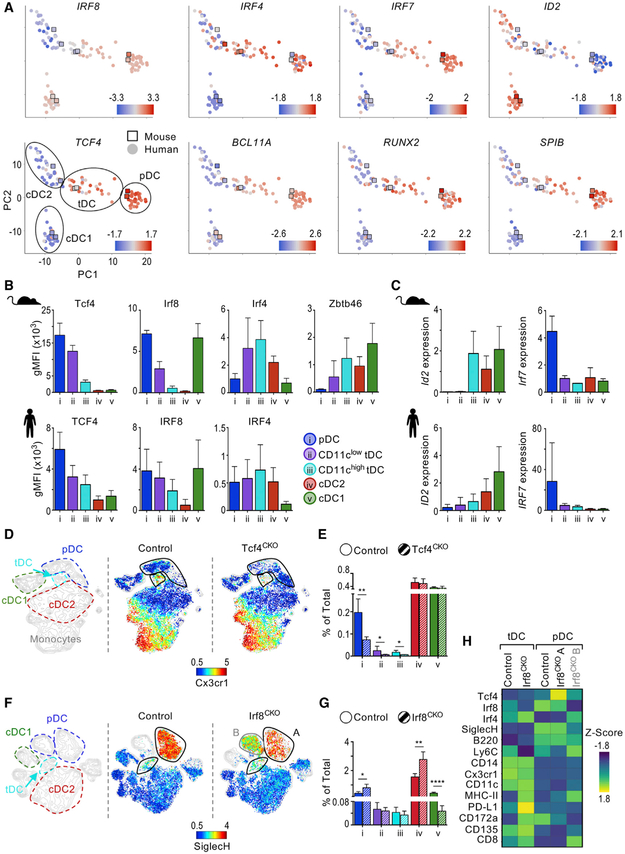
Plasmacytoid dendritic cells (pDCs) are sensor cells with diverse immune functions, from type I interferon (IFN-I) production to antigen presentation, T cell activation, and tolerance. Regulation of these functions remains poorly understood but could be mediated by functionally specialized pDC subpopulations. We address pDC diversity using a high-dimensional single-cell approach: mass cytometry (CyTOF). Our analysis uncovers a murine pDC-like population that specializes in antigen presentation with limited capacity for IFN-I production. Using a multifaceted cross-species comparison, we show that this pDC-like population is the definitive murine equivalent of the recently described human AXL+ DCs, which we unify under the name transitional DCs (tDCs) given their continuum of pDC and cDC2 characteristics. tDCs share developmental traits with pDCs, as well as recruitment dynamics during viral infection. Altogether, we provide a framework for deciphering the function of pDCs and tDCs during diseases, which has the potential to open new avenues for therapeutic design.

Keywords: ASDC; AXL(+) dendritic cells; CyTOF; human; mouse; noncanonical dendritic cells; plasmacytoid dendritic cells; pre-DCs; transitional dendritic cells; viral infection.


Conflict of interest statement

DECLARATION OF INTERESTS

The authors declare no competing interests.

Figures

Figure 1.
Figure 1.. Identification of a Transitional DC Population in Mouse and Human
(A and B) tSNE plots of (A) Lin events from BSA-enriched mouse splenocytes or (B) Lin HLA-DR+ events from human PBMCs. One representative of two samples analyzed by CyTOF is shown. See Figures S1 and S2 for additional protein expression. tSNE with manual annotation (left) and colored by expression of indicated proteins (right). (C) PCA of DC subsets in mouse spleen analyzed by CyTOF as in (A). (D) UMAP of mouse splenocytes analyzed by CyTOF as in (A). UMAP with manual annotation (left) and colored by expression of indicated proteins (right). (E and F) Heatmap of protein expression in mouse (E) and human (F) DC subsets (n = 2 for each species). See also Table S1 for CyTOF panels.
Figure 2.
Figure 2.. Mouse tDC Phenotype Transitions from pDC-like to cDC-like
(A) tSNE plot of CyTOF data as in Figure 1, colored by Cx3cr1 expression (top left). Top row: biaxial plots of CyTOF data. Black dots represent gated Cx3cr1+ Tcf4+ cells. Cells were divided based on the expression of CD11c and Ly6C and mapped to the CyTOF tSNE plot (lower left). Bottom row: flow cytometry gating strategy (see Figure S3A for the full gating strategy). One representative of two independent experiments (exp). (B) Total numbers of DC subsets in mouse spleen (n = 14) and skin-draining lymph nodes (LNs; n = 7). Shown is mean ± SD. (C) tSNE map of spleen and LNs analyzed by CyTOF, with manual annotation (left) and colored by MHC class II expression (right). One representative of two exp. (D) Surface markers analyzed in each DC subset by flow cytometry representative of n ≥ 3. Numbers indicate geometric Mean Fluorescence Intensity (gMFI) × 102. (E) Noncanonical DCs were gated as described (Bar-On et al., 2010) and overlaid in the tSNE plot of mouse spleen CyTOF data (orange dots, upper panel). Noncanonical DCs were also overlaid in our flow cytometry gating strategy described in (A) (bottom panels). (F) Frequency of noncanonical DCs within CD11chigh and CD11clow tDC gates (pie charts) and total number of tDCs and noncanonical DCs in the spleen (n = 14).
Figure 3.
Figure 3.. Mouse and Human tDCs Align Transcriptionally and Phenotypically
(A) RNA-seq of mouse (Lau et al., 2016) and human (Villani et al., 2017) DC subsets analyzed by PCA and shown with manual annotation (see Figure S4A for analysis details). (B) Expression Z-scores of select genes. (C) Protein expression measured by flow cytometry in mouse (top) and human (bottom) DC populations. Histograms represent n ≥ 3. Numbers on histograms indicate gMFI × 102 or frequency (%) of positive cells.
Figure 4.
Figure 4.. TF Profiles Are Shared between Mouse and Human tDCs
(A) PCA denoting expression Z-scores of TFs in mouse and human DC subsets. Manual annotation of PCA is shown in the bottom left panel. (B) gMFI of TF expression measured by flow cytometry in mouse (top, n = 2–3) and human (bottom, n = 4–5). (C) Expression of ID2 and IRF7 in sorted mouse splenic and human blood DC subsets measured by qPCR. Expression represents ΔΔCq relative to the internal control gene RPL13A/Rpl13a and cDC2s (n = 2–4). (D) CyTOF analysis of BSA-enriched splenocytes from CD11cCRE Tcf4fl/fl (Tcf4CKO) and control (Tcf4fl/fl and B6) mice manually annotated (left) and colored by protein expression (right). One representative of two exp. (E) Frequency of DC subsets in spleen of Tcf4CKO and control mice (n = 3 in 2 exp). (F) CyTOF analysis of BSA-enriched splenocytes from CD11cCRE Irf8fl/fl (Irf8CKO) and control (Irf8fl/fl) mice manually annotated (left) and colored by protein expression (right). One representative of two exp. (G) Frequency of DC subsets in spleen of Irf8CKO and control mice (n = 3 in 2 exp). (H) Heatmap of protein expression in pDCs and tDCs from Irf8CKO and control mice (n = 2). pDCs from Irf8CKO were divided in two based on Irf8 expression; i.e., population A is present in control mice, whereas population B is present in Irf8CKO mice. Bar graphs indicate mean ± SD. Statistics determined by t-test. *p < 0.05, **p < 0.01, ****p < 0.0001.
Figure 5.
Figure 5.. tDCs Display Lymphoid Characteristics Associated with pDCs
(A) TF expression in sorted mouse splenic DC subsets measured by qPCR (n = 3 in 3 exp). Expression represents ΔΔCq relative to the internal control gene Rpl13a and cDC2s. (B) Sorted mouse splenic DC subsets analyzed by PCR assay for IgH D-J rearrangement. Actin and IgH germline (GL) are also shown (1 representative of 6 exp). (C) EGFP expression in splenic DC subsets from PTCRA-EGFP mice compared with wild-type (WT) mice. Two mice for each condition shown. Numbers indicate frequency of EGFP+ cells. (D) tSNE map of Lin events from negatively enriched (anti-CD3 and anti-CD19) mouse splenocytes analyzed by CyTOF. Left: manual annotation; right: colored by protein expression. Bottom panels show splenic pre-DCs gated as CD3 CD19 CD335 B220 and CD11c+ MHC class II CD135+ CD172a as described (Liu et al., 2009). Pre-DCs were overlaid in the tSNE map (pink dots). See Figure S5 for a comparison between spleen tDCs and BM pre-DCs. (E) Total numbers of tDCs and pre-DCs (n = 5 in 3 exp). The frequency of pre-DCs that overlap tDCs (white) or other cells (black) is shown. (F) Frequency of tDCs that correspond to pre-DCs (average of n = 5 in 3 exp). (G) Surface marker expression in spleen pre-DCs and tDCs representative of 3 exp. Numbers indicate frequency of positive cells. Bar graphs indicate mean ± SD.
Figure 6.
Figure 6.. Mouse and Human tDCs Display Similar Functional Capabilities
(A) Splenic DCs were analyzed 6 h after intravenous (i.v.) inoculation of CpG-A (filled bars) or PBS control (empty bars). gMFI of activation markers is shown as the mean ± SD (n = 2–4 in 2–4 exp). See Figure S6 for histograms of activation markers. (B) Human DCs were sorted from PBMCs and analyzed at time 0 (empty bars) or after 24 h of culture with 5 μg/mL of CpG-A (filled bars). gMFI of activation markers is shown as the mean ± SD (n = 2–4 in 2–4 exp). (C) IFNα and IL-12p70 measured by ELISA in supernatants from sorted mouse DCs stimulated with CpG-A for 16–18 h (n = 4 in 4 exp). Frequency of IL-12p40-positive cells was measured by intracellular cytokine staining after 4 h of stimulation with CpG-A in the presence of brefeldin A (BFA). (D) IFNα measured by ELISA and IL-12p70 measured by cytometric bead array in the supernatants from sorted human DCs stimulated as in (B) or with an adjuvant cocktail (lipopolysaccharide-poly(I:C)-R848 [LPR]). (E) Frequency of CellTrace violet (CTV)low mouse CD4+ T cells in mixed leukocyte reactions. DCs were sorted from B6 mice and cocultured with CTV-labeled CD4+ T cells from BALB/c mice for 5 days (n = 3 in 3 exp). (F) Frequency of carboxyfluorescein succinimidyl ester (CFSE)low human CD4+ T cells in mixed leukocyte reactions. Human DC populations were sorted and cocultured with allogeneic CFSE-labeled T cells for 5–6 days (n = 3–4 in 3 exp). Bar graphs indicate mean ± SD; nd, not detected. Statistics determined by one-way ANOVA with Tukey’s multiple comparison test. *p < 0.05, **p < 0.01, ***p < 0.001, ****p < 0.0001.
Figure 7.
Figure 7.. tDCs Are Recruited to the Lung during Influenza Infection
(A) Frequency and number of tDCs in spleen (n = 6), lung (n = 6), and skin (n = 3) quantified by flow cytometry and CyTOF. See Figure S7A and S7B for CyTOF of lung and skin. (B) Intranasal influenza (PR8) infection of B6 mice was followed by daily weight loss (n = 6 mice per time point, combined from 3 exp). (C) Composition of the lung DC compartment by subset over time post-infection. Pie charts were drawn from total numbers. See Figure S7C for the lung DC gating strategy. (D) Fold change of each DC subset to day 0 in the lung and mediastinal lymph nodes (LNs). In LNs, migratory cDC subsets (mDC1s and mDC2s) were analyzed. (E) Activation marker expression on lung pDCs and tDCs over time. Fold change of gMFI relative to day 0 is shown. (F) Depletion of pDCs, but not tDCs, after a single dose of diphtheria toxin (DT) in CLEC4CDTR or control B6 mice in the spleen and lung. Statistics determined by t-test. (G) Timeline of influenza infection and DT administration in CLEC4CDTR mice. (H) Weight of DT-inoculated mice was evaluated daily (n = 5–6 mice, combined from 3 exp). (I) Fold change of each DC subset to day 0 in the lung at day 8 post-infection is shown. (J) Lung T cells analyzed at day 8 (n = 5–6 mice, combined from 3 exp). Statistics determined by one-way ANOVA with Tukey’s multiple comparison test. Bar graphs indicate mean ± SD. *p < 0.05, **p < 0.01, ***p < 0.001.

Similar articles

Cited by

References

    1. Alcántara-Hernández M, Leylek R, Wagar LE, Engleman EG, Keler T, Marinkovich MP, Davis MM, Nolan GP, and Idoyaga J (2017). High-Dimensional Phenotypic Mapping of Human Dendritic Cells Reveals Interindividual Variation and Tissue Specialization. Immunity 47, 1037–1050.e6. - PMC - PubMed
    1. Alculumbre SG, Saint-André V, Di Domizio J, Vargas P, Sirven P, Bost P, Maurin M, Maiuri P, Wery M, Roman MS, et al. (2018). Diversification of human plasmacytoid predendritic cells in response to a single stimulus. Nat. Immunol 19, 63–75. - PubMed
    1. Alculumbre S, Raieli S, Hoffmann C, Chelbi R, Danlos F-X, and Soumelis V (2019). Plasmacytoid pre-dendritic cells (pDC): from molecular pathways to function and disease association. Semin. Cell Dev. Biol 86, 24–35. - PubMed
    1. Amir AD, Davis KL, Tadmor MD, Simonds EF, Levine JH, Bendall SC, Shenfeld DK, Krishnaswamy S, Nolan GP, and Pe’er D (2013). viSNE enables visualization of high dimensional single-cell data and reveals phenotypic heterogeneity of leukemia. Nat. Biotechnol 31, 545–552. - PMC - PubMed
    1. Asselin-Paturel C, Boonstra A, Dalod M, Durand I, Yessaad N, Dezutter-Dambuyant C, Vicari A, O’Garra A, Biron C, Brière F, and Trinchieri G (2001). Mouse type I IFN-producing cells are immature APCs with plasmacytoid morphology. Nat. Immunol 2, 1144–1150. - PubMed

Publication types

MeSH terms

Substances