. 2019 Dec 6;10(1):5576.
doi: 10.1038/s41467-019-13314-y.

CSB promoter downregulation via histone H3 hypoacetylation is an early determinant of replicative senescence

Affiliations

CSB promoter downregulation via histone H3 hypoacetylation is an early determinant of replicative senescence

Clément Crochemore et al. Nat Commun. .

Abstract

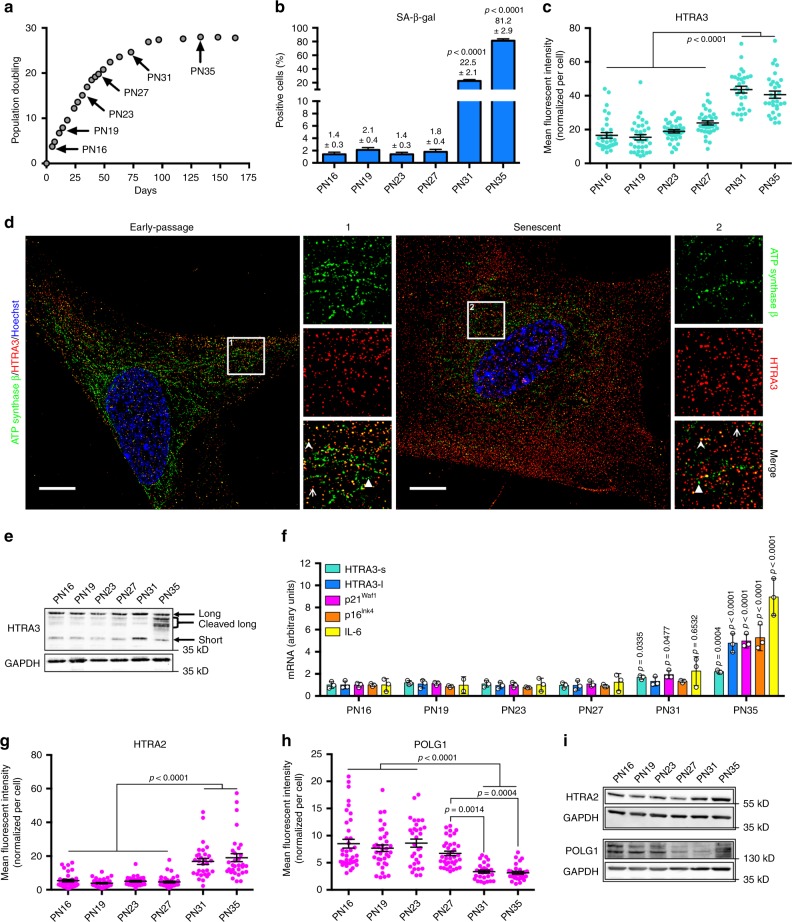
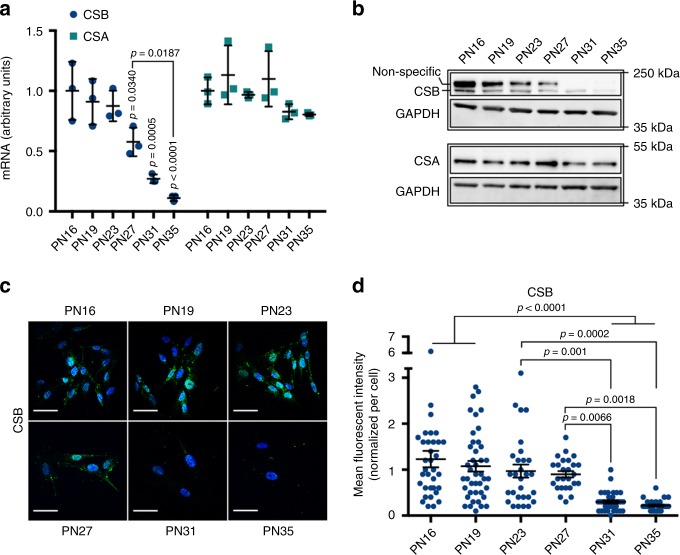
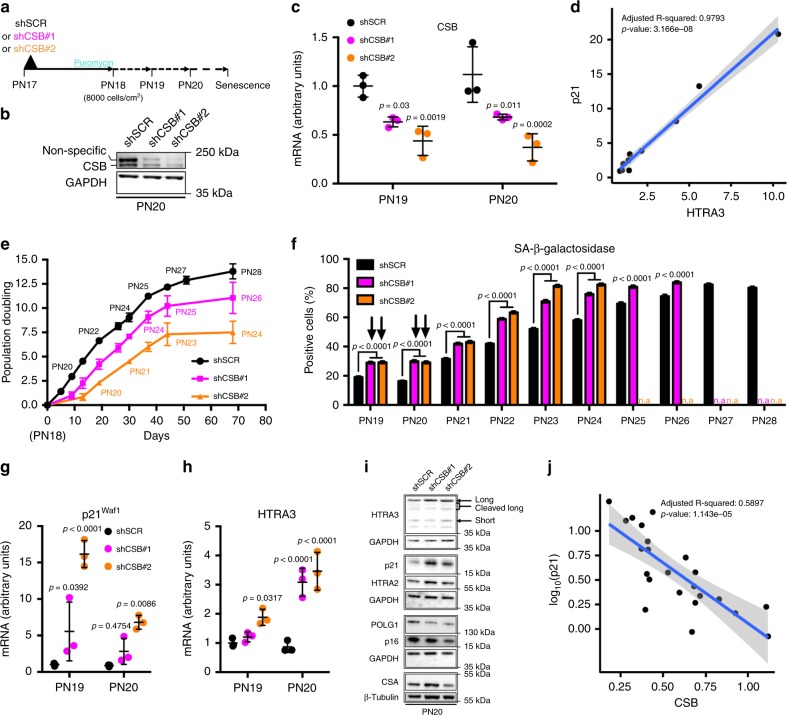
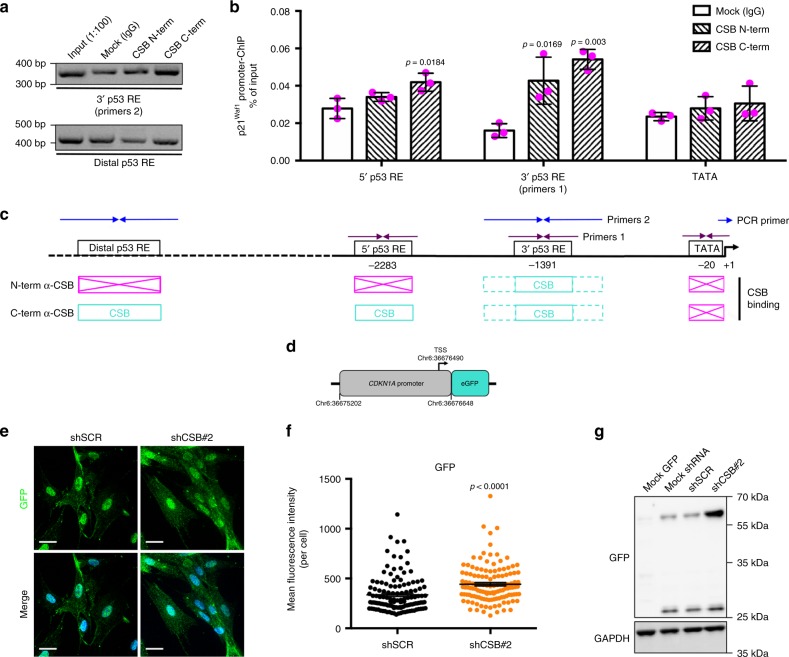
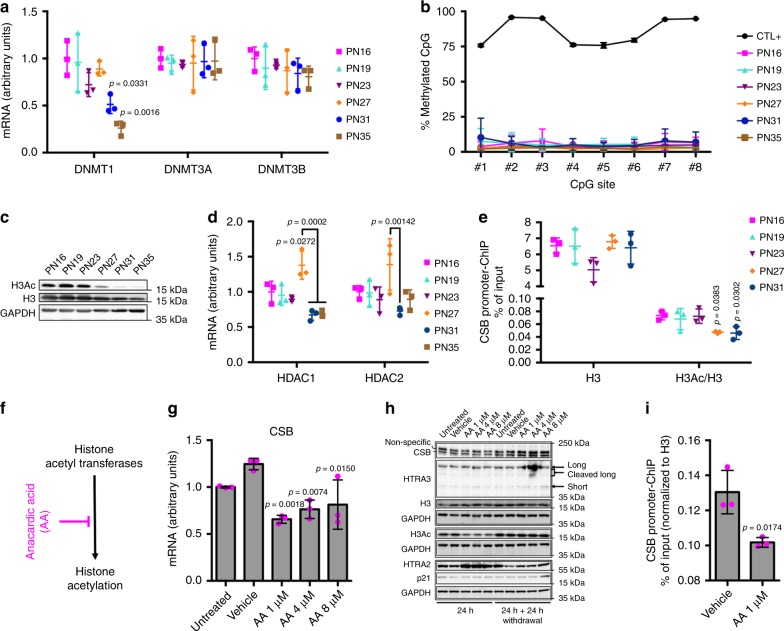
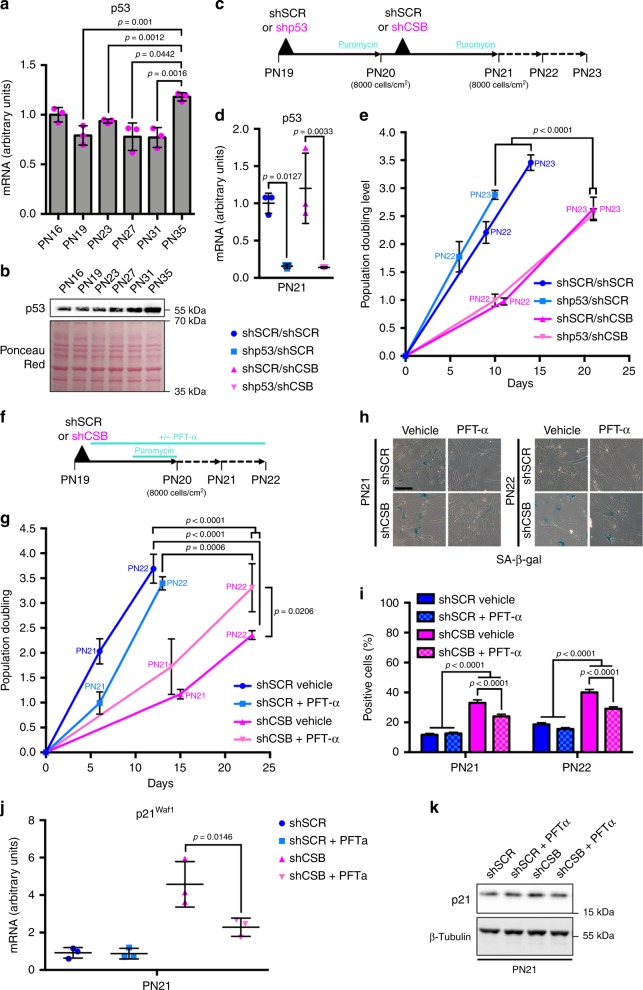
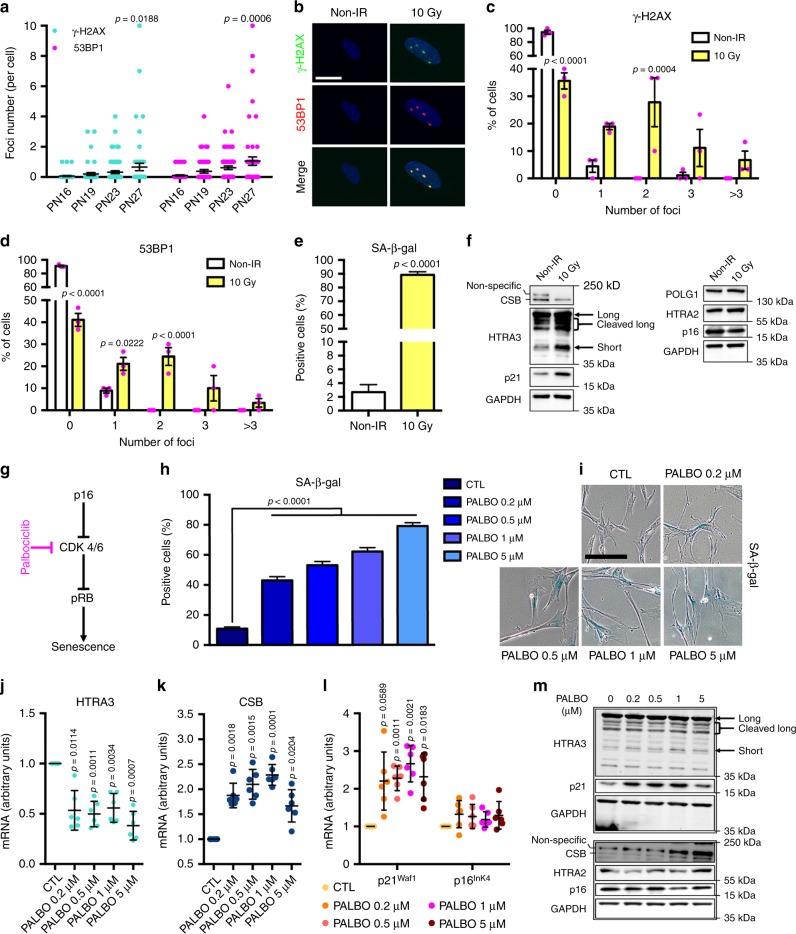
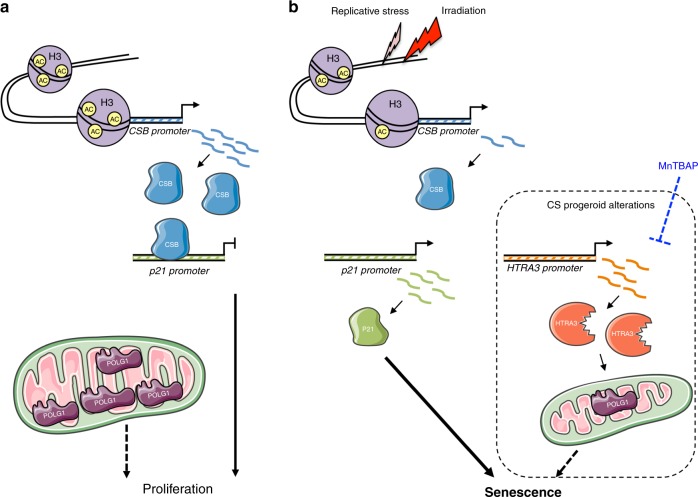
Cellular senescence has causative links with ageing and age-related diseases, however, it remains unclear if progeroid factors cause senescence in normal cells. Here, we show that depletion of CSB, a protein mutated in progeroid Cockayne syndrome (CS), is the earliest known trigger of p21-dependent replicative senescence. CSB depletion promotes overexpression of the HTRA3 protease resulting in mitochondrial impairments, which are causally linked to CS pathological phenotypes. The CSB promoter is downregulated by histone H3 hypoacetylation during DNA damage-response. Mechanistically, CSB binds to the p21 promoter thereby downregulating its transcription and blocking replicative senescence in a p53-independent manner. This activity of CSB is independent of its role in the repair of UV-induced DNA damage. HTRA3 accumulation and senescence are partially rescued upon reduction of oxidative/nitrosative stress. These findings establish a CSB/p21 axis that acts as a barrier to replicative senescence, and link a progeroid factor with the process of regular ageing in human.


Conflict of interest statement

The authors declare no competing interests.

Figures

Fig. 1
Fig. 1
Overexpression of HTRA3 and mitochondrial impairment in replicative senescence. a Cumulative population doubling of IMR-90 fibroblasts (starting from PN15). Senescence corresponds to plateau (proliferative arrest). Cells analyzed at PNs identified with black arrows; n = 3 independent cultures; mean ± SD, values are reported in the Source Data file. b Percent of SA-β-gal+ cells; n = 1100–1340 cells (PN16-PN27) and n = 180–410 cells (PN31-PN35) from three independent experiments, mean ± SEM (values indicated on the top of columns); one-way ANOVA (F = 768.9, DFn = 5, DFd = 5551, p < 0.0001) with post-hoc Tukey’s test vs. PN16. c Quantification of mean HTRA3 fluorescence intensity per cell at indicated PN (representative images in Supplementary Fig. 1d). d Sublocalisation of HTRA3 and mitochondria in early-passage (PN16) and senescent (PN35) IMR-90 fibroblasts with SIM (one plan of a z-stack acquisition for each cell). Cells immunolabelled for ATP synthase β (green) to reveal mitochondria, and HTRA3 (red); nuclei counterstained with Hoechst (blue). Scale bars = 10 µm. For each cell, a x2.5 magnification of a region (1 or 2) is shown on the right with immunostaining for ATP synthase β, HTRA3, and merge (representative arrowhead for HTRA3/ATP synthase β colocalization, arrow for extra-mitochondrial HTRA3, and triangle for mitochondria with no HTRA3 signal detection). e Immunoblot of HTRA3, and GAPDH (loading control, reprobing after stripping). α-HTRA3 antibody recognizes long and short isoforms (Supplementary Fig 1e). f Quantitative RT-qPCR of HTRA3 (short and long form), p21Waf1, p16Ink4, and IL-6 transcripts. n = 3 independent experiments; mean ± SD; one-way ANOVA (HTRA3s: F = 13.12, DFn = 5, DFd = 12, p = 0.0002; HTRA3l: F = 29.12, DFn = 5, DFd = 12, p < 0.0001; p21Waf1: F = 63.24, DFn = 5, DFd = 12, p < 0.0001; p16Ink4: F = 38.71, DFn = 5, DFd = 12, p < 0.0001; IL-6: F = 29.75, DFn = 5, DFd = 12, p < 0.0001) with post-hoc Tukey’s test vs. PN16 (p-values on the top of scatter plots/columns). Quantification of mean fluorescence intensity (mFI) of g HTRA2 and h POLG1 immunolabeling per cell (representative images in Supplementary Fig. 3c, d). i WB of POLG1, HTRA2, each with the loading control GAPDH. IFs: n = 30–50 cells from three independent experiments; mean ± SEM; one-way ANOVA (c F = 58.32, DFn = 5, DFd = 194, p < 0.0001; g F = 30.75, DFn = 5, DFd = 194, p < 0.0001; h F = 16,67, DFn = 5, DFd = 193, p < 0.0001) with post-hoc Tuckey's test. IF measurements include normalization to cell size. Source data are provided as Source Data files.
Fig. 2
Fig. 2
CSB depletion is an early event in replicative senescence. a RT-qPCR of CSB and CSA. n = 3 independent experiments; mean ± SD; one-way ANOVA (CSB: F = 19.40, DFn = 5, DFd = 12, p < 0.0001; CSA: F = 2.55, DFn = 5, DFd = 12, p = 0.855) with post-hoc Tukey’s test vs. PN16 (p-values on the top of scatter plots/columns) when not specifically indicated. b WB of CSB and CSA, each with the loading control GAPDH (lower blot, GAPDH F-c staining). Upper band in CSB blot is non-specific. c Representative confocal acquisitions of cells immunostained for CSB (green) and counterstained with Hoechst (blue) after maximum intensity projection with Imaris, scale bar = 50 µM, and d quantification of the CSB mFI/cell. n = 30–50 cells from three independent experiments; mean ± SEM; one-way ANOVA (F = 13.76, DFn = 5, DFd = 189, p < 0.0001) with post-hoc Tukey’s test vs. PN16 when not specifically indicated. IF measurements include normalization to cell size. Source data are provided as Source Data files.
Fig. 3
Fig. 3
CSB knockdown induces premature p21-dependent senescence. a Scheme of the experiment. b Immunoblot of CSB at PN20. GAPDH was used as a loading control. c Quantitative RT-qPCR of CSB at PN19 and PN20 in IMR-90 fibroblasts knocked down for CSB (shCSB#1 and shCSB#2) and scramble control (shSCR). n = 3 independent experiments, mean ± SD, values are reported in the Source Data files; two-way ANOVA (F = 28.24, DFn = 2, DFd = 12, p < 0.0001) with post-hoc Tukey’s test vs. shSCR. d Direct correlation between p21Waf1 and HTRA3 transcript in control shSCR (from data in Supplementary Fig. 5b, c). e Cumulative population doubling of serially passaged IMR-90 (starting at PN18, n = 3 independent cultures). f Quantification of SA-β-gal+ cells from PN19 to PN28 (cultures stopped growing at PN26 with shCSB#1 and at PN24 with shCSB#2); n = 1160-4480 cells/condition from three independent experiments, mean ± SEM; two-way ANOVA (PN19-24: F = 542.3, DFn = 2, DFd = 40677, p < 0.0001. PN25-26: F = 78.71, DFn = 1, DFd = 5114, p < 0.0001) with post-hoc Tukey’s (PN19-24) or Sidak’s (PN25-26) tests vs. the respective shSCR; n.a = not applicable. Arrows indicate the initial burst of SA-β-gal+ staining upon CSB silencing. SA-β-gal+ cells in shSCR at PN19-PN20 probably result from response to lentiviral infection. RT-qPCR of g p21Waf1 and h HTRA3 at PN19 and PN20. n = 3 independent experiments, mean ± SD; two-way ANOVA (p21Waf1: F = 44.26, DFn = 2, DFd = 12, p < 0.0001. HTRA3: F = 35.04, DFn = 2, DFd = 12, p < 0.0001) with post-hoc Tukey’s test vs. shSCR. Data in panels c, g, h (which are limited to PN19 and PN20) are extracted from panels in Supplementary Fig. 5a–c. i WB of HTRA3, p21, HTRA2, POLG1, p16, and CSA at PN20. Samples on the same blot are framed; each frame displays the respective GAPDH or β-tubulin used as a loading control (middle blot, GAPDH F-C staining). High levels of p16 in shSCR are compatible with lentiviral infection. j Linear regression of each individual value in Supplementary Fig. 5a (CSB, x-axis) vs. log10-transformed values in Supplementary Fig. 5b (p21Waf1, y-axis). Source data are provided as Source Data files.
Fig. 4
Fig. 4
CSB binds to the p21Waf1 promoter. a PCR (agarose gel) and b quantitative PCR (histogram) analyses of several DNA fragments in the p21Waf1 promoter from ChIP assays with either N-term α-CSB [Bethyl] or C-term α-CSB [Abcam] antibodies. c Scheme not at scale of primer positions on the p21Waf1 promoter and summary of positive amplifications in turquoise (boxes in magenta indicate no amplification). n = 3 independent experiments; one-way ANOVA (5’p53RE: F = 7.698, DFn = 2, DFd = 6, p = 0.0220. 3’p53RE: F = 17.11, DFn = 2, DFd = 6, p = 0.0033; TATA: F = 0.8699, DFn = 2, DFd = 6, p = 0.4659) with post-hoc Tukey’s test for each tested regions vs. Mock. d Scheme of the CDKN1A (p21waf1) promoter-eGFP reporter plasmid. e Representative confocal acquisitions of cells stably expressing the CDKN1A (p21waf1) promoter-eGFP reporter upon shCSB#2 silencing or control shSCR, immunostained for GFP (green) to increase the signal of endogenous GFP, and counterstained with Hoechst (blue) after maximum intensity projection with Imaris; scale bar = 50 µM, and f quantification of the GFP mFI/cell; n = 127 cells/condition from three independent experiments, mean ± SEM; unpaired t-test (two-tailed) (t = 4.555, DF = 253), p-value vs. shSCR. g WB of GFP and GAPDH (loading control) in cells not expressing (Mock GFP) or stably expressing (Mock shRNA) the CDKN1A (p21waf1) promoter-eGFP reporter, not silenced (shSCR) or silenced for CSB (shCSB#2). Cells that express GFP display a band at 27 kDa, and also an upper band at around 60 kDa, in particular upon CSB silencing, corresponding to dimers observed in other conditions. Source data are provided as Source Data files.
Fig. 5
Fig. 5
CSB depletion by histone H3 hypoacetylation of its promoter. a Quantitative RT-qPCR of DNMT3A, DNMT3B, and DNMT1. b DNA methylation (percent) of eight individual CpG sites in the CSB promoter at the indicated PN (positive control [CTL + ], a universal methylated (human) DNA standard). n = 3 independent experiments, mean ± SD; two-way ANOVA (F = 2.983, DFn = 5, DFd = 96, p = 0.0151) with post-hoc Tukey’s test. c Immunoblots of H3 acetylated (H3Ac) and total histone H3 (reprobed after H3Ac stripping) at the indicated PN, with GAPDH as a loading control. d Quantitative RT-qPCR of HDAC1 and HDAC2. e Quantitative PCR of DNA in a ChIP assay with either α-H3 acetylated or total α-H3 (material not available at PN35). Primers detect the occupancy of H3Ac/H3 at a specific region of the CSB promoter. Results are expressed as the percentage of input DNA normalized to H3 occupancy. f Scheme indicating the anacardic acid (AA) target. g Quantitative RT-qPCR of CSB upon treatment with increasing concentrations of AA or DMSO (Vehicle) for 24 h, and in untreated control (Untreated). h Immunoblot of H3 acetylated, total H3 histone, CSB, HTRA3, HTRA2, and p21 from whole-cell extracts with increasing concentrations of AA or DMSO (Vehicle) for 24 h, and 24 h after AA withdrawal and in the corresponding controls (Untreated). Samples on the same blot are framed; each frame displays the respective GAPDH used as a loading control (GAPDH (F-C staining in the middle blot)). Quantitative PCRs: n = 3 independent experiments; mean ± SD; one-way ANOVA (a DNMT1: F = 9.129, DFn = 5, DFd = 12, p = 0.0009; DNMT3A: F = 0.05094, Dfn = 5, DFd = 12, p = 0.9980; DNMT3B: F = 0.5325, DFn = 5, DFd = 12, p = 0.7481; d HDAC1: F = 12.93, DFn = 5, DFd = 12, p = 0.0002; HDAC2: F = 3.826, DFn = 5, DFd = 12, p = 0.0264; e H3: F = 2.298, DFn = 4, DFd = 10, p = 0.1304; H3Ac/H3: F = 5.064, DFn = 4, DFd = 10, p = 0.0171; g F = 9.516, DFn = 4, DFd = 10, p = 0.0019) with post-hoc Tukey’s test vs. PN16 (or Vehicle, g) when not specifically indicated. i Quantitative PCR analysis of a DNA fragment in the CSB promoter from ChIP assay with α-H3 acetylated in the presence and in the absence of AA treatment; n = 3 independent experiments, mean ± SD; unpaired Student’s t-test (two-tailed) (t = 3.908, DF = 4) vs. Vehicle. Source data are provided as Source Data files.
Fig. 6
Fig. 6
CSB-induced senescence is independent of p53. a RT-qPCR and b WB (Ponceau Red staining as a loading control) of p53 in IMR-90. c Experimental set-up of the two-step transduction of IMR-90, indicating also cell density at seeding. d RT-qPCR of p53 after silencing (PN21). RT-qPCRs: n = 3 independent experiments, mean ± SD; one-way ANOVA (a F = 10.38, Dfn = 5, DFd = 12, p = 0.0005; d F = 15.37, DFn = 3, DFd = 8, p = 0.0011) with post-hoc Tukey’s test. e Population doubling after two passages in culture; n = 3 independent experiments, mean ± SD; GraphPad Prism two-by-two comparison of slope after linear regression (shSCR/shSCR vs. shp53/shSCR: F = 8.87048, DFn = 1, Dfd = 14, p = 0.1; shSCR/shCSB vs. shp53/shCSB: F = 0.103672, Dfn = 1, DFd = 14, p = 0.7522; shSCR/shSCR vs. shSCR/shCSB: F = 80.735, DFn = 1, Dfd = 14, p < 0.0001; shSCR/shSCR vs. shp53/shCSB: F = 186,816, Dfn = 1, DFd = 14, p < 0.0001; shp53/shSCR vs. shSCR/shCSB: F = 79.2891, DFn = 1, Dfd = 14, p < 0.0001; shp53/shSCR vs. shp53/shCSB: F = 163.975, DFn = 1, DFd = 14, p < 0.0001). f Experimental set-up and g population doubling of IMR-90 transduced with either a non-targeted (shSCR) or a CSB-targeted (shCSB) shRNA and grown in presence ( PFT-α) or absence (Vehicle) of the p53 inhibitor pifithrin-α (10 µM). n = 3 independent experiments, mean ± SD; GraphPad Prism two-by-two comparison of slope after linear regression (shSCR Vehicle vs. shSCR + PFT-α: F = 2.72661, DFn = 1, DFd = 14, p = 0.1209; shCSB Vehicle vs. shCSB + PFT-α: F = 6.67947, DFn = 1, DFd = 14, p = 0.0216; shSCR Vehicle vs. shCSB Vehicle: F = 157.235, DFn = 1, DFd = 14, p < 0.0001; shSCR Vehicle vs. shCSB + PFT-α: F = 40.3927, DFn = 1, DFd = 14, p < 0.0001; shSCR + PFT-α vs. shCSB Vehicle: F = 67.2499, DFn = 1, DFd = 14, p < 0.0001; shSCR + PFT-α vs. shCSB + PFT-α: F = 19.5273, DFn = 1, DFd = 14, p = 0.0006). h Representative images and i quantification of SA-β-gal+ cells at PN21 and PN22. n = 840–1560 cells/condition from three independent experiments, mean ± SEM; for each PN one-way ANOVA (PN21: F = 63.99; DFn = 3, DFd = 4580, p < 0.0001; PN22: F = 64.65, DFn = 3, DFd = 4372, p < 0.0001) with post-hoc Tukey’s test. j RT-qPCR of p21Waf1; n = 3 independent experiments, mean ± SD; one-way ANOVA (F = 19.29, DFn = 3, DFd = 8, p = 0.0005) with post-hoc Tukey’s test. k WB of p21; β-tubulin was used as loading control. Source data are provided as Source Data files.
Fig. 7
Fig. 7
CSB-dependent senescence is specific to the DDR/p21 pathway. a Enumeration of endogenous γ−H2AX and 53BP1 foci/cell at PNs preceding or during CSB depletion. n = 50–70 cells from three independent experiments; mean ± SEM; one-way ANOVA (γ−H2AX: F = 3.209, DFn = 3, DFd = 220, p = 0.0239; 53BP1: F = 5.603, DFn = 3, DFd = 220, p = 0.001) with post-hoc Tukey’s test vs. the respective PN16. b Representative confocal acquisitions of irradiated (10 Gy) and non-irradiated (non-IR) IMR-90 immunostained for γ−H2AX (green) and 53BP1 (red), counterstained with Hoechst (blue, nuclei), after maximum intensity projection with the Imaris software; scale bar = 20 µM. Percentage of cells with 0, 1, 2, 3, or >3 (c) γ−H2AX or d 53BP1 foci per nucleus. n = 90 cells from three independent experiments. Mean ± SEM; two-way ANOVA (γ−H2AX: F = 35.77, DFn = 4, DFd = 20, p < 0.001; 53BP1: F = 57.63, DFn = 4, DFd = 20, p < 0.0001) with post-hoc Sidak’s test vs. the respective non-IR. e Quantification of SA-β-gal+ cells of irradiated and non-IR IMR-90 at PN17. n = 180–220 cells/condition from three independent experiments, mean ± SEM; unpaired Student’s t-test (two-tailed) (t = 36.28, DF = 408), p-value vs. non-IR (f) Immunoblots of CSB, HTRA3, p21, and POLG1, HTRA2, p16 (GAPDH F-C staining, loading control, under each blot) in irradiated and non-IR fibroblasts. g Scheme indicating the palbociclib target in the p16 pathway to senescence. h Quantification and i representative images of SA-β-gal+ staining of palbociclib-treated and untreated IMR-90 cells, scale bar = 200 µM. Early-passage fibroblasts (PN20) in normal medium (CTL) or in the presence of 0.2, 0.5, 1, or 5 μM palbociclib for 7 days followed by 1 day of drug withdrawal; n = 800 cells (CTL) and n = 320–380 cells (palbociclib-treated samples) from three independent experiments, mean ± SEM; one-way ANOVA (F = 195.1, DFn = 4, DFd = 2236, p < 0.0001) with post-hoc Tukey’s test. RT-qPCR of j HTRA3, k CSB, and l p21Waf1 and p16Ink4. n = 3 independent experiments, mean ± SD; RM one-way ANOVA (HTRA3: F = 53.07, DF = 4, p < 0.0001; CSB: F = 29.47, DF = 4, p < 0.0001; p21Waf1: F = 13.36, DF = 4, p = 0.0015; p16Ink4: F = 1.587, DF = 4, p = 0.2531) with post-hoc Tukey’s test vs. CTL. m WB of HTRA3, HTRA2, p21, p16, and CSB. Samples on the same blot are framed; each frame displays the respective GAPDH (F-C staining) used as a loading control. Source data are provided as Source Data files.
Fig. 8
Fig. 8
Scheme: role of CSB depletion in replicative senescence. Illustration of epigenetic regulation of CSB expression and its effect on downstream targets (a) regular CSB expression (b) low CSB levels leading to replicative senescence. Novel senescence effectors that are shared with the Cockayne syndrome paradigm (a disease due to CSB impairment in its most severe form) are shown in a framed area. Transcripts are indicated with a wavy line, active promoter with an arrow; Ac, acetyl group.

Similar articles

Cited by

References

    1. McHugh D, Gil J. Senescence and aging: Causes, consequences, and therapeutic avenues. J. Cell Biol. 2018;217:65–77. doi: 10.1083/jcb.201708092. - DOI - PMC - PubMed
    1. Burd CE, et al. Monitoring tumorigenesis and senescence in vivo with a p16(INK4a)-luciferase model. Cell. 2013;152:340–351. doi: 10.1016/j.cell.2012.12.010. - DOI - PMC - PubMed
    1. Campisi J. Aging, cellular senescence, and cancer. Annu. Rev. Physiol. 2013;75:685–705. doi: 10.1146/annurev-physiol-030212-183653. - DOI - PMC - PubMed
    1. Le Roux I, Konge J, Le Cam L, Flamant P, Tajbakhsh S. Numb is required to prevent p53-dependent senescence following skeletal muscle injury. Nat. Commun. 2015;6:8528. doi: 10.1038/ncomms9528. - DOI - PMC - PubMed
    1. Munoz-Espin D, et al. Programmed cell senescence during mammalian embryonic development. Cell. 2013;155:1104–1118. doi: 10.1016/j.cell.2013.10.019. - DOI - PubMed

Publication types

MeSH terms