The type-reproduction number of sexually transmitted infections through heterosexual and vertical transmission
- PMID: 31758036
- PMCID: PMC6874657
- DOI: 10.1038/s41598-019-53841-8
The type-reproduction number of sexually transmitted infections through heterosexual and vertical transmission
Abstract
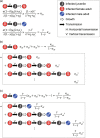
Multiple sexually transmitted infections (STIs) have threatened human health for centuries. Most STIs spread not only through sexual (horizontal) transmission but also through mother-to-child (vertical) transmission. In a previous work (Ito et al. 2019), we studied a simple model including heterosexual and mother-to-child transmission and proposed a formulation of the basic reproduction number over generations. In the present study, we improved the model to take into account some factors neglected in the previous work: adult mortality from infection, infant mortality caused by mother-to-child transmission, infertility or stillbirth caused by infection, and recovery with treatment. We showed that the addition of these factors has no essential effect on the theoretical formulation. To study the characteristics of the epidemic threshold, we derived analytical formulas for three type-reproduction numbers for adult men, adult women and juveniles. Our result indicates that if an efficient vaccine exists for a prevalent STI, vaccination of females is more effective for containment of the STI than vaccination of males, because the type-reproduction number for adult men is larger than that for adult women when they are larger than one.
Conflict of interest statement
The authors declare no competing interests.
Figures


Similar articles
-
Temporal Trends in Population Level Impacts of Risk Factors for Sexually Transmitted Infections Among Men Who Have Sex with Men, Heterosexual Men, and Women: Disparities by Sexual Identity (1998-2013).Arch Sex Behav. 2018 Oct;47(7):1909-1922. doi: 10.1007/s10508-017-1107-1. Epub 2017 Dec 21. Arch Sex Behav. 2018. PMID: 29270705
-
Sexual relationships, risk behaviour, and condom use in the spread of sexually transmitted infections to heterosexual men.Genitourin Med. 1997 Oct;73(5):368-72. doi: 10.1136/sti.73.5.368. Genitourin Med. 1997. PMID: 9534746 Free PMC article.
-
Sexual Quality of Life and Association With HIV and Sexually Transmitted Infections Among a Cohort of Heterosexual Couples in Kenya.J Sex Med. 2018 Oct;15(10):1446-1455. doi: 10.1016/j.jsxm.2018.08.007. Epub 2018 Sep 12. J Sex Med. 2018. PMID: 30219666 Free PMC article.
-
Factors influencing STI transmission in middle-aged heterosexual individuals.Br J Nurs. 2016 Jun 23;25(12):676-80. doi: 10.12968/bjon.2016.25.12.676. Br J Nurs. 2016. PMID: 27345071 Review.
-
[Vertical trasmission of human immunodeficiency virus (HIV) and other sexually transmitted infections (STI)].Minerva Ginecol. 2001 Jun;53(3):177-92. Minerva Ginecol. 2001. PMID: 11395690 Review. Italian.
Cited by
-
Evaluating the global, regional, and national impact of syphilis: results from the global burden of disease study 2019.Sci Rep. 2023 Jul 14;13(1):11386. doi: 10.1038/s41598-023-38294-4. Sci Rep. 2023. PMID: 37452074 Free PMC article.
-
Serious role of non-quarantined COVID-19 patients for random walk simulations.Sci Rep. 2022 Jan 14;12(1):738. doi: 10.1038/s41598-021-04629-2. Sci Rep. 2022. PMID: 35031645 Free PMC article.
-
Global Emergence and Dissemination of Neisseria gonorrhoeae ST-9363 Isolates with Reduced Susceptibility to Azithromycin.Genome Biol Evol. 2022 Jan 4;14(1):evab287. doi: 10.1093/gbe/evab287. Genome Biol Evol. 2022. PMID: 34962987 Free PMC article.
-
The effect of men who have sex with men (MSM) on the spread of sexually transmitted infections.Theor Biol Med Model. 2021 Oct 11;18(1):18. doi: 10.1186/s12976-021-00148-9. Theor Biol Med Model. 2021. PMID: 34635123 Free PMC article.
References
-
- Oriel, J. D. The Scars of Venus: A History of Venereology (Springer-Verlag, 1994).
-
- Waugh, M. History of sexually transmitted infections. In Sexually Transmitted Infections and Sexually Transmitted Diseases (eds Gross, G. & Tyring, S. K.) 3–11 (Springer-Verlag, 2011).
-
- Gewirtzman, A., Bobrick, L., Conner, K. & Tyring, S. K. Epidemiology of sexually transmitted infections. In Sexually Transmitted Infections and Sexually Transmitted Diseases (eds Gross, G. & Tyring, S. K.) 13–34 (Springer-Verlag, 2011).
-
- World Health Organization. Global Strategy for the Prevention and Control of Sexually Transmitted Infections, 2006–2015: Breaking the Chain of Transmission (WHO Press, 2007).
Publication types
MeSH terms
LinkOut - more resources
Full Text Sources
Medical

