. 2019 Oct 25;11(11):1654.
doi: 10.3390/cancers11111654.

Synergism Through WEE1 and CHK1 Inhibition in Acute Lymphoblastic Leukemia

Affiliations

Synergism Through WEE1 and CHK1 Inhibition in Acute Lymphoblastic Leukemia

Andrea Ghelli Luserna Di Rorà et al. Cancers (Basel). .

Abstract

Introduction: Screening for synthetic lethality markers has demonstrated that the inhibition of the cell cycle checkpoint kinases WEE1 together with CHK1 drastically affects stability of the cell cycle and induces cell death in rapidly proliferating cells. Exploiting this finding for a possible therapeutic approach has showed efficacy in various solid and hematologic tumors, though not specifically tested in acute lymphoblastic leukemia.

Methods: The efficacy of the combination between WEE1 and CHK1 inhibitors in B and T cell precursor acute lymphoblastic leukemia (B/T-ALL) was evaluated in vitro and ex vivo studies. The efficacy of the therapeutic strategy was tested in terms of cytotoxicity, induction of apoptosis, and changes in cell cycle profile and protein expression using B/T-ALL cell lines. In addition, the efficacy of the drug combination was studied in primary B-ALL blasts using clonogenic assays.

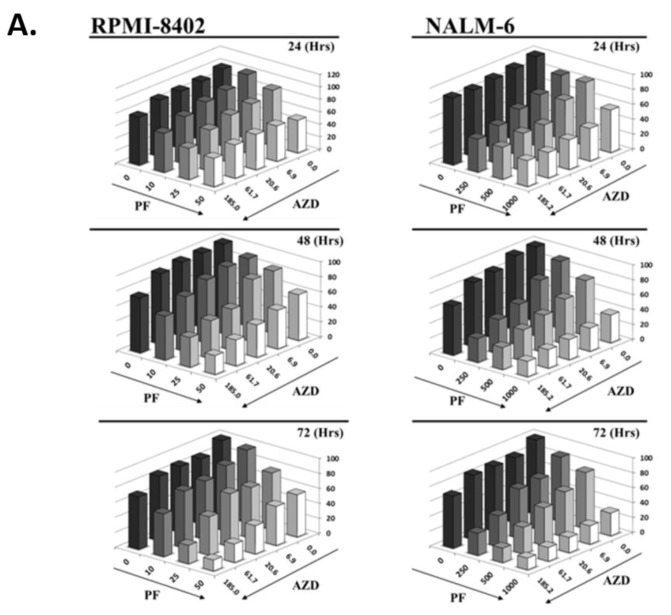
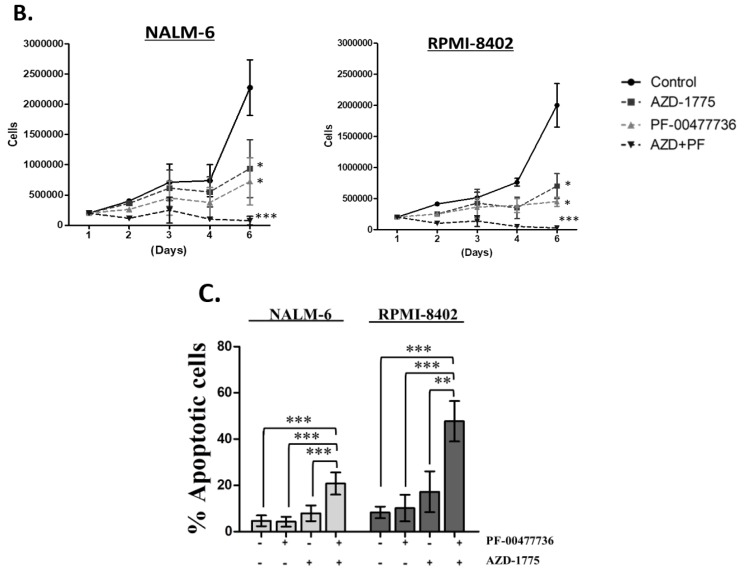
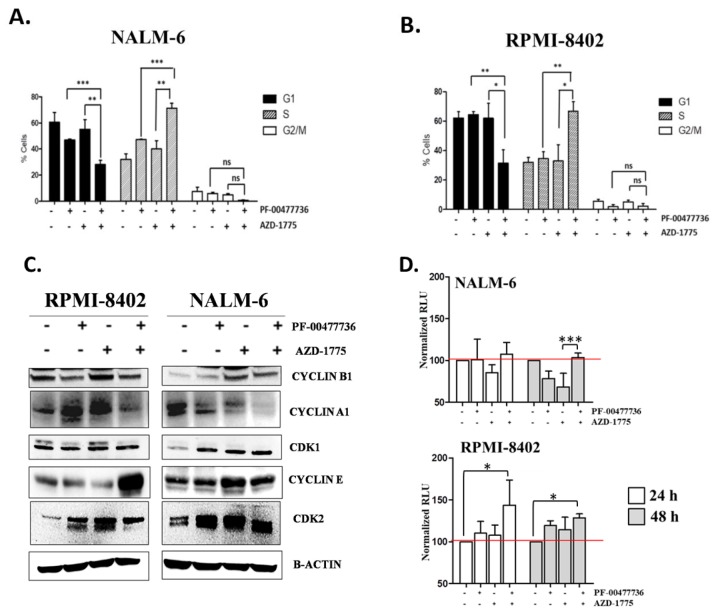
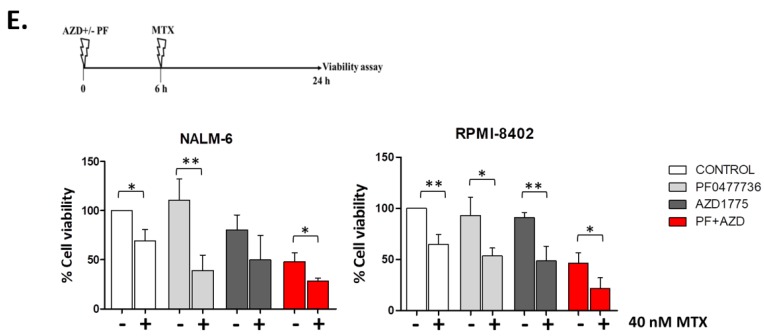
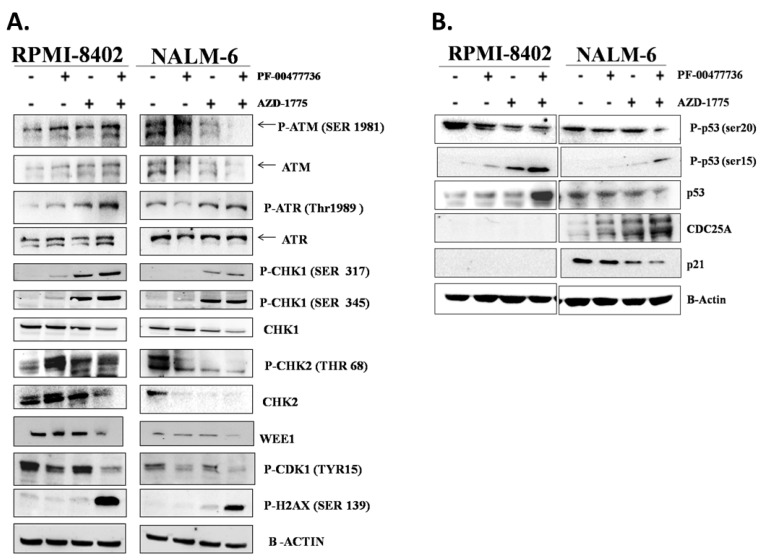
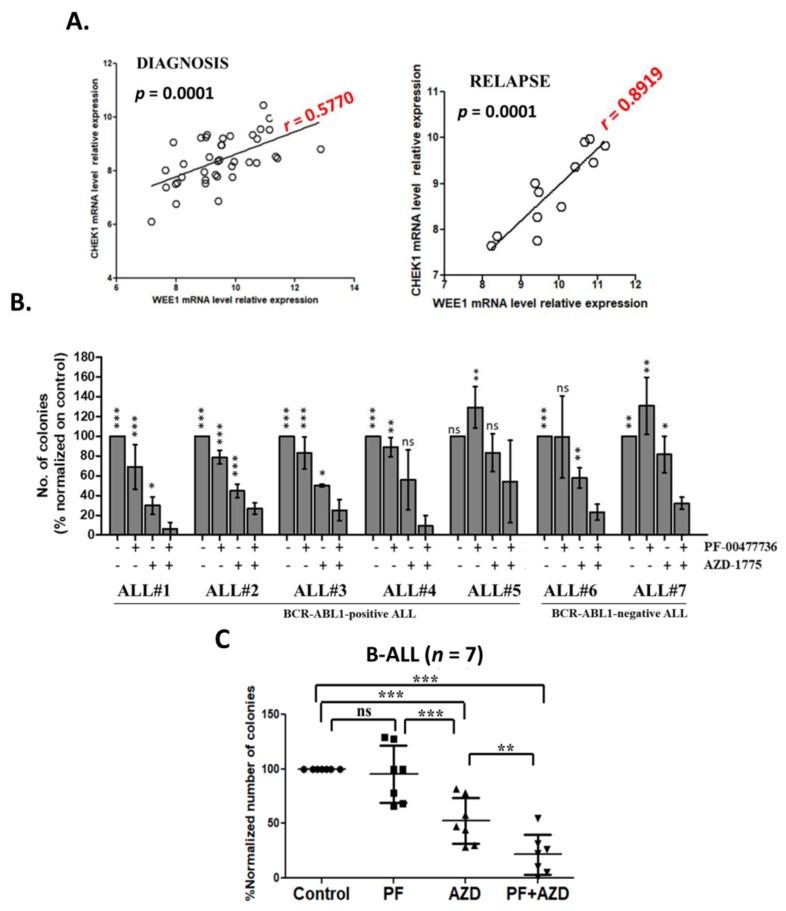
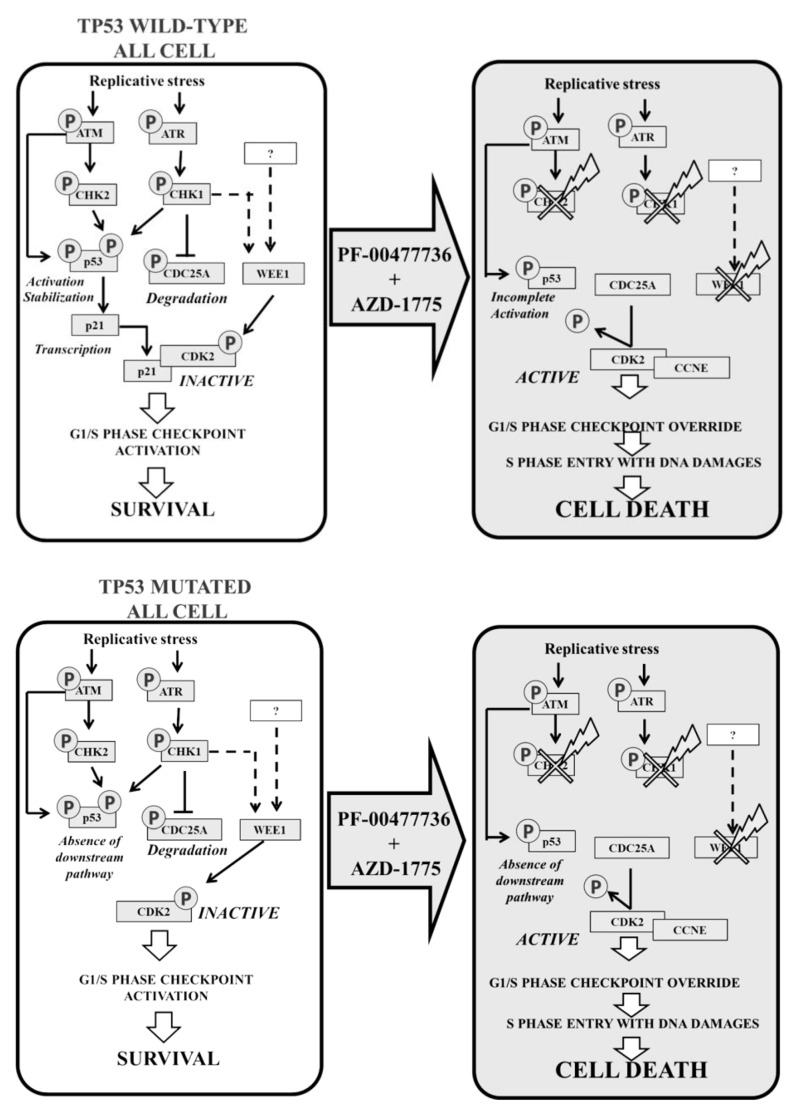
Results: This study reports, for the first time, the efficacy of the concomitant inhibition of CHK1/CHK2 and WEE1 in ALL cell lines and primary leukemic B-ALL cells using two selective inhibitors: PF-0047736 (CHK1/CHK2 inhibitor) and AZD-1775 (WEE1 inhibitor). We showed strong synergism in the reduction of cell viability, proliferation and induction of apoptosis. The efficacy of the combination was related to the induction of early S-phase arrest and to the induction of DNA damage, ultimately triggering cell death. We reported evidence that the efficacy of the combination treatment is independent from the activation of the p53-p21 pathway. Moreover, gene expression analysis on B-ALL primary samples showed that Chek1 and Wee1 are significantly co-expressed in samples at diagnosis (Pearson r = 0.5770, p = 0.0001) and relapse (Pearson r= 0.8919; p = 0.0001). Finally, the efficacy of the combination was confirmed by the reduction in clonogenic survival of primary leukemic B-ALL cells.

Conclusion: Our findings suggest that the combination of CHK1 and WEE1 inhibitors may be a promising therapeutic strategy to be tested in clinical trials for adult ALL.

Keywords: CHK1; DNA damage response; WEE1; acute lymphoblastic leukemia; synergism.


Conflict of interest statement

G.M. (Giovanni Martinelli) has competing interests with Novartis, BMS, Roche, Pfizer, ARIAD, MSD.

Figures

Figure 1
Figure 1
The simultaneous inhibition of CHK1/CHK2 and WEE1 synergizes in term of reduction of cell viability and induction of apoptosis in ALL cell lines. (A) Cell viability of RPMI-8402 and NALM-6 cell lines treated simultaneously with increasing concentration of PF-00477736 (nM) and AZD-1775 (nM) for 24, 48 and 72 h. Abbreviations PF = PF-00477736, AZD = AZD-1775. (B) Growth curve analysis of RPMI-8402 and NALM-6 cell lines treated for 24 h with AZD-1775 (185 nM; dark grey full square) and PF-00477736 (25 and 250 nM respectively; light gray full triangle). In the graph AZD-1775 in combination with PF-00477736 is named AZD + PF(black full triangle). (C) Apoptosis analysis on RPMI-8402 and NALM-6 cell lines treated for 24 h with AZD-1775 (185 nM) and PF-00477736 (25 and 250 nM respectively). In the figures statistical significance was represented as asterisks and in detail: p < 0.05 one asterisk (*); p < 0.01 two asterisks (**); p < 0.001 three asterisks (***).
Figure 1
Figure 1
The simultaneous inhibition of CHK1/CHK2 and WEE1 synergizes in term of reduction of cell viability and induction of apoptosis in ALL cell lines. (A) Cell viability of RPMI-8402 and NALM-6 cell lines treated simultaneously with increasing concentration of PF-00477736 (nM) and AZD-1775 (nM) for 24, 48 and 72 h. Abbreviations PF = PF-00477736, AZD = AZD-1775. (B) Growth curve analysis of RPMI-8402 and NALM-6 cell lines treated for 24 h with AZD-1775 (185 nM; dark grey full square) and PF-00477736 (25 and 250 nM respectively; light gray full triangle). In the graph AZD-1775 in combination with PF-00477736 is named AZD + PF(black full triangle). (C) Apoptosis analysis on RPMI-8402 and NALM-6 cell lines treated for 24 h with AZD-1775 (185 nM) and PF-00477736 (25 and 250 nM respectively). In the figures statistical significance was represented as asterisks and in detail: p < 0.05 one asterisk (*); p < 0.01 two asterisks (**); p < 0.001 three asterisks (***).
Figure 2
Figure 2
PF-00477736 in combination with AZD-1775 causes early S-phase arrest. (A) Cell cycle analyses of NALM-6 cell lines treated simultaneously with subtoxic concentration AZD-1775 (185 nM) and PF-00477736 (250 nM) for 24 h. The histograms show the percentage of cells in a specific cell cycle phase. (B) Cell cycle analyses of RPMI-8402 cell lines treated simultaneously with subtoxic concentrations of AZD-1775 (185nM) and PF-00477736 (25 nM) for 24 h. The histograms show the percentage of cells in a specific cell cycle phase. (C) Western Blot analyses of RPMI-8402 and NALM-6 cell lines treated for 24 h with AZD-1775 (185 nM) and PF-00477736 (25 and 250 nM respectively). β-actin was used for loading normalization. For relative quantification of each protein see Figure S1C and for whole western blot images see Figure S4. (D) The graph represents the normalized RLU (relative light unit) of NALM-6 and RPMI-8402 treated with AZD-1775 (185 nM) and PF-00477736 (25 and 250 nM respectively) for 24 and 48 h. the experiments were performed in triplicates. (E) Viability analysis of NALM-6 and RPMI-8402 cell lines treated with AZD-1775 (185 nM) and PF-00477736 (250 and 25 nM, respectively) for 6 h and then with MTX (40 nM) for 18 h. Above the histograms is schematically represented the experimental procedure for the drug combination studies. The flash lighting points when the drugs were added to the cell culture. In the figures statistical significance was represented as asterisks and in detail: p < 0.05 one asterisk (*); p < 0.01 two asterisks (**); p < 0.001 three asterisks (***).
Figure 2
Figure 2
PF-00477736 in combination with AZD-1775 causes early S-phase arrest. (A) Cell cycle analyses of NALM-6 cell lines treated simultaneously with subtoxic concentration AZD-1775 (185 nM) and PF-00477736 (250 nM) for 24 h. The histograms show the percentage of cells in a specific cell cycle phase. (B) Cell cycle analyses of RPMI-8402 cell lines treated simultaneously with subtoxic concentrations of AZD-1775 (185nM) and PF-00477736 (25 nM) for 24 h. The histograms show the percentage of cells in a specific cell cycle phase. (C) Western Blot analyses of RPMI-8402 and NALM-6 cell lines treated for 24 h with AZD-1775 (185 nM) and PF-00477736 (25 and 250 nM respectively). β-actin was used for loading normalization. For relative quantification of each protein see Figure S1C and for whole western blot images see Figure S4. (D) The graph represents the normalized RLU (relative light unit) of NALM-6 and RPMI-8402 treated with AZD-1775 (185 nM) and PF-00477736 (25 and 250 nM respectively) for 24 and 48 h. the experiments were performed in triplicates. (E) Viability analysis of NALM-6 and RPMI-8402 cell lines treated with AZD-1775 (185 nM) and PF-00477736 (250 and 25 nM, respectively) for 6 h and then with MTX (40 nM) for 18 h. Above the histograms is schematically represented the experimental procedure for the drug combination studies. The flash lighting points when the drugs were added to the cell culture. In the figures statistical significance was represented as asterisks and in detail: p < 0.05 one asterisk (*); p < 0.01 two asterisks (**); p < 0.001 three asterisks (***).
Figure 3
Figure 3
The combination triggers the DDR pathway and induces DNA damages independently for p53 functionality. (A) Western Blot analyses of RPMI-8402 and NALM-6 cell lines treated for 24 h with AZD-1775 (185 nM) and PF-00477736 (25 and 250 nM respectively). β-actin was used for loading normalization. For relative quantification of each protein see Figure S2 and for whole western blot images see Figure S5. (B) Western Blot analyses of RPMI-8402 and NALM-6 cell lines treated for 24 h with AZD-1775 (185 nM) and PF-00477736 (25 and 250 nM respectively). β-actin was used for loading normalization. For relative quantification of each protein see Figure S3A and for whole western blot images see Figure S6.
Figure 4
Figure 4
The inhibition of CHK1, CHK2 e WEE1 compromises primary leukemic B-ALL clonogenic capacity. (A) Dot plot showing the Pearson correlation (r value) of Wee1 and Chek1 relative mRNA level in primary leukemic ALL samples at diagnosis (n = 39) and at relapse (n = 14). On the top of each dot plot is reported the statistical significance of the analysis and on the linear regression is reported in red the Pearson correlation value (r). (B) Clonogenic assays of primary leukemic cells isolated from the bone marrow of adult B-ALL patients (n = 7). The columns represent the normalized number of colonies in the treated samples in relationship to the control. The asterisks in the graph represent how the effect of the combined treatment in the reduction of the number of colonies is significantly different from the single treatments and from the un-treated control. (C) Scatter plot representing the mean of 7 independent experiments. In the graph AZD-1775 in combination with PF-00477736 is named AZD + PF. In the figures statistical significance was represented as asterisks and in detail: p < 0.05 one asterisk (*); p < 0.01 two asterisks (**); p < 0.001 three asterisks (***).
Figure 5
Figure 5
Schematic representation of the combination strategy using PF-0477736 and AZD-1775 in ALL cells.

Similar articles

Cited by

References

    1. Garcia-Manero G., Kantarjian H.M. The hyper-CVAD regimen in adult acute lymphocytic leukemia. Hematol. Oncol. Clin. N. Am. 2000;14:1381–1396. doi: 10.1016/S0889-8588(05)70192-1. - DOI - PubMed
    1. Delia D., Mizutani S. The DNA damage response pathway in normal hematopoiesis and malignancies. Int. J. Hematol. 2017;106:328–334. doi: 10.1007/s12185-017-2300-7. - DOI - PubMed
    1. Swift L.H., Golsteyn R.M. Genotoxic anti-cancer agents and their relationship to DNA damage, mitosis, and checkpoint adaptation in proliferating cancer cells. Int. J. Mol. Sci. 2014;15:3403–3431. doi: 10.3390/ijms15033403. - DOI - PMC - PubMed
    1. Visconti R., Della Monica R., Grieco D. Cell cycle checkpoint in cancer: A therapeutically targetable double-edged sword. J. Exp. Clin. Cancer Res. 2016;35:153. doi: 10.1186/s13046-016-0433-9. - DOI - PMC - PubMed
    1. Rundle S., Bradbury A., Drew Y., Curtin N.J. Targeting the ATR-CHK1 axis in cancer therapy. Cancers. 2017;9:41. doi: 10.3390/cancers9050041. - DOI - PMC - PubMed