. 2019 Dec 2;129(12):5553-5567.
doi: 10.1172/JCI129025.

Galectin-1-driven T cell exclusion in the tumor endothelium promotes immunotherapy resistance

Affiliations

Galectin-1-driven T cell exclusion in the tumor endothelium promotes immunotherapy resistance

Dhanya K Nambiar et al. J Clin Invest. .

Abstract

Immune checkpoint inhibitors (ICIs), although promising, have variable benefit in head and neck cancer (HNC). We noted that tumor galectin-1 (Gal1) levels were inversely correlated with treatment response and survival in patients with HNC who were treated with ICIs. Using multiple HNC mouse models, we show that tumor-secreted Gal1 mediates immune evasion by preventing T cell migration into the tumor. Mechanistically, Gal1 reprograms the tumor endothelium to upregulate cell-surface programmed death ligand 1 (PD-L1) and galectin-9. Using genetic and pharmacological approaches, we show that Gal1 blockade increases intratumoral T cell infiltration, leading to a better response to anti-PD1 therapy with or without radiotherapy. Our study reveals the function of Gal1 in transforming the tumor endothelium into an immune-suppressive barrier and that its inhibition synergizes with ICIs.

Keywords: Head and neck cancer; Immunotherapy; Oncology; Radiation therapy.


Conflict of interest statement

Conflict of interest: AK, ZW, and VR are employees and stockholders of Bristol-Myers Squibb, which makes anti–galectin-1 and anti-PD1 antibodies.

Figures

Figure 1
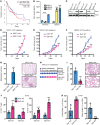
Figure 1. Gal1 promotes tumor growth and metastases in a HNC model by causing immune suppression.
(A) Kaplan-Meier analysis of overall survival of patients with HNSCC according to Gal1 gene expression (n = 518 patients, TCGA data set). P = 0.0016. (B) ELISA results for secreted levels of Gal1 in murine HNSCC cells (MOC1, MEERL, and MOC2) after 24 hours of normoxia or hypoxia (0.5% O2). (C) Immunoblots show Gal1 deletion with CRISPR/Cas9 in MOC1, MOC2, and MEERL cells and stable lentiviral overexpression of Gal1 in MOC1 (MOC1 + Gal1) cells. (D) Tumor growth curves for C57BL/6 mice subcutaneously implanted with 1 × 10⁶ MOC1 vector control cells (MOC1-Vec) or MOC1 Gal1-overexpressing cells (MOC1-Gal1) (n = 5 mice). (E) Tumor growth curves for C57BL/6 mice subcutaneously implanted with 2.5 × 10⁵ MOC2 Gal1 WT or Gal1-KO cells (n = 5 mice). (F) Tumor growth curves for C57BL/6 mice subcutaneously implanted with 1 × 10⁶ MEERL Gal1 WT or Gal1-KO cells (n = 5 mice/group). (G) Quantification of lung metastases foci after subcutaneous implantation of each cell line. The number of nodules per lung area was quantified by H&E staining (scale bars: 500 μm). In the graph, each dot represents 1 mouse, and the bar indicates the mean. (H) Quantification of LN metastases in mice bearing either MOC2 Gal1 WT or Gal1-KO tumors. (I) Quantification and representative histologic images of metastatic foci in lungs after subcutaneous implantation of MOC2 Gal1 WT or Gal1-KO cells, measured at comparable primary tumor sizes. Scale bars: 250 μm. (J) Quantification of CD4+ and CD8+ T cells in MOC2 Gal1 WT and Gal1-KO tumors at sizes of approximately 100 mm3 and 300 mm3, after enzymatic dissociation and flow cytometric analyses. (K) Flow cytometric analyses of CD44 and CD62L markers on CD3+ T cells from MOC2 Gal1 WT and Gal1-KO tumors. **P < 0.01 and ***P < 0.001. Overall survival was summarized using Kaplan-Meier curves, and groups were compared using log-rank tests (A); repeated-measures ANOVA was used for tumor growth measurement over time (DF); and a 2-tailed Student’s t test was used for comparisons of single treatment with the control (B, G, and IK).
Figure 2
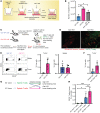
Figure 2. Gal1 mediates T cell exclusion from the tumor microenvironment by inhibiting T cell infiltration.
(A) Schematic representation of transendothelial migration assay. (B) Quantification of T cell migration through preconditioned ECs. Mouse ECs (C166) pretreated for 24 hours with MOC2 Gal1 WT or Gal1-KO CM, with or without anti-Gal1 antibody, were seeded onto Transwell inserts. T cells (2 × 10⁵) were seeded onto the upper chamber of the Transwell. The number of migrated cells at the bottom of the well was quantified 4 hours after transfer. (C) Schematic of adoptive T cell transfer experimental design. (D) Representative images of adoptively transferred CSFE-labeled T cells (green) and dextran rhodamine–stained vasculature (red) in MOC2 Gal1 WT or Gal1-KO tumors following cryosectioning and imaging using a ×40 objective (scale bars: 250 μm). (E) Flow cytometric plots and quantification graphs showing the percentage of adoptively transferred live CD3+ T cells in dissociated MOC2 Gal1 WT or Gal1-KO tumors and respective spleens from tumor-bearing mice. SSC-A, side scatter area. (F) Quantification of adoptively transferred T cells in MOC2 Gal1 WT tumors from mice treated for 8 days with isotype IgG or 200 μg anti-Gal1 antibody every 4 days. Each dot represents 1 mouse (n = 4–5 mice). (G) Schematic representation showing the donor and recipient mice in the adoptive transfer experiments. (H) Quantification of T cells after 48 hours in MOC2 Gal1 WT or Gal1-KO tumors from mice that received splenic T cells from donor mice bearing either MOC1 Gal1 WT or Gal1-KO tumors. *P < 0.05, **P < 0.01, and ***P < 0.001. Each dot represents 2 mice (n = 4–5 mice). Data are presented as the mean ± SD. A 1-way ANOVA with Tukey’s adjustment was used for comparison of multiple treatments (B and H); a 2-tailed Student’s t test was used for comparison of the single treatment with the control (E and F).
Figure 3
Figure 3. Gal1 preconditioning upregulates STAT1 activation on ECs.
(A) Images showing vessel normalization as measured by costaining of CD31 (red) and α-SMA (green) in MOC2 Gal1 WT and MOC2 Gal1-KO tumor sections (~100 mm3 in size). Scale bars: 100 μm. (B) Images showing vessel perfusion in vivo using intravenous injection of Hoechst 33258 (blue) and rhodamine dextran (red) dyes into Gal1 WT or Gal1-KO tumor–bearing mice at comparable volumes. Data are presented as the mean ± SD (n = 3). Scale bars: 25 μm. (C) Transendothelial migration of T cells across NECs or TECs isolated from MOC2 Gal1 WT (TECs – Gal1 WT) or Gal1-KO (TECs – Gal1-KO) tumors. (D) Representative histogram and quantification of PD-L1 expression on lung NECs and TECs (CD31+CD45) and tumor cells (CD31CD45) isolated from MOC2 Gal1 WT or Gal1-KO tumors. Each dot represents 1 mouse (n = 3). (E) Immunoblots of pSTAT1 and total STAT1 in C166 mouse ECs treated with CM from MOC2 Gal1 WT cells, with or without anti-Gal1 antibody, or Gal1-KO cells or HUVECs treated with different concentrations of rGal1 for 3 hours. (F) Immunoblots of pSTAT1, pJAK2, and JAK2 in C166 mouse ECs treated with CM from MOC2 Gal1 WT cells, with or without anti-Gal1 antibody (10 μg/mL) or JAK inhibitor (100 nM), or from Gal1-KO cells treated for 24 hours in 1% serum-containing media. The numbers below the immunoblots in E and F show the relative quantitation of band intensities calculated using ImageJ (NIH). **P < 0.01; ***P < 0.001. A 2-tailed Student’s t test was used for comparison of the single treatment with the control (D); a 1-way ANOVA with Tukey’s adjustment was used for comparison of multiple treatments (C and D).
Figure 4
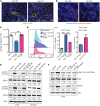
Figure 4. Tumors with high Gal1 levels show expression of enhanced immune checkpoint ligands on ECs.
(A) Double-immunofluorescence staining and quantification of PD-L1 on the tumor endothelium in MOC2 Gal1 WT and Gal1-KO tumor sections; CD31 (red) and PD-L1 (green). Scale bar: 20 μm. (B) Double-immunofluorescence staining for Gal9 in the tumor endothelium of MOC2 Gal1 WT and Gal1-KO tumor sections. CD31 is stained red and Gal9 green (n = 5/group). Scale bar: 20 μm. (C) Results of ELISA showing the levels of IFN-γ in plasma from mice bearing either MOC2 Gal1 WT or Gal1-KO tumors (n = 8/group). (D) Representative images showing differential expression and quantification of PD-L1 on tumor endothelium in human HNSCC with either high or low Gal1 expression (n = 3/group). Original magnification, ×10 (insets). (E) Transendothelial migration of T cells across TECs from MOC2 Gal1 WT or Gal1-KO tumors from mice treated with isotype IgG or anti–PD-L1 antibody. (F) Quantification of cell migration into MOC2 Gal1 WT or Gal1-KO tumors after adoptive transfer of splenic T cells that were blocked with either isotype IgG or anti-PD1 plus anti–Tim-3 antibody for 30 minutes prior to adoptive transfer (n = 4 mice/group). Data are representative of experiments repeated at least twice and are presented as the mean ± SD. **P < 0.01; ***P < 0.001. A 2-tailed Student’s t test was used for comparison of the single treatment with the control (A, C, and D); a 1-way ANOVA with Tukey’s adjustment was used for comparison of multiple treatments (E and F).
Figure 5
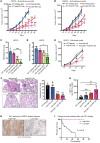
Figure 5. Gal1 inhibition reverses PD1 blockade resistance in a HNC model.
Tumor growth curves in C57BL/6 mice subcutaneously implanted with (A) MOC2 Gal1 WT or Gal1-KO tumor cells (2.5 × 10⁵) or (B) MEERL Gal1 WT or Gal1-KO tumor cells (1 × 10⁶). Following tumor establishment (~75 mm3), mice were treated with either isotype IgG or anti-PD1 antibody (200 μg i.p. every 4 days) for 4 weeks. (C) Quantification of lung metastatic foci at the end of treatment in mice bearing MOC2 tumors. (D) Number of inguinal (left and right) and axillary (left and right) nodal metastases in each mouse for each treatment group. Each dot represents 1 mouse (n = 5). (E) C57BL/6 mice were implanted with 4 × 10⁴ MOC2 Gal1 WT cells in the buccal cavity (orthotopic), followed by treatment with isotype IgG or anti-Gal1 antibody (150 μg, i.p.) and/or anti-PD1 antibody (200 μg, i.p.) every 4 days. Tumor growth was measured at regular intervals using a caliper (n = 5–8 mice/group). (F) Representative images and quantification of lung metastatic foci after treatment in the MOC2 orthotopic model (n = 5 mice/group). Scale bars: 250 μm. (G) Quantification of CD8+ T cells in orthotopically implanted tumors after treatment. (H) Representative images showing immunohistochemical staining for Gal1 in biopsy samples from patients with HNSCC prior to immunotherapy treatment. Stainings were used for the grading of high or low Gal1 expression levels. Scale bar: 100 μm. (I) Kaplan-Meier analysis showing survival probability based on the expression of Gal1 protein in the tumor cells and tumor stroma of patients (n = 33 patients) with recurrent/metastatic HNC treated with immune checkpoint therapy. High Gal1 (high Gal1 levels in either the tumor or stroma); low Gal1 (low Gal1 levels in both the tumor and stroma). Data are presented as the mean ± SD. *P < 0.05, **P < 0.01, and ***P < 0.001. A 1-way ANOVA with Tukey’s adjustment was used for comparison of multiple treatments (C, D, F, and G); a repeated-measures ANOVA was used for measurement of tumor growth over time (A, B, and E). Overall survival was summarized using Kaplan-Meier curves, and the groups were compared using log-rank tests (I). The rates of response to immunotherapy and distribution of Gal1 staining were analyzed using a χ2 test (I).
Figure 6
Figure 6. Combining Gal1 blockade with RT significantly improves the response to immunotherapy.
(A) Tumor growth curve for MOC2 Gal1 WT or Gal1-KO tumors treated with 15 Gy (2.5 Gy × 6) radiation and anti-PD1 antibody (n = 5 mice/group). (B) Flow cytometric analyses of dissociated tumors showing the percentage of CD3+ T cells after treatment. (C) Percentage of CD11c+MHC class II+ DCs. (D) Tumor growth curve for MOC2 Gal1 WT tumors treated with 15 Gy (2.5 Gy × 6) focused radiation with or without anti-Gal1 or anti-PD1 antibody (n = 4–5). Data are presented as the mean ± SD. *P < 0.05, **P < 0.01, and ***P < 0.001. A repeated-measures ANOVA was used for measurement over time of tumor growth (A and D); a 1-way ANOVA with Tukey’s adjustment was used for comparing multiple treatments (B and C).

Comment in

Similar articles

Cited by

References

    1. Postow MA, Callahan MK, Wolchok JD. Immune Checkpoint Blockade in Cancer Therapy. J Clin Oncol. 2015;33(17):1974–1982. doi: 10.1200/JCO.2014.59.4358. - DOI - PMC - PubMed
    1. Ferris RL, Blumenschein G, Jr, Fayette J, Guigay J, Colevas AD, Licitra L, et al. Nivolumab for recurrent squamous-cell carcinoma of the head and neck. N Engl J Med. 2016;375(19):1856–1867. doi: 10.1056/NEJMoa1602252. - DOI - PMC - PubMed
    1. Galon J, et al. Type, density, and location of immune cells within human colorectal tumors predict clinical outcome. Science. 2006;313(5795):1960–1964. doi: 10.1126/science.1129139. - DOI - PubMed
    1. Hwang WT, Adams SF, Tahirovic E, Hagemann IS, Coukos G. Prognostic significance of tumor-infiltrating T cells in ovarian cancer: a meta-analysis. Gynecol Oncol. 2012;124(2):192–198. doi: 10.1016/j.ygyno.2011.09.039. - DOI - PMC - PubMed
    1. Herbst RS, et al. Predictive correlates of response to the anti-PD-L1 antibody MPDL3280A in cancer patients. Nature. 2014;515(7528):563–567. doi: 10.1038/nature14011. - DOI - PMC - PubMed

Publication types

MeSH terms