. 2019 Nov 7;10(1):5065.
doi: 10.1038/s41467-019-12836-9.

AZD7648 is a potent and selective DNA-PK inhibitor that enhances radiation, chemotherapy and olaparib activity

Affiliations

AZD7648 is a potent and selective DNA-PK inhibitor that enhances radiation, chemotherapy and olaparib activity

Jacqueline H L Fok et al. Nat Commun. .

Abstract

DNA-dependent protein kinase (DNA-PK) is a critical player in the DNA damage response (DDR) and instrumental in the non-homologous end-joining pathway (NHEJ) used to detect and repair DNA double-strand breaks (DSBs). We demonstrate that the potent and highly selective DNA-PK inhibitor, AZD7648, is an efficient sensitizer of radiation- and doxorubicin-induced DNA damage, with combinations in xenograft and patient-derived xenograft (PDX) models inducing sustained regressions. Using ATM-deficient cells, we demonstrate that AZD7648, in combination with the PARP inhibitor olaparib, increases genomic instability, resulting in cell growth inhibition and apoptosis. AZD7648 enhanced olaparib efficacy across a range of doses and schedules in xenograft and PDX models, enabling sustained tumour regression and providing a clear rationale for its clinical investigation. Through its differentiated mechanism of action as an NHEJ inhibitor, AZD7648 complements the current armamentarium of DDR-targeted agents and has potential in combination with these agents to achieve deeper responses to current therapies.


Conflict of interest statement

J.H.L.F., A.R.-M., M.V.-C., P.W.G.W., V.F., N.J., P.M.F., A.K., S.E.W., J.C., J.N., D.B., G.M.L., M.R.V.F., J.W., A.S., L.O.O.C., S.L., S.E.F., M.J.O.C., S.J.H., E.D., F.W.G., B.R.D. and E.B.C. are or were employees of AstraZeneca at the time of conducting these studies. All authors hold stock in AstraZeneca.

Figures
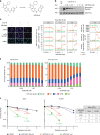
Fig. 1
Fig. 1
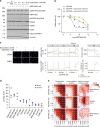
AZD7648 is a potent radiosensitizer in vitro. a Optimization of screening hit 1 into the potent and selective DNA-PK inhibitor, AZD7648. b Western blot analysis of A549 cells treated with 8 Gy IR ± 1 h pre-treatment with increasing concentrations of AZD7648. c High-content imaging analysis of indicated DNA damage markers in A459 cells. Cells were treated with 2 Gy IR ± AZD7648 pre-treatment (1 h) and immunofluorescently stained at indicated time points. Graphs represent mean foci, number of cells, micronuclei per cell or relative nuclear fragmentation from two independent experiments (n = 2, ±SEM). Black dotted lines indicate AZD7648 cellular IC50 concentration (91 nM). Representative images are shown for 2 Gy IR ± 1.25 μM AZD7648 at 72 h (scale bars, 25 μM). D represents DMSO vehicle-treated controls. d Cell cycle analysis was performed based on DAPI staining intensity of nuclei detected by imaging analysis. Graphs represent cell cycle distribution (percentage population) from a representative experiment (n = 2). N/A (non-assigned) represents cell populations where signal intensities exceeded the threshold to accurately determine the cell cycle phase. Dotted lines indicate AZD7648 cellular IC50 concentration (91 nM). e Colony formation assays performed with A549 or NCI-H1299 cells treated with an ionizing radiation dose response ± AZD7648. Graphs represent mean surviving fraction normalized to the single-agent activity of AZD7648. Data were fitted to the linear quadratic model (mean ± SD (n = 2); unpaired t-test where P ≤ 0.05 is significant). Mean dose enhancement factor values (DEF37) are shown. DAPI 4′,6-diamidino-2-phenylindole, DMSO dimethyl sulfoxide, SD standard deviation, SEM standard error of the mean
Fig. 2
Fig. 2
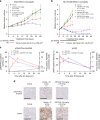
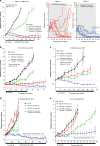
AZD7648 is a potent radiosensitizer of tumours in vivo. a A549. AZD7648 induces tumour growth inhibition in combination with IR in A549 xenografts (nude mice, vehicle and combination n = 11, IR n = 12, AZD7648 n = 9, geometric mean ± SEM). b NCI-H1299. AZD7648 induces tumour regression in combination with IR in NCI-H1299 xenografts (nude mice, vehicle n = 13, IR and AZD7648 100 mg kg−1 combination n = 11, AZD7648 single agent and 50 mg kg−1 combination n = 12, geometric mean ± SEM). For a and b, corresponding mouse bodyweights and statistical analysis can be found in Supplementary Fig. 2A, B and Supplementary Table 3A. To assess tumour growth inhibition, one-tailed, two-sample, t-test with unequal variances was used and for tumour regression, one-sample t-test analysis. c, d Pharmacodynamic modulation of DNA-PK biomarkers and pharmacokinetics (PK) of AZD7648 after dosing of AZD7648 and IR in A549 xenografts. pDNA-PKcs Ser2056 and γH2AX were measured by immunohistochemistry (image scale bars, 200 μm; nude mice, 0 h n = 8, all treatments n = 5, mean ± SEM). Several comparisons between the IR and IR + AZD7648 treatments were found to be statistically significant using a one-way ANOVA. For pDNA-PKcs Ser2056: 0.5 h (p < 0.0001), 3 h (p = 0.0005) and 7 h (p < 0.0001). For γH2AX: 0.5 h (p = 0.05) and 7 h (p = 0.02)
Fig. 3
Fig. 3
AZD7648 and doxorubicin have synergistic combination activity in breast and ovarian cancer cell lines. a Western blot analysis of OAW42 cells treated with doxorubicin (100 nM) ± AZD7648 (3 μM). b Concentration-dependent response to AZD7648 ± doxorubicin was measured by a Live/Dead assay. Graphs represent percentage viable cells ± SD following 5 days’ treatment relative to DMSO vehicle-treated controls from a representative experiment (n = 3). c High-content imaging analysis of indicated DNA damage markers in OAW42 cells. Cells were treated with increasing AZD7648 concentrations ± doxorubicin (3 nM) and immunofluorescently stained at indicated time points. Graphs represent mean ± 2 SEM γH2AX signal intensity, number of 53BP1 foci, number of cells/well, or micronuclei per cell from three independent experiments. Representative images are shown for AZD7648 (1 μM) ± doxorubicin (3 nM) at 48 h (scale bars, 25 μm). D represents DMSO vehicle-treated controls. d Synergy scores for the AZD7648 and doxorubicin combination in a panel of four ovarian and seven breast cancer cell lines. Cells were treated for 5–7 days and viability was measured by the Live/Dead assay. A synergy score of >5 is indicative of synergistic activity. e Activity heatmaps from representative experiments for MDA-MB-468, OAW42 and MDA-MB-436 cells. Experimental activity heatmap represents growth inhibitory (0–100) and cytotoxic activity (100–200) following treatment. Loewe additivity model fit heatmap represents expected activity values for an additive combination. Concentrations where combination activity occurred in excess of the expected activity are boxed in pink. Synergy scores from the representative experiment are indicated in brackets
Fig. 4
Fig. 4
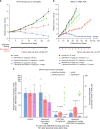
AZD7648 and liposomal doxorubicin synergize to inhibit tumour growth in vivo. a BT474. AZD7648 induces tumour regression in combination with liposomal doxorubicin in BT474 breast cancer xenografts (nude mice, vehicle and AZD7648 n = 12, liposomal doxorubicin n = 9, combination n = 11, geometric mean ± SEM). b AZD7648 induces tumour stasis in combination with liposomal doxorubicin in HBCx-17 TNBC PDX (nude mice, n = 10, geometric mean ± SEM). For a and b, corresponding mouse bodyweights and statistical analysis can be found in Supplementary Figs. 2C and 5A and Supplementary Table 3B. To assess tumour growth inhibition, a one-tailed, two-sample, t-test with unequal variances was used and for tumour regression, one-sample t-test analysis. c Pharmacokinetics of AZD7648 and pharmacodynamic modulation of DNA-PK biomarkers pDNA-PKcs Ser2056, pRPA32 Ser4/Ser8, and γH2AX after dosing of AZD7648 and liposomal doxorubicin in BT474 xenografts. Mice were dosed once with liposomal doxorubicin and with AZD7648 for 3 days. Samples were then collected 8 h after a last morning dose of AZD7648 on the fourth day. Measured by western blotting (nude mice, vehicle and liposomal doxorubicin n = 8, AZD7648 and combination n = 5, mean ± SEM). Significance assessed with two-sided t-tests performed on log-transformed data assuming unequal variance
Fig. 5
Fig. 5
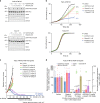
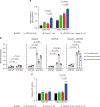
AZD7648 and olaparib combination has antiproliferative efficacy. a Western blot analysis of whole-cell lysates from FaDu WT or ATM KO cells treated with AZD7648 (0.6 μM), olaparib (0.1, 0.3 or 1 μM) or the combination for 24 hours. Both cell lines were run on the same blot. b Cell confluency of FaDu ATM KO and WT cells treated with AZD7648, olaparib or their combination. Graphs represent mean percentage cell confluency from a representative experiment (n = 4). Percentage values indicate final cell confluency at the indicated time point. c AZD7648 induces complete tumour regression in combination with olaparib in FaDu ATM KO xenografts (SCID mice, vehicle n = 6, olaparib n = 10, AZD7648 37.5 and 75 mg kg−1 single agent and combination at 37.5 mg kg−1 n = 8, combination at 75 mg kg−1 n = 11, geometric mean ± SEM). Corresponding mouse bodyweights and statistical analysis can be found in Supplementary Fig. 2E and Supplementary Table 3C. To assess tumour growth inhibition, one-tailed, two-sample, t-test with unequal variances was used and for tumour regression, one-sample t-test analysis. d Pharmacokinetics of AZD7648 and pharmacodynamic modulation of DNA-PK biomarkers after dosing of AZD7648 and olaparib in FaDu ATM KO xenografts. Mice were taken from the efficacy study described above (c) between days 11 and 18, and samples were collected 2 h after the first dose of AZD7648 (1 h after the dose of olaparib). Measured by western blotting (SCID mice, vehicle n = 10, olaparib n = 11, AZD7648 n = 12, combination n = 3, mean ± SEM). Significance assessed with two-sided t-tests performed on log-transformed data assuming unequal variance
Fig. 6
Fig. 6
AZD7648 and olaparib combination has anti-tumour efficacy in PDX models. a AZD7648 induces tumour regression in combination with olaparib in HBCx-17 TNBC PDX (nude mice, n = 10; individual tumour spider plots for olaparib and combination groups). b AZD7648 induces tumour regression in combination with olaparib in CTG-703 ovarian PDX (nude mice, olaparib n = 4, other treatments n = 6). c AZD7648 induces tumour regression in combination with olaparib in OV2022 ovarian PDX (SCID mice, n = 8). d AZD7648 induces tumour regression in combination with olaparib in CTG-0828 NSCLC PDX (nude mice, vehicle n = 5, other treatments n = 3). e AZD7648 in combination with olaparib induces significant TGI in CTG-0149 H&N PDX (nude mice, vehicle n = 5, other treatments n = 3). All graphs represent geometric mean ± SEM. Corresponding mouse bodyweights and statistical analysis can be found in Supplementary Fig. 5B–F and Supplementary Table 3C. To assess tumour growth inhibition, one-tailed, two-sample, t-test with unequal variances was used and for tumour regression, one-sample t-test analysis
Fig. 7
Fig. 7
AZD7648 in combination with olaparib affects genome stability and induces apoptosis in ATM KO cells. a Frequency of micronuclei formation in FaDu WT and ATM KO cells following 72 h treatment. Data are shown as mean number of micronuclei per cell (mean ± SEM; n = 2; unpaired t-test, P ≤ 0.05 is significant). b Chromosomal aberrations in FaDu WT and ATM KO cells treated with olaparib (1 μM), AZD7648 (1 μM), or the combination for 48 h were detected by metaphase spread analysis. Chromatid breaks, chromosome breaks and chromosome fusions were quantified separately. Data are shown as mean aberrations per metaphase spread (mean ± SD; n = 3; paired t-test, P ≤ 0.05 is significant, 50 metaphase spreads/sample). c Caspase 3/7 activity of FaDu ATM KO and WT cells following 72 h treatment. Graph represents mean fluorescence levels normalized for total cell confluency and relative to the DMSO vehicle-treated control (mean ± SD; n = 3; two-way ANOVA, P ≤ 0.05 is significant)
Fig. 8
Fig. 8
Anti-tumour effect of intermittent schedules of AZD7648 in combination with olaparib in FaDu ATM KO xenografts. Discontinuous schedules of AZD7648 increase the anti-tumour effects of olaparib in FaDu ATM KO xenografts. Doses: AZD7648 75 mg kg−1 bid; olaparib 100 mg kg−1 qd, dosed 1 h after AZD7648 dose (SCID mice, vehicle n = 13, olaparib n = 10, AZD7648 n = 8, continuous and 7ON 21OFF n = 6, 7ON 14OFF n = 7, 7ON 7OFF and 14ON 14OFF n = 5, geometric mean ± SEM). Corresponding mouse bodyweights and statistical analysis can be found in Supplementary Fig. 2G, Supplementary Table 3D. To assess tumour growth inhibition, one-tailed, two-sample, t-test with unequal variances was used and for tumour regression, one sample t-test analysis

Similar articles

Cited by

References

    1. Jackson SP, Bartek J. The DNA-damage response in human biology and disease. Nature. 2009;461:1071–1078. doi: 10.1038/nature08467. - DOI - PMC - PubMed
    1. O’Connor MJ. Targeting the DNA damage response in cancer. Mol. Cell. 2015;60:547–560. doi: 10.1016/j.molcel.2015.10.040. - DOI - PubMed
    1. Lieber MR. The mechanism of double-strand DNA break repair by the nonhomologous DNA end-joining pathway. Annu Rev. Biochem. 2010;79:181–211. doi: 10.1146/annurev.biochem.052308.093131. - DOI - PMC - PubMed
    1. Davis AJ, Chen BP, Chen DJ. DNA-PK: a dynamic enzyme in a versatile DSB repair pathway. DNA Repair (Amst.) 2014;17:21–29. doi: 10.1016/j.dnarep.2014.02.020. - DOI - PMC - PubMed
    1. Yang F, Teves SS, Kemp CJ, Henikoff S. Doxorubicin, DNA torsion, and chromatin dynamics. Biochim. Biophys. Acta. 2014;1845:84–89. - PMC - PubMed

Publication types

MeSH terms