. 2020 Jan:28:101359.
doi: 10.1016/j.redox.2019.101359. Epub 2019 Oct 25.

Ferritin is regulated by a neuro-intestinal axis in the nematode Caenorhabditis elegans

Affiliations

Ferritin is regulated by a neuro-intestinal axis in the nematode Caenorhabditis elegans

Leonor Romero-Afrima et al. Redox Biol. 2020 Jan.

Abstract

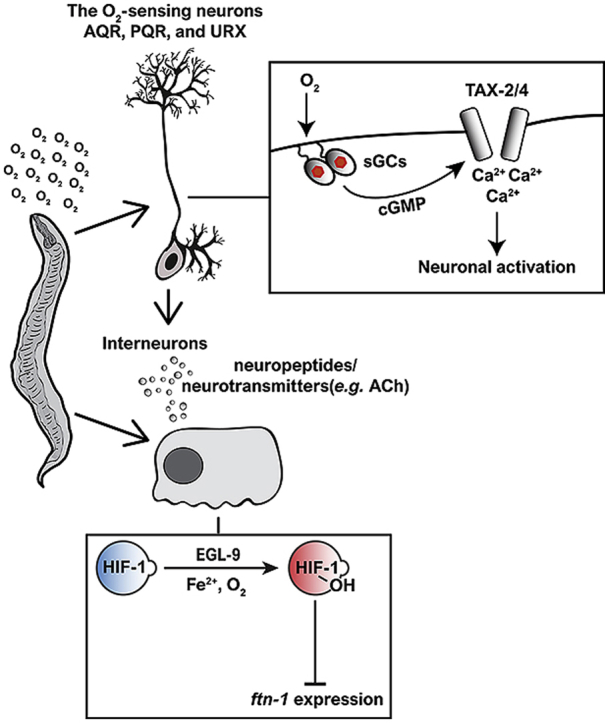
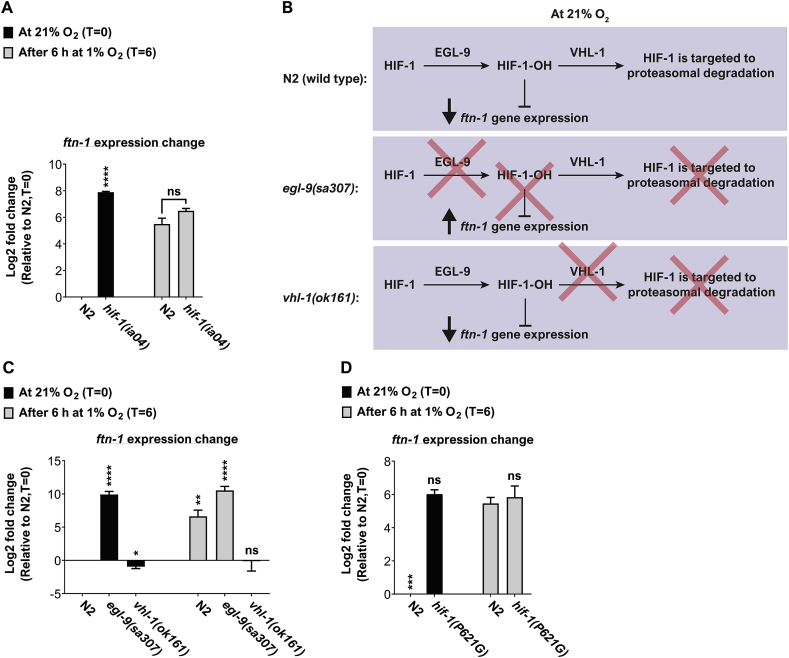
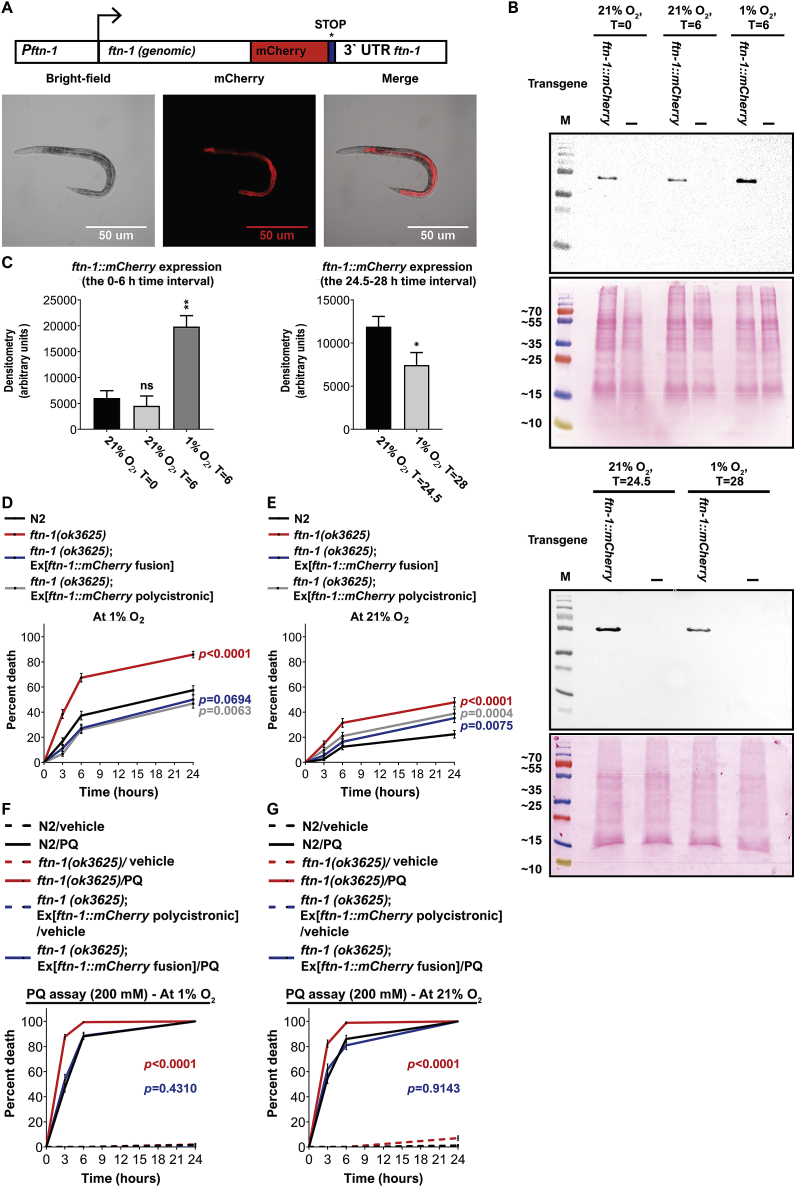
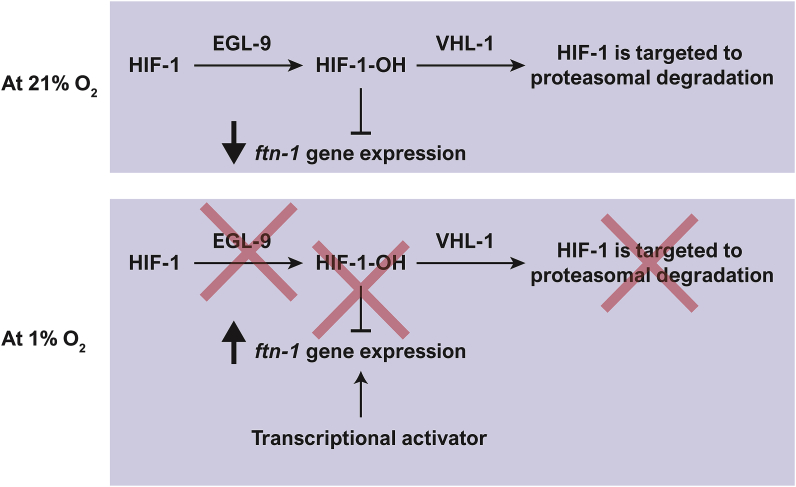
Iron is vital for the life of most organisms. However, when dysregulated, iron can catalyze the formation of oxygen (O2) radicals that can destroy any biological molecule and thus lead to oxidative injury and death. Therefore, iron metabolism must be tightly regulated at all times, as well as coordinated with the metabolism of O2. However, how is this achieved at the whole animal level is not well understood. Here, we explore this question using the nematode Caenorhabditis elegans. Exposure of worms to O2 starvation conditions (i.e. hypoxia) induces a major upregulation in levels of the conserved iron-cage protein ferritin 1 (ftn-1) in the intestine, while exposure to 21% O2 decreases ftn-1 level. This O2-dependent inhibition is mediated by O2-sensing neurons that communicate with the intestine through neurotransmitter and neuropeptide signalling, and requires the activity of hydroxylated HIF-1. By contrast, the induction of ftn-1 in hypoxia appears to be HIF-1-independent. This upregulation provides protection against Pseudomonas aeruginosa bacteria and oxidative injury. Taken together, our studies uncover a neuro-intestine axis that coordinates O2 and iron responses at the whole animal level.

Keywords: Caenorhabditis elegans; EGL-9; Ferritin; HIF-1; Hypoxia; Oxygen sensing neurons; Soluble guanylate cyclases; VHL-1; ftn-1.


Conflict of interest statement

The authors declare that they have no conflict of interest.

Figures

Image 1
Graphical abstract
Fig. 1
Fig. 1
Intestinal ftn-1 expression is regulated by O2. mRNA level of genes identified by microarray was examined by qRT-PCR at 0 h–6 h (A) and 24.5 h–28 h (B) time points. The expression of the ned-8 and ubq-2 genes was used as a reference in all of the qPCR experiments. The efficiency of target and reference genes was checked with a standard curve and used in fold-change calculations. Data represent the average of at least three biological replicates. (Error bars represent SEM).
Fig. 2
Fig. 2
AQR, PQR, and URX inhibit the expression of ftn-1 at 21% O2. Bar graphs presenting the expression of ftn-1 at 21% O2 and after 6 h exposure in 1% O2. (A) Ablation of AQR, PQR, and URX resulted in increased expression of ftn-1 at 21% O2. Asterisks indicate significant compared to AQR, PQR, and URX ablated worms at 21% O2. Notably, the level of ftn-1 at 21% O2, in the AQR, PQR, and URX ablated strain, was similar to the level of ftn-1 in hypoxia. (B) Neurotransmitter/neuropeptide signalling is required for inhibiting ftn-1 expression at 21% O2. Asterisks indicate significant compared to N2 controls, within each experimental condition. (C) A schematic model for ACh synthesis, transport, and secretion; inspired by Ref. [81]. ACh synthesis (D) and transport (E) are crucial for inhibiting ftn-1 expression at 21% O2. Asterisks indicate significant compared to N2 controls after 6 h at 1% O2. These graphs represent the average of 4–7 (A), 3–5 (B), 5–6 (D), and 3–5 (E) biological repeats, respectively. Multiplet-tests with Holm-Sidak multiple comparison correction. *p < 0.5, ***p < 0.001, ****p < 0.0001, ns = non-significant. Multiple t-tests with Holm-Sidak multiple comparison correction. Error bars represent SEM. These graphs represent the average of 4–7 (A) and 3–5 (B) biological repeats, respectively. Multiplet-tests with Holm-Sidak multiple comparison correction. ***p < 0.001, ns = non-significant. Multiple t-tests with Holm-Sidak multiple comparison correction. Error bars represent SEM.
Fig. 3
Fig. 3
TAX-2 and TAX-4 inhibit ftn-1 expression at 21% O2. (A) Schematic illustration presenting a model for AQR, PQR, and URX activation at 21% O2. Upon O2 binding GCY-35/GCY-35 increase cGMP production. cGMP binds to the TAX-2/TAX-4 channel complex and thus facilitates calcium (Ca2+) entry, and depolarization. (B) Bar graph presenting the expression of ftn-1 at 21% O2 and after 6 h exposure in 1% O2 in wild-type (N2) worms and in tax-2, tax-4, and cng-1 mutants. Asterisks indicate significance for comparisons with N2 animals at the beginning of the experiments (21% O2, time = 0; left side of the graph) and the significance for comparisons with N2 animals after 6 h at 1% O2 (time = 6; right side of the graph). Multiple t-tests with Holm-Sidak multiple comparison correction. These graphs represent the average of 3–8 biological repeats. Error bars represent SEM. *p < 0.05, ****p < 0.0001, ns = non-significant.
Fig. 4
Fig. 4
sGCs act in AQR, PQR, and URX to inhibit ftn-1 expression at 21% O2. (A) Bar graph presenting the expression of ftn-1 at 21% O2 and after 6 h exposure in 1% O2 in wild-type (N2) worms and in sGCs mutants. Asterisks indicate significance for comparisons with N2 animals at the beginning of the experiments (21% O2, time = 0; left side of the graph) and the significance for comparisons with N2 animals after 6 h at 1% O2 (time = 6; right side of the graph). Multiple t-tests with Holm-Sidak multiple comparison correction. These graphs represent the average of 3–12 biological repeats. Error bars represent SEM. **p < 0.01, ***p < 0.001, ****p < 0.0001, ns = non-significant. (B) Measurement of sGC interaction through yeast two-hybrid assay. Diploid growth on selectable plates containing SD/–Leu/–Trp, X-α-Gal, and Aureobasidin A or non-selective plates (control plates) containing SD/–Leu/–Trp (upper and lower panels, respectively; in each Y2H experiment). Physical interaction between sGCs is indicated by colony formation on the selective media and the hydrolysis of X-α-Gal to a blue end product. (For interpretation of the references to colour in this figure legend, the reader is referred to the Web version of this article.)
Fig. 5
Fig. 5
HIF-1 is not required for ftn-1-upregulation at 1% O2. (A) Bar graphs presenting the expression of ftn-1 at 21% O2 and after 6 h exposure in 1% O2. Asterisks indicate significance for comparisons with N2 animals at the beginning of the experiments (21% O2, time = 0). The level of ftn-1 expression was similar in the two strains after 6 h in 1% O2. These graphs represent the average of 3 biological repeats. (B) A schematic working model presenting the inhibitory function of hydroxylated HIF-1 (HIF-1-OH). The egl-9 mutation inhibits the formation of HIF-1-OH, and thus results in constitutive ftn-1 expression. By contrast, the vhl-1 mutation results in HIF-1-OH enrichment, and therefore constitutive inhibition of ftn-1 expression. (C) Bar graphs presenting the expression of ftn-1 at 21% O2 and after 6 h exposure in 1% O2 in wild-type (N2) worms and egl-9 and vhl-1 mutants (B) or in HIF-1(P621G) transgenic worms (D). In (C), asterisks indicate significance for comparisons with N2 animals at the beginning of the experiments (21% O2, time = 0). In (D), the comparison was against ftn-1- expression in N2 worms at 1% O2. These graphs represent the average of 3–4 biological repeats. Multiple t-tests with Holm-Sidak multiple comparison correction. Error bars represent SEM. *p < 0.05, **p < 0.01, ****p < 0.0001, ns = non-significant.
Fig. 6
Fig. 6
FTN-1 protects against PA14 toxicity and oxidative injury. (A) Transgenic ftn-1(ok3625) worms expressing an ftn-1 translational reporter. Scale bar: 50 μm. (B) Representative blots from at least four biological repeats are shown (for the 0–6 and 24.5–28 time points; upper and lower panels, respectively). Lysate from transgenic ftn-1::mCherry (indicated as “ftn-1::mCherry) and ftn-1(ok3625) mutants (indicated as “-”) were separated on a 12% SDS-PAGE gel and blotted with an anti-mCherry antibody. The Ponceau staining of the same gel is shown below the Western blot. Numbers on the left specify the protein molecular marker size in kDa. (C) Bar graphs showing the quantification of ftn-1::mCherry blot shown in (B). Asterisks indicate significance for comparisons with N2 animals at the beginning of the experiments (21% O2, time = 0; left side of the graph) and the significance for comparisons with N2 animals after 30 min at 21% O2 (post 24 h at 1% O2, time = 24.5; right side of the graph). Unpaired t-test with Welch's correction. Error bars represent SEM. *p < 0.05, **p < 0.01, ns = non-significant. These graphs represent the average of at least 4 biological repeats. Survival curves comparing the resistance of different worm strains to PA14 at 1% and 21% O2, (D and E, respectively). The survival of the worms was measured after 3, 6, and 24 h incubation at 25 °C. These graphs represent the average of nine independent experiments. Survival curves comparing the resistance of different worm strains to PQ at 1% and 21% O2, (F and G, respectively). The survival of the worms was measured after 3, 6, and 24 h incubation at 25 °C. These graphs represent the average of eight (1% O2) and twelve (21% O2) independent experiments. In D-G, P values indicate significance for comparisons with N2 worms. Log-rank (Mantel-Cox) test. Error bars represent SEM.
Fig. 7
Fig. 7
A model for ftn-1 regulation by HIF-1. At 21% O2, HIF-1 is targeted to degradation via the activity of EGL-9 and VHL-1. However, some hydroxylated HIF-1 (HIF-1-OH) escapes degradation and acts to suppress ftn-1 expression. At 1% O2, HIF-1 is accumulated in its non-hydroxylated form. Therefore, ftn-1 expression is not inhibited. We hypothesize that ftn-1 expression is induced by a yet-to-be-identified transcription factor.

Similar articles

Cited by

References

    1. Halliwell Barry, John G. In: Free Radicals in Biology and Medicine. Gutteridge John., editor. Clarendon Press; Oxford: 2007.
    1. Halliwell B. Reactive species and antioxidants. Redox biology is a fundamental theme of aerobic life. Plant Physiol. 2006;141(2):312–322. - PMC - PubMed
    1. Winterbourn C.C. Toxicity of iron and hydrogen peroxide: the Fenton reaction. Toxicol. Lett. 1995;82–83:969–974. - PubMed
    1. Chepelev N.L., Willmore W.G. Regulation of iron pathways in response to hypoxia. Free Radic. Biol. Med. 2011;50(6):645–666. - PubMed
    1. Dixon S.J., Stockwell B.R. The role of iron and reactive oxygen species in cell death. Nat. Chem. Biol. 2014;10(1):9–17. - PubMed

Publication types

MeSH terms