. 2019 Oct 24:8:e47261.
doi: 10.7554/eLife.47261.

The Tudor SND1 protein is an m6A RNA reader essential for replication of Kaposi's sarcoma-associated herpesvirus

Affiliations

The Tudor SND1 protein is an m6A RNA reader essential for replication of Kaposi's sarcoma-associated herpesvirus

Belinda Baquero-Perez et al. Elife. .

Abstract

N6-methyladenosine (m6A) is the most abundant internal RNA modification of cellular mRNAs. m6A is recognised by YTH domain-containing proteins, which selectively bind to m6A-decorated RNAs regulating their turnover and translation. Using an m6A-modified hairpin present in the Kaposi's sarcoma associated herpesvirus (KSHV) ORF50 RNA, we identified seven members from the 'Royal family' as putative m6A readers, including SND1. RIP-seq and eCLIP analysis characterised the SND1 binding profile transcriptome-wide, revealing SND1 as an m6A reader. We further demonstrate that the m6A modification of the ORF50 RNA is critical for SND1 binding, which in turn stabilises the ORF50 transcript. Importantly, SND1 depletion leads to inhibition of KSHV early gene expression showing that SND1 is essential for KSHV lytic replication. This work demonstrates that members of the 'Royal family' have m6A-reading ability, greatly increasing their epigenetic functions beyond protein methylation.

Keywords: RNA modification; infectious disease; m6A; microbiology; virus; virus infection.


Conflict of interest statement

BB, AA, IY, IC, SW, AW No competing interests declared

Figures
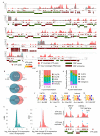
Figure 1.
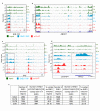
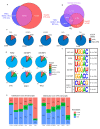
Figure 1.. The KSHV transcriptome is extensively m6A-modified.
(a) KSHV epitranscriptome map in TREx BCBL1-Rta cells at 20 hr post-lytic reactivation. m6A-IP reads and input reads are shown. m6A peaks identified by m6AViewer software with associated p-values are indicated. (b) Number of cellular m6A peaks consistently called by m6AViewer software in two biological replicates throughout KSHV infection. (a,b) To define significantly enriched m6A peaks in both viral and cellular RNAs, a minimum fold change of m6A-IP reads over input reads of ≥ 1.5 and a FDR < 5% was required in both biological replicates. Peaks positions were considered overlapping between replicates if the calls were within 100 nucleotides between corresponding positions. (c) Kernel density estimate (KDE) on the RNAs coding for the 10,190 m6A peaks present in latent but not 20 hr reactivated cells (left graph) and on the RNAs coding for the 5,170 m6A peaks present at 20 hr reactivation but not in latent cells (right graph). (d) Distribution of m6A peaks in five topological regions of cellular RNAs during latent and lytic KSHV replication. UTR, untranslated region. CDS, coding region. (e) Distribution of m6A peaks in four topological regions of viral RNAs during latent and lytic KSHV replication. UTR, untranslated region. CDS, coding region. (f) Most significantly enriched DRm6ACH consensus identified in m6A peaks present in four topological regions of cellular transcripts. MEME software was used for motif analysis. (g) Most significantly enriched DRm6ACH motif found in viral transcripts. MEME software was used for motif analysis. (h) RNA affinity baits were centred on the closest GGACU motif to the second m6A peak of open reading frame (ORF37) and the first and fourth m6A peaks of the second exon of ORF50 transcript (blue triangles). m6A-IP reads and input reads for ORF37 and ORF50 transcript from two biological replicates at 20 hr post-viral reactivation are shown.
Figure 1—figure supplement 1.
Figure 1—figure supplement 1.. The KSHV transcriptome is differentially m6A-modified during the course of reactivation.
(a, b) m6A-IP reads and input reads are shown. m6A peaks identified by m6aViewer software with associated p-values are indicated. (a) KSHV epitranscriptome map of lytic TREx BCBL1-Rta cells after 8 hr post-reactivation for one of the m6A-seq biological replicates. (b) Common viral m6A peaks in two biological replicates are shown in the human TREx BCBL1-Rta cell line after 20 hr post-lytic reactivation.
Figure 1—figure supplement 2.
Figure 1—figure supplement 2.. Validation of m6A peaks.
Total RNA isolated from TREx BCBL1-Rta cells was chemically fragmented and subjected to m6A-IP-qRT-PCR. Primers specific for regions spanning m6A peaks were designed as positive control primers. ORF50-1, ORF50-2, ORF50-3 and ORF50-4 indicate primers that generate an amplicon spanning the first, second, third and fourth m6A peaks of the second exon of ORF50 transcript respectively. ORF50-intron primers generate an amplicon spanning the m6A peak in the ORF50 intron. ORF50 negative primers were designed at the start of the second exon of ORF50 mRNA. ORF57 positive primers span the tallest m6A peak in the second exon of ORF57 mRNA while negative primers span the first m6A peak in the ORF57 second exon. ORF32 and ORF37 negative primers were positioned at the start of the coding region of ORF32 and ORF37 respectively. % of recovered input was calculated for each region of interest and the fold change over the % of input of control negative primers was calculated. For all figures, values are averages, error bars present s.d. n ≥ 3 independent m6A-IPs, each from an independent viral reactivation.
Figure 2.
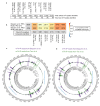
Figure 2.. Comparison of epitranscriptomic maps in different KSHV-infected cell lines (a, b) Fastq files were downloaded from SRA (GEO accessions: GSE93676 and GSE104621) using sratoolkit.
Raw sequencing data were subjected to quality control and processing as described in methods. Reads were aligned to a combined human hg38 and KSHV genome reference. m6A peaks were identified with m6aViewer version 1.6.1. Peaks were filtered to keep only those with a minimum of 20 mean reads, 1% FDR (benjamini-hochberg) and an enrichment of 4-fold m6A-IP/input. Overlapping m6A peaks between replicates were collapsed using GenomicRanges R package and only peaks detected across all replicates were kept for further comparisons. (b) Total number of overlapping m6A-modified transcripts identified between replicates are displayed for each dataset and time point in the grey boxes. The percentage of the total m6A-modified transcripts identified in our dataset that overlap with previously published studies in TREx BCBL1-Rta and iSLK cells (Hesser et al., 2018; Tan et al., 2018) is shown, with 1 being 100%. (c) Comparison of the lytic epitranscriptomic map from our study and the one performed by Tan et al., both carried out in TREx BCBL1-Rta. Circos plot of m6A-IP read coverage across the viral episome is shown for both studies. Coverage tracks were scaled to account for differences in library sizes. KSHV gene positions are indicated by the central track. Some differences in the identified m6A peaks between the two datasets are highlighted. (d) As described in c, but comparing Baquero et al. lytic TREx BCBL1-Rta cells with lytic iSLK cells from Tan et al.
Figure 2—figure supplement 1.
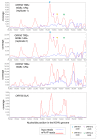
Figure 2—figure supplement 1.. Viral ORF50 RNA is consistently detected as m6A-modified in different m6A-seq datasets.
Top two deep-sequencing coverage tracks of ORF50 RNA are shown for our two lytic biological replicates at 20 hr reactivation in TREx BCBL1-Rta cells. The four m6A peak positions which we further focussed on this study are highlighted. Below is the coverage for ORF50 RNA at 48 hr reactivation in TREx BCBL1-Rta cells from Tan et al. (2018). Bottom panel shows the coverage of ORF50 RNA in iSLK cells (24 hr post-reactivation) from the Tan et al. study (Hesser et al., 2018).
Figure 3.
Figure 3.. LC-MS/MS identifies members from the ‘Royal family’ as putative m6A readers.
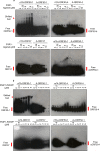
(a) Mass spectrometry results of RNA affinity pull-downs using m6A-modified and unmodified (control) biotinylated viral RNA baits. A single RNA affinity biological replicate for each RNA bait was carried out. Statistical significance of enrichment was not determined, instead, all proteins identified for a given methylated and control bait were sorted by total number of peptide spectrum matches (PSM’s) for the m6A bait. Proteins were then considered as enriched in methylated baits if the number of PSM’s assigned to the protein was at least double in the methylated bait compared with the control bait. In this table, the number of unique peptides assigned to each protein is shown for each bait for clarity. (b–f) EMSAs were carried out using recombinant SND1-C-terminus protein (residues 548–910) and biotinylated viral RNA baits. A cropped version of ORF50-1 bait (cORF50-1) and a stable version of ORF50-1 bait (named sORF50-1) in which the beginning of the stem is made to have strong base pairing was also tested. Representative EMSAs from six and two independent protein purifications for b and c-f, respectively.
Figure 3—figure supplement 1.
Figure 3—figure supplement 1.. m6A peak positions from all m6A-seq biological replicates studied.
m6A peak positions are highlighted in yellow for all biological replicates and time-points studied (0 hr, 8 hr and 20 hr post-reactivation). m6A-methylation motifs are highlighted in red and sequences selected for RNA affinity are shaded in grey. Note that the GGACT motif is centred in the middle of each RNA affinity bait.
Figure 3—figure supplement 2.
Figure 3—figure supplement 2.. Validation of RNA affinity pull-downs.
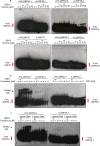
Validation of YTHDF1 and SND1 binding to the three viral baits was performed by RNA affinity using protein lysates from TREx BCBL1-Rta cells that had been reactivated for 24 hr (left panel). Detection of bound proteins was performed by western blotting, for SND1 a mouse monoclonal antibody was used. Note that YTHDF1 protein was cleaved during lytic KSHV reactivation, as this band was absent in latent cells (data not shown). The SND1 mouse antibody detects three different SND1 bands which we further confirmed to be specific by SND1 siRNA knockdown (siRNA name Hs_SND1_5 from Qiagen) in TREx BCBL1-Rta cells (right panel). Unr., unreactivated. Scr., scramble. KD., knockdown.
Figure 3—figure supplement 3.
Figure 3—figure supplement 3.. RNA secondary structure prediction of viral RNA baits.
Free energy RNA structures for viral RNA baits as predicted by UNAfold web server. Note that the beginning of the stem of ORF50-1 bait (black box) presents weak base-pairing with four unpaired nucleotides (AUCC). The stable ORF50-1 bait (sORF50-1) has seven nucleotides replaced compared with ORF50-1 (mutated bases are indicated in lower case) to stabilise this region (blue box). Triangles point to the adenosine that is m6A-modified at the GGACU motif within the apical loop. Curly braces highlight large unpaired bulges. Free energy (dG) is shown for each bait.
Figure 3—figure supplement 4.
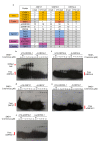
Figure 3—figure supplement 4.. A fraction of free m6A-ORF50-1 bait migrates slower than A-ORF50-1 bait.
Representative native EMSA using ORF50-1 baits on their own without any protein addition using a one second film exposure to detect the baits. Two free bands in m6A-ORF50-1 bait are observed more clearly in the burn out nylon membrane after ECL exposure. Corresponding electrospray ionisation (ESI) of the baits are shown. Representative native EMSAs for the rest of the baits from EMSAs that did not result in a positive shift and applying one second film exposure. All ESI traces were provided by Integrated DNA Technologies, the manufacturer of the biotinylated RNA baits.
Figure 3—figure supplement 5.
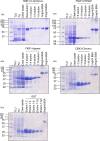
Figure 3—figure supplement 5.. Representative coomassie-stained SDS-PAGE gels for all recombinant proteins used.
TLU, total lysate from E. coli uninduced cells. TLI, total lysate from E.coli induced cells.
Figure 3—figure supplement 6.
Figure 3—figure supplement 6.. Recombinant proteins containing the PWWP domain of PSIP1 and the plant agenet domain of FXR1 selectively bind m6A-modified hairpins.
(a) EMSAs were carried out using recombinant GST-FXR1-agenet domain (residues 2–132) and biotinylated viral RNA baits. (b) EMSAs were carried out using recombinant GST-PSIP1-PWWP domain (residues 3–100) and biotinylated viral RNA baits. (a, b) Representative EMSAs from two different protein preparations are shown. cORF50-1, cropped ORF50-1.
Figure 3—figure supplement 7.
Figure 3—figure supplement 7.. Neither CBX3 chromodomain nor GST protein show selectively for binding m6A-modified RNA.
(a) EMSAs were carried out using recombinant GST-CBX3-Chromo domain (residues 29–86) and biotinylated viral RNA baits. cORF50-1, cropped ORF50-1. Representative EMSAs from two different protein preparations are shown. (b) EMSAs were carried out side by side using recombinant SND1-C-terminus protein (residues 548–910) and control GST protein. Up to 15 µM GST protein was also tested without showing any shift (data not shown). (c) EMSAs were carried out using recombinant SND1-C-terminus protein (residues 548–910) in the absence (-) or presence (+) of herring sperm DNA (5 µg per binding reaction). Representative EMSAs from two different protein preparations are shown.
Figure 4.
Figure 4.. SND1 is a bona fide RNA-binding protein that targets transcripts bearing m6A modification.
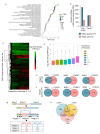
(a) Most significantly enriched GO terms amongst the 5061 target RNAs (Ensembl transcripts) identified by RIP-seq which are consistently bound by SND1 at all time points (0 hr, 8 hr and 20 hr post-reactivation) in TREx BCBL1-Rta cells. FDR, false discovery rate. (b) Consistently bound SND1 RNA targets throughout the course of KSHV infection are enriched in m6A-modified RNAs, while non-targets are depleted. Target transcripts are defined by a fold change RIP/input > 2 while non-targets have a fold change input/RIP > 2. A false discovery rate (FDR) < 1% is applied to RIP-seq data. (c) Hierarchical clustering of fold change RIP/input for SND1 targets. (d) No significant correlation between the number of m6A peaks in a given RNA and the binding of SND1 as determined by log2 fold change RIP/input. Target transcripts with >300 mean reads of coverage per RNA were used for the analysis. Analysis using a lower expression cut-off showed similar results. (e, f) High-confidence SND1-bound genes (summarised at HGNC gene symbol annotation level) were defined using a cut-off of FDR < 1% and a fold change RIP/input > 2, while m6A peaks were detected using a FDR < 5% and > 1.5 fold m6A-IP reads over input reads. RNA targets and m6A peaks for YTH readers were mined from publically available PAR-CLIP and m6A-seq datasets from HeLa cells. (e) Overlap of target genes with m6A modifications between SND1 and heterologously expressed YTH reader proteins. (f) Overlap of target genes lacking m6A modifications between SND1 and heterologously expressed YTH reader proteins. (g) For SND1 localised enrichment analysis, introns are collapsed and exons spliced together into a single continuous RNA molecule. Spliced transcripts and introns are then segmented into transcriptomic regions based on changes in their fold change RIP/input. (h) Venn diagram showing the overlap between SND1 enrichment in coding region (CDS) and untranslated regions (UTRs) of SND1 target transcripts identified by localised enrichment analysis.
Figure 4—figure supplement 1.
Figure 4—figure supplement 1.. Long RNA fragments crosslinked to SND1 are enriched over shorter fragments during RIP.
(a) Following sonication of formaldehyde-fixed TREx BCBL1-Rta cells, proteins were removed by proteinase K treatment and cross-links were reversed. Sonicated RNA was then isolated with Trizol LS and 1 µg was separated on a 1.2% (w/v) agarose gel containing 0.1 µg/ml of ethidium bromide. 1 µg of intact total RNA was used as a size marker. Lane one contained intact total RNA. Lane two contained sonicated total RNA. rRNA, ribosomal RNA. (b) 2200 TapeStation trace of sonicated total RNA (input) before RIP. The majority of the fragments are between 50 and 200 base pairs (bp) in length with a small tail of fragments of larger sizes (>500 bp). (c) 2200 TapeStation trace of cDNA library built from the immunoprecipitated RNA fragments after RIP. Note that the heat fragmentation step before cDNA synthesis was omitted to evaluate the true size of the immunoprecipitated RNA. Fragments smaller than 100 bp were totally depleted, in contrast a large tail of fragments that reached 1 kB in length was evident. Due to the large size of RNA fragments observed after SND1 immunoprecipitation, for all deep-sequencing of RIP samples used in this study, isolated RNA from RIP samples was fragmented for 7 min at 94°C before first strand synthesis.
Figure 4—figure supplement 2.
Figure 4—figure supplement 2.. 65 % of all RNA targets of YTH readers contain m6A-modified transcripts.
Overlaps between the total RNA targets identified by PAR-CLIP for each individual heterologously expressed YTH reader in HeLa cells with the subset of m6A-modified transcripts identified by m6A-seq in the same cell line. Publically available processed PAR-CLIP and m6A-seq datasets (Wang et al., 2014; Wang et al., 2015; Shi et al., 2017) were used for this analysis.
Figure 4—figure supplement 3.
Figure 4—figure supplement 3.. Bioinformatic analysis of SND1 RIP-seq data.
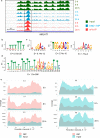
(a) Genome sequencing tracks from latent (0 hr) and lytic (8 hr and 20 hr post-reactivation) TREx BCBL1-Rta cells depicting input (green) and RIP (blue) coverage. m6A-IP reads (red) are also shown. (b) The most enriched motif found in SND1-bound intronic enriched regions. (c) Significantly enriched motifs in SND1-bound intronic enriched regions. (d) A U-tract coupled to a DRm6ACH motif is significantly enriched in SND1-bound intronic regions that overlap m6A peaks. (e) Deep-sequencing coverage for input and RIP samples for ORF50 transcript (left panel) and ORF57 transcript (right panel) in latent (0 hr) and lytic TREx BCBL1-Rta cells reactivated for 8 hr and 20 hr. Note the significantly lower coverage for the lytic ORF50 and ORF57 transcripts during latency compared with lytic replication as expected. The fold change RIP/input for each time point is indicated.
Figure 5.
Figure 5.. SND1 RNA-binding sites specifically overlap m6A peaks (a, b) Genome sequencing tracks from latent (0 hr) and lytic (8 hr and 20 hr post-reactivation) TREx BCBL1-Rta cells depicting input (green) and RIP (blue) coverage.
m6A-IP reads (red) are also shown. Blue boxes indicate exons while blue lines represent introns. SND1 overlaps with m6A peaks are evident in introns (ARL17A) and 5’UTRs (ABCD1). Note that in ABCD1, SND1 binding and m6A peaks are both reduced at 8 hr post-reactivation while at 20 hr post-reactivation methylation and SND1 binding signal are both lost with decreasing expression in inputs. (c, d) Dynamic SND1 binding to m6A-modified regions in SND1 target transcripts during KSHV infection. Genome tracks depicting sequencing read coverage from input (green) and RIP (blue) samples. m6A-IP reads (pink) are also shown. Note that in contrast to ABCD1, RHOU/DUSP5P1 remain highly expressed even at 20 hr post-reactivation, suggesting the coupled loss of methylation/SND1-binding is independent of the ability to detect these events due to loss of expression. (e) SND1 regions consistently enriched across the three time points studied (0 hr, 8 hr and 20 hr) were defined by applying a fold change RIP/input >2 and>50 mean reads per region (FDR < 1%). Consistently SND1-unbound regions throughout KSHV infection were defined using a fold change RIP/input <0.5 and>50 mean reads per region (FDR < 1%). For all m6A overlap analysis, the cut-off for an m6A peak was defined as having 50 read paired at the tallest point in the m6A peak and a 2-fold enrichment of m6A-IP reads over input reads using a FDR < 1%.
Figure 6.
Figure 6.. SND1 binds the consensus m6A motif.
(a) Overlap of m6A-modified transcripts in the indicated cell lines. (b) Overlap between the indicated eCLIP, RIP-seq and m6A-seq enriched transcripts. (c) Direct overlap of m6A-seq peaks and eCLIP binding sites for m6A reader proteins (FXR2, IGF2BP1, IGF2BP3), SND1 and the control, TIAL1. (d) Distribution of binding sites for the indicated proteins across RNA biotypes. (e) Distribution of binding sites across different transcript regions for the indicated proteins. (f) Motif analysis using HOMER and HepG2 eCLIP datasets as indicated. Top panel m6A-seq derived motif in HepG2 cells (note that this is the highest scoring motif derived), central panels are consensus motifs found using all target transcripts, bottom panel is the two most highly enriched SND1 motifs in the set of m6A-modified exons bound by SND1.
Figure 7.
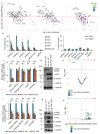
Figure 7.. SND1 binds the essential ORF50 RNA in KSHV-infected cells and SND1 knockdown significantly impairs KSHV lytic replication.
(a) RIP-seq identifies KSHV mRNAs as high-confidence SND1 targets at 0 hr (left panel), 8 hr (middle panel) and 20 hr (right panel) post-reactivation. Red dashed line indicates a cut-off of >2 fold change RIP/input. Red arrow points ORF50. Note that lytic genes are also detected in latent cells (0 hr) due to spontaneous KSHV reactivation and the high sensitivity of deep-sequencing. As expected, significantly lower coverage for these lytic genes was detected during latency compared with lytic replication. (b) RIP for endogenous SND1, FXR1, FXR2, PSIP1, normal rabbit IgG, YTHDF1 and YTHDF3 followed by qRT-PCR detection. ORF50-1, ORF50-2, ORF50-3 and ORF50-4 indicate primers that generate an amplicon spanning the first, second, third and fourth m6A peaks of the second exon of ORF50 RNA, respectively. ORF50-intron generates an amplicon spanning the m6A peak in the ORF50 intron. ORF50 negative primers were designed at the start of the second exon of ORF50 RNA. Fold enrichment is relative to the enrichment of the non-target 18S rRNA. Values are averages, error bars present s.d. For SND1 RIPs, n = 4 independent RIPs, for FXR1, FXR2 and normal rabbit IgG n = 3 independent RIPs. For PSIP1 and YTH proteins, n = 2 independent RIPs. (c–h) Stable cell lines expressing scramble shRNA (scr. KD) or two independent shRNAs targeting SND1 were generated using TREx BCBL1-Rta cells (c–e) or BCBL1 cells (f–h). (c) Cellular and viral RNA levels were measured by qRT-PCR 24 hr post-reactivation. n = 3 independent viral reactivations. Values are averages, error bars present s.d. ***p<0.001 using an unpaired t-test. ns = not significant. (d) Immunoblot analysis of protein lysates from latent or 24 hr reactivated cells. ORF57 antibody detects both full length ORF57 protein (black arrow) and the caspase-7-cleaved form (white arrow). For SND1 detection a rabbit polyclonal antibody was used. Western blots are representative of two independent viral reactivations. (e) Volcano plot displaying viral expression of scramble KD and SND1 KD2 cells 24 hr post-reactivation analysed by RNA-seq. The green arrow highlights the quadrant containing upregulated viral ORFs in depleted cells. The red arrow highlights the quadrant containing downregulated ORFs in depleted cells. The red dashed line denotes the FDR < 1% cut-off. (f) Cellular and viral RNA levels were measured by qRT-PCR 24 hr post-reactivation. n = 3 independent viral reactivations. Values are averages, error bars present s.d. **p<0.01, ***p<0.001 using an unpaired t-test. (g) Immunoblot analysis of protein lysates from latent or 24 hr reactivated cells. Western blots are representative of two independent viral reactivations. (h) Volcano plot displaying viral expression of scramble KD and SND1 KD2 cells 24 hr post-reactivation analysed by RNA-seq. The red and purple dashed lines denote the FDR < 1% and FDR < 5% cut-offs, respectively.
Figure 7—figure supplement 1.
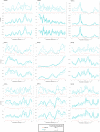
Figure 7—figure supplement 1.. Sequencing coverage tracks for SND1 high-confidence viral RNA targets at 20 hr post-reactivation.
Figure 7—figure supplement 2.
Figure 7—figure supplement 2.. Sequencing coverage tracks for SND1 high-confidence viral RNA targets at 20 hr post-reactivation.
Figure 7—figure supplement 3.
Figure 7—figure supplement 3.. SND1 does not bind the KSHV ORF50 promoter.
ChIP experiments were carried out with latent and lytic (24 hr post-reactivation) BCBL1 cells. 2 µg of either RNAPII (positive control antibody), SND1 antibody or normal rabbit IgG (negative control antibody) were used per immunoprecipitation. The promoter of GAPDH was used as a positive control region to evaluate RNAPII binding. n = 3 independent viral reactivations followed by three independent chromatin immunoprecipitations. Values are averages, error bars present s.d.
Figure 7—figure supplement 4.
Figure 7—figure supplement 4.. m6A methylation has a pro-viral role in the KSHV lytic life cycle.
(a, b) BCBL1 cells were transduced with either scramble or METTL3-specific shRNAs. Two days post-transduction media was replaced with puromycin-containing media (3 μg/mL). Following 5 days post-transduction cells were reactivated for 24 hr and viral RNA and protein levels analysed. (c, d) Stable cell lines expressing scramble shRNA (scr. KD) or two independent shRNAs targeting the eraser FTO were generated using BCBL1 cells that had been under puromycin selection for at least 8 days. a, c) Cellular and viral RNA levels were measured by qRT-PCR 24 hr post-reactivation. n = 3 independent viral reactivations. Values are averages, error bars present s.d. *p<0.05, **p<0.01, ***p<0.001 using an unpaired t-test. ns = not significant. (b, d) Immunoblot analysis of protein lysates from latent or 24 hr reactivated cells. ORF57 antibody detects both full length ORF57 protein (black arrow) and the caspase-7-cleaved form (white arrow). Western blots are representative of two independent viral reactivations.
Figure 7—figure supplement 5.
Figure 7—figure supplement 5.. Depletion of YTH readers impairs KSHV lytic replication.
(a, b) Stable cell lines expressing scramble shRNA (scr.KD) or two independent shRNAs targeting the reader YTHDF1 were generated using BCBL1 cells. (c, d) BCBL1 cells were transduced with either scramble or YTHDF2-specific shRNAs. Following 5 days post-transduction cells were reactivated for 24 hr and viral RNA and protein levels analysed. Note that YTHDF2 protein was noticeably reduced following viral reactivation in scramble KD cells compared with latent scramble KD cells. (e, f) Stable cell lines expressing scramble shRNA (scr. KD) or two independent shRNAs targeting the reader YTHDF3 were generated using BCBL1 cells. a, c, e Cellular and viral RNA levels were measured by qRT-PCR 24 hr post-reactivation. For YTHDF1 and YTHDF2 knockdowns n = 3 independent viral reactivations. For YTHDF3 knockdown n = 4 independent viral reactivations. Values are averages, error bars present s.d. *p<0.05, **p<0.01, ***p<0.001 using an unpaired t-test. ns = not significant. b, d, f Immunoblot analysis of protein lysates from latent or 24 hr reactivated cells. ORF57 antibody detects both full length ORF57 protein (black arrow) and the caspase-7-cleaved form (white arrow). Western blots are representative of two independent viral reactivations.
Figure 8.
Figure 8.. SND1 stabilises native ORF50 RNA and inhibition of m6A deposition on this RNA abolishes SND1 binding.
(a) RNA-seq analysis reveals significant alterations in splicing events between scramble latent and scramble lytic TREx BCBL1-Rta cells (left panel), whilst no significant changes in splicing are observed between scramble and SND1-depleted cells during latency (middle panel) or 24 hr lytic replication (right panel). (b) TREx BCBL1-Rta cells were reactivated for 24 hr into the lytic cycle and transcription was inhibited with the addition of actinomycin D (2.5 μg/ml). Transcripts of interest were measured by qRT-PCR at 0 hr, 3 hr and 6 hr post-transcription inhibition (TI). Each viral gene was normalised against 18S rRNA. Values are averages, error bars present s.d. n = 4 independent viral reactivations. (c) m6A-enrichment was determined by m6A-IP-qPCR. HEK 293 cells were transfected for 24 hr with either wild type (WT) FLAG-ORF50 or a double mutant plasmid in which the GGACT motifs present in the ORF50-1 and ORF50-4 baits were mutated to GGATT. When using DAA, 4 hr after transfection DAA was added at a concentration of 200 µM, and 24 hr post-treatment cells were harvested. % of input was calculated similarly as to ChIP-qPCR analysis. Values are averages, error bars present s.d. *p<0.05, **p<0.01, ***p<0.001 using an unpaired t-test. ns = not significant. For WT ORF50 n = 9 independent m6A-IPs [3 including 0.25% (v/v) DMSO-treatment), for double mutant ORF50 n = 3, for DAA-treated cells n = 3. (d) HEK 293 cells were transfected for 24 hr with either wild type (WT) FLAG-ORF50 or a single mutant plasmid in which the GGACT motif present in the ORF50-1 bait was mutated to GGATT. For DAA-treated cells, 4 hr after transfection DAA was added at a concentration of 200 µM, and 24 hr post-treatment cells were harvested. SND1 enrichment was determined by SND1-RIP-qPCR and is relative to the enrichment found in the non-target 18S rRNA. GAPDH RNA served as an additional non-target RNA. Values are averages, error bars present s.d. For WT and mutant ORF50 n = 4 independent RIPs. For DAA-treated cells n = 3 independent RIPs. *p<0.05, **p<0.01 using an unpaired t-test.
Figure 8—figure supplement 1.
Figure 8—figure supplement 1.. DAA was not cytotoxic in HEK-293 cells.
(a) MTS assay was performed on HEK-293 cells 26 hr post-3-deazaadenosine (DAA) treatment. Values are averages, error bars present s.d. Data shown is representative of two MTS assays performed on different days. (b) Western blotting of protein lysates from HEK-293 cells 26 hr post-DMSO (0.25% v/v) or 200 µM DAA treatment. PARP antibody detects full length PARP1 (116 kDa) (black arrow) and the cleaved form (89 kDa) (white arrow).
Author response image 1.

Similar articles

Cited by

References

    1. Adams-Cioaba MA, Guo Y, Bian C, Amaya MF, Lam R, Wasney GA, Vedadi M, Xu C, Min J. Structural studies of the tandem tudor domains of fragile X mental retardation related proteins FXR1 and FXR2. PLOS ONE. 2010;5:e13559. doi: 10.1371/journal.pone.0013559. - DOI - PMC - PubMed
    1. Alarcón CR, Lee H, Goodarzi H, Halberg N, Tavazoie SF. N6-methyladenosine marks primary microRNAs for processing. Nature. 2015;519:482–485. doi: 10.1038/nature14281. - DOI - PMC - PubMed
    1. Alpatov R, Lesch BJ, Nakamoto-Kinoshita M, Blanco A, Chen S, Stützer A, Armache KJ, Simon MD, Xu C, Ali M, Murn J, Prisic S, Kutateladze TG, Vakoc CR, Min J, Kingston RE, Fischle W, Warren ST, Page DC, Shi Y. A chromatin-dependent role of the fragile X mental retardation protein FMRP in the DNA damage response. Cell. 2014;157:869–881. doi: 10.1016/j.cell.2014.03.040. - DOI - PMC - PubMed
    1. Anders S, Reyes A, Huber W. Detecting differential usage of exons from RNA-seq data. Genome Research. 2012;22:2008–2017. doi: 10.1101/gr.133744.111. - DOI - PMC - PubMed
    1. Andrews S. FastQC: a quality control tool for high throughput sequence data. 2010 https://www.bioinformatics.babraham.ac.uk/projects/fastqc/

Publication types

Associated data