. 2019 Oct;574(7779):553-558.
doi: 10.1038/s41586-019-1658-5. Epub 2019 Oct 23.

Heterogeneity in old fibroblasts is linked to variability in reprogramming and wound healing

Affiliations

Heterogeneity in old fibroblasts is linked to variability in reprogramming and wound healing

Salah Mahmoudi et al. Nature. 2019 Oct.

Abstract

Age-associated chronic inflammation (inflammageing) is a central hallmark of ageing1, but its influence on specific cells remains largely unknown. Fibroblasts are present in most tissues and contribute to wound healing2,3. They are also the most widely used cell type for reprogramming to induced pluripotent stem (iPS) cells, a process that has implications for regenerative medicine and rejuvenation strategies4. Here we show that fibroblast cultures from old mice secrete inflammatory cytokines and exhibit increased variability in the efficiency of iPS cell reprogramming between mice. Variability between individuals is emerging as a feature of old age5-8, but the underlying mechanisms remain unknown. To identify drivers of this variability, we performed multi-omics profiling of fibroblast cultures from young and old mice that have different reprogramming efficiencies. This approach revealed that fibroblast cultures from old mice contain 'activated fibroblasts' that secrete inflammatory cytokines, and that the proportion of activated fibroblasts in a culture correlates with the reprogramming efficiency of that culture. Experiments in which conditioned medium was swapped between cultures showed that extrinsic factors secreted by activated fibroblasts underlie part of the variability between mice in reprogramming efficiency, and we have identified inflammatory cytokines, including TNF, as key contributors. Notably, old mice also exhibited variability in wound healing rate in vivo. Single-cell RNA-sequencing analysis identified distinct subpopulations of fibroblasts with different cytokine expression and signalling in the wounds of old mice with slow versus fast healing rates. Hence, a shift in fibroblast composition, and the ratio of inflammatory cytokines that they secrete, may drive the variability between mice in reprogramming in vitro and influence wound healing rate in vivo. This variability may reflect distinct stochastic ageing trajectories between individuals, and could help in developing personalized strategies to improve iPS cell generation and wound healing in elderly individuals.


Figures
Extended Data Fig. 1 ∣
Extended Data Fig. 1 ∣. Primary old fibroblasts from mouse ear, mouse lungs and human skin secrete high levels of inflammatory cytokines, and the ability of individual cultures from ear fibroblasts to reprogram is stereotypical.
a, Cytokine profiling of plasma from young (3 months, n = 21) and old (29 months, n = 19) mice using Luminex multiplex cytokine assay (2 independent experiments). Box-and-whisker plot of log2-transformed fold change in MFI over median of young fibroblasts. Box plots depict the median and interquartile range, with whiskers indicating minimum and maximum values. *P < 0.05, **P < 0.01, ***P < 0.001, n.s., not significant; two-tailed Wilcoxon rank-sum test with Benjamini–Hochberg correction. Exact P values are in Supplementary Table 1a. b, Blood cell composition analysis of plasma from young (3 months, n = 9) and old (29 months, n = 9) mice using the Hemavet Multispecies Hematology Analyzer (2 independent experiments). Data are cell numbers per μl in whole-blood samples. Each dot represents cells from one mouse. Lines depict median. P values, two-tailed Wilcoxon rank-sum test with Benjamini–Hochberg correction. c, Percentage of fibroblasts (PDGFRα+) and immune cells in young (3 months, n = 8) and old (29 months, n = 8) fibroblast cultures at passage 3 (1 experiment), as determined by FACS using the indicated cell-type-specific surface markers. Data are mean ± s.e.m. Primary splenocytes from an 8-week-old mouse were used as a positive control (right). d, Comparison between cytokine profiles of plasma (red triangles) and conditioned medium from cultured ear fibroblasts at passage 3 (orange squares). Results are the mean log2-transformed concentrations (pg μl−1) of cytokines detected. For exact concentrations, see Supplementary Table 1a, b. n.d., not detected. e, Cytokine profiles of conditioned medium from primary cultures (passage 3) of lung fibroblasts from young (3 months, n = 8) and old (20–24 months, n = 9) mice (2 independent experiments). Box-and-whisker plot of log2-transformed fold change in MFI over median of young fibroblasts. *P < 0.05, **P < 0.01; two-tailed Wilcoxon rank-sum test with Benjamini–Hochberg correction. Box plots as in a. Exact P values are in Supplementary Table 1c. f, Cytokine profiles of conditioned medium from primary fibroblast cultures isolated from punch biopsy of pre-auricular skin of healthy human subjects of different ages. Results are shown as Spearman’s rank correlation coefficient (ρ) between donor age (years) and cytokine levels (MFI) in human fibroblast cultures (n = 8) at passage 3 (1 experiment). Each dot represents cells from one individual. P values, two-sided algorithm AS 89 in R. For multiple hypothesis testing, see Supplementary Table 1d. g, Cytokine profiles of conditioned medium collected from passage 23 cultures of iPS cell lines derived from young (3 months, n = 4) and old (29 months, n = 6) fibroblasts (1 experiment). Box-and-whisker plot of log2-transformed fold change in MFI over median of young iPS cells. Only cytokines that were detected at significantly different levels in young and old fibroblasts are shown (for a complete cytokine list and more details, see Supplementary Table 1e, f). Each dot represents an individual iPS cell line. P values, one-tailed Wilcoxon rank-sum test with Benjamini–Hochberg correction. Exact P values are in Supplementary Table 1e. Box plots as in a. h, Comparison of age-dependent changes in cytokine levels between plasma-incubated (described in a) and conditioned-medium-incubated mouse fibroblasts (described in Fig. 1b), their derived iPS cells (described in g) and from human fibroblasts (described in f) (Supplementary Table 1a, b, d, e) based on cytokines that are significantly different in conditioned medium from fibroblasts (Fig. 1b, bottom). Top (also presented in Fig. 1b), ranked fold change (old/young) in levels of the indicated cytokines in plasma, conditioned medium from mouse primary fibroblasts and iPS cells. Bottom, ranked Spearman ρ correlations for the indicated cytokines in conditioned medium from human primary fibroblasts (see f for individual ρ values). i,j, iPS cell lines derived from young and old mice show typical morphologies of mouse iPS cells, express similar levels of pluripotency markers and can give rise to cell types from all three germ layers upon embryoid body formation. i, Representative immunofluorescence images of iPS cell lines derived from young and old mice at passage 23, stained with the indicated antibodies (1 experiment). j, RT–qPCR on the indicated genes in embryoid bodies differentiated in vitro from iPS cell lines from young (n = 5) and old (n = 8) mice at passage 23 (1 experiment). Expression is presented as expression relative to the housekeeping gene Hprt1. Each bar represents one iPS cell line. k, Cytokine profiles of conditioned medium collected from cultures of young (n = 7) and old (n = 7) ear fibroblasts at passage 33 (1 experiment). Box-and-whisker plot of log2-transformed fold change in MFI over median of young fibroblasts. Only the cytokines that exhibited a significant difference in expression levels in conditioned medium from young and old fibroblasts at passage 3 are shown. P values, one-tailed Wilcoxon rank-sum test with Benjamini–Hochberg correction. For a complete cytokine list and exact P values, see Supplementary Table 2r. Box plots as in a. Note that the experiments in fibroblasts at passage 3 and 33 were conducted independently, and therefore statistical comparisons were restricted to within experiments. However, a direct comparison between the levels of secreted factors at passage 3 to 33 revealed that the levels of most cytokines decrease upon passaging. l, Reprogramming efficiency, assessed by SSEA1 staining, of young (n = 14) and old (n = 24) ear fibroblast cultures at passage 3 (3 independent experiments), as log2-transformed fold change over the median of young mice. Each dot represents a fibroblast culture from one mouse. P value, Fligner–Killeen test to assess differences in variance between age groups. m, Reprogramming efficiency assessed by AP staining of young (3 months, n = 7), middle-aged (12–13 months, n = 7) and old (28–30 months, n = 8) chest fibroblast cultures at passage 3 (2 independent experiments), as log2-transformed fold change over the median of young mice. Dots as in l. P values, Fligner-Killeen test to assess differences in variance between age groups with Benjamini–Hochberg correction. n, Reprogramming efficiency of fibroblast cultures are mainly stereotypical to fibroblast cultures from an individual mouse. Correlation plot depicting the reprogramming efficiency (assessed by AP staining) of fibroblast cultures reprogrammed in two experiments (separated by more than one month), with data from experiment 1 on the x axis and data from experiment 2 on the y axis. Data shown are from young (3 months, n = 14), middle-aged (12 months, n = 6) and old (29 months, n = 18) mice. Dots as in l. P values, two-sided algorithm AS 89 in R. There was a positive correlation (Spearman rank correlation, ρ = 0.63, P = 2.1 × 10⁻⁵) between reprogramming efficiencies of fibroblast cultures from the same mouse. o, Correlation plot depicting the ability of young (n = 4) and old (n = 5) fibroblast cultures at passage 3 to reprogram into neurons (iN, assessed by PSA-NCAM) or to iPS cells (iPSC, assessed by AP) (1 experiment). Dots as in l. P values, two-sided algorithm AS 89 in R. There was a significant positive correlation (Spearman rank correlation, ρ = 0.84, P = 0.003) between these two features. For individual experiments in a, b, e, l-n, see Supplementary Table 7.
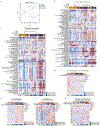
Extended Data Fig. 2 ∣
Extended Data Fig. 2 ∣. Old fibroblasts exhibit distinct transcriptomic, epigenomic and metabolomics profiles compared to young fibroblasts.
a, b, PCA of H3K4me3 (a) and H3K27me3 (b) peak intensities from young ear fibroblast cultures (3 months, n = 2), old cultures that reprogram well (good old, 29 months, n = 2) and old cultures that reprogram poorly (bad old, 29 months, n = 1) (1 experiment). Principal components (PCs) 1 and 2 are shown. c, PCA of metabolomes of young (n = 8), good old (n = 4) and bad old (n = 4) ear fibroblast cultures (1 experiment). Principal components 1 and 2 are shown. d, PCA of metabolomes of young (n = 8), good old (n = 4) and bad old (n = 4) ear fibroblast cultures (1 experiment). Principal components 1 and 3 are shown. e, Unsupervised hierarchical clustering of transcriptomes (RNA-seq) of young (n = 8), good old (n=5) and bad old (n = 5) ear fibroblast cultures (3 independent experiments). Hierarchical clustering was performed using correlation-based dissimilarity (Pearson’s) as distance measure and average for linkage analysis. The y axis indicates the similarity between samples. b-e, Mice were the same ages as in a. f-h, Unsupervised hierarchical clustering of H3K4me3 (f) and H3K27me3 (g) peaks and metabolomes (h) described in a, b and c, respectively. Hierarchical clustering was performed as in e. i, PCA of transcriptomes (RNA-seq) of good and bad old ear fibroblast cultures. Principal components 1 and 2 are shown. j, PCA of metabolomes of good old (n = 4) and bad old (n = 4) ear fibroblast cultures. Principal components 2 and 3 are shown. k, Selected GO terms enriched in the old transcriptomes (young, n = 8; old, n = 10), with corresponding FDR-adjusted P values (one-sided Fisher’s exact test with Benjamini–Hochberg correction). For a complete list, see Supplementary Table 2d. l, Heat map showing expression (VST-transformed read counts, scaled row-wise) of selected cytokine genes. The scale for expression fold changes is indicated on the left. m, Gene set enrichment analysis (GSEA) plot depicting the transcriptomes of young (n = 8) and old (n = 10) fibroblasts. Top, genes associated with fibroblast activation (see Supplementary Table 2f) are enriched in the old fibroblasts (P < 1.0 × 10⁻¹⁰, two-sided nominal P value). Bottom, heat map shows expression of fibroblast activation genes (VST-transformed read counts, scaled row-wise). The scale for expression fold changes is indicated on the left. n-q, Analysis of the epigenomic data as described in a, b. In line with the transcriptomic data, age-dependent changes in epigenomic landscape also revealed enrichment of pathways involved in fibroblast activation, such as cytokines, extracellular matrix components and contractility-related features. n, Left, heat map shows the H3K4me3 peaks within promoter regions that exhibit a significant difference in intensity with age, assessed by Diffbind. Peak intensity is shown as VST-transformed read counts, scaled row-wise. The scale for peak intensity fold changes is indicated on the left. Right, selected enriched KEGG pathways colour coded according to significance (one-sided Fisher’s exact test with Benjamini–Hochberg correction; black, FDR-adjusted P < 0.05; grey, FDR-adjusted P < 0.15). For a complete list of significant KEGG terms, see Supplementary Table 2h. o, Top Venn diagram depicts the overlap of bivalent domains within promoters regions of young and old fibroblasts. For details, see ‘Chromatin immunoprecipitation followed by sequencing and analysis of the epigenomic landscape’. Middle, pie charts show how the unique bivalent domains in young fibroblasts change in old fibroblasts (left pie chart) and vice versa (right pie chart). Bottom, selected enriched KEGG pathways colour coded according to significance. For a complete list of KEGG terms, see Supplementary Table 2l. p, Top, Venn diagram depicting the overlap of broad H3K4me3 domains within promoters regions of young and old fibroblasts. For details see ‘Chromatin immunoprecipitation followed by sequencing and analysis of the epigenomic landscape’). Bottom, selected enriched KEGG pathways colour coded according to significance. For a complete list of significant KEGG terms, see Supplementary Table 2j. q, The relationship between changes in H3K4me3 peak intensity (as described in a) and gene expression for H3K4me3 peaks that are significantly different between the age groups (as described in Fig. 2b). The analysis was restricted to H3K4me3 peaks that are within promoter regions, defined as the transcriptional start site ±2 kb. The y axis denotes the log2-transformed fold change in gene expression between young and old fibroblasts for the gene, and x axis denotes the log2-transformed fold change of H3K4me3 peak intensity assigned to the gene. Genes of interest are labelled. rt, Pathway analysis of all putatively identified metabolites that were significantly different between young and old fibroblasts (described in c), as well as the differentially expressed genes (described in Fig. 2b; FDR-adjusted P < 0.05, absolute fold change >1.5), using the MetaboAnalyst tool. Note that the MetaboAnalyst tool does not provide multiple-hypothesis-corrected P values (one-sided Fisher’s exact test). s, Box plots showing the log2-transformed signal intensities of selected metabolites in the arginine and proline pathway from the metabolic profiling of young and old fibroblasts cultures at passage 3 (as described in c), for which the identity was confirmed using commercially available standards. Box plots depict the median and interquartile range, with whiskers indicating minimum and maximum values. *P < 0.05, **P < 0.01; two-tailed Wilcoxon rank-sum test with q value correction; l-arginine, P = 0.069; l-ornithine, P = 0.690; l-glutamate, P = 0.055; creatine, P = 0.022; creatinine, P = 0.002; putrescine, P = 0.081; spermidine P = 0.094; spermine, P = 0.016. t, Schematic representation of the biological functions of key metabolites and genes in the arginine and proline metabolic pathway, and how they relate to regulation of inflammatory cytokines and extracellular matrix synthesis-. Abundance of putative metabolites (oval) and gene transcripts (squares) in old fibroblasts is colour coded (red, higher in old; blue, lower in old; grey, not significantly different or not detected). Epigenomic changes are indicated with black asterisks. u, Top, top 3 motifs found in promoters of differentially expressed genes between young and old fibroblasts described in Fig. 2b, using HOMER motif analysis. Bottom, top 10 putative upstream regulators identified by the IPA database that are differentially expressed between young and old fibroblasts (FDR-adjusted P < 0.05, absolute fold change >1.5). Heat map depicts log2-transformed fold change in expression (old/young) calculated using DESeq2. The transcription factor identified across both analyses (EBF2) is in red. *P < 0.05, **P < 0.01, ***P < 0.001; cumulative hypergeometric distribution (Homer motif analysis), activation z‐score in IPA (upstream regulator analysis). For a complete list of significant motifs and upstream regulators, and exact P values, see Supplementary Table 2n. v, Top, heat map of differentially expressed genes in a regression analysis from young to old healthy human primary fibroblasts (n = 13, FDR-adjusted P < 0.05). Expression is shown as VST-transformed read counts, scaled row-wise. The depicted KEGG pathways are FDR-adjusted P < 0.15 (one-sided Fisher’s exact test with Benjamini–Hochberg correction) (Supplementary Table 2o, p). Bottom, VST-transformed expression of EBF2 across human samples as a function of age (years). Each square represents transcripts from a patient. NB, newborn. w, Pathway enrichment analysis of KEGG pathways associated with enhanced (up) or reduced (down) reprogramming, comparing H3K4me3 peak intensities between the top (n = 1) and the bottom (n = 1) old reprogramming cultures in our datasets (see Supplementary Table 2a). All depicted KEGG pathways were significantly enriched (FDR-adjusted P < 0.05). *P < 0.05; two-sided nominal P value with Benjamini–Hochberg correction. For a complete list of KEGG terms and exact P values, see Supplementary Table 3f.
Extended Data Fig. 3 ∣
Extended Data Fig. 3 ∣. Reprogramming erases features of inflammageing and variability between mice.
al, To test whether transcriptomic and metabolomics features of inflammageing could be erased by reprogramming, iPS cell lines from young and old fibroblasts at passage 23 were profiled for their transcriptome (RNA-seq) and metabolome. a, All iPS cell lines (n = 11) cluster with previously established bona fide iPS cell lines (n = 3) and ES cells (n = 4). Unsupervised hierarchical clustering based on overall transcriptomes of the indicated cell types. The hierarchical clustering was performed using correlation-based dissimilarity (Pearson’s) as distance measure and average for linkage analysis. The y axis indicates the similarity between samples. b, PCA of whole transcriptomes from RNA-seq data of iPS cell lines derived from young (3 months, n = 5) and old (29 months, n = 6) mice at passage 23. Principal components (PCs) 1 and 2 are shown. c, Unsupervised hierarchical clustering of transcriptomes described in b. Hierarchical clustering was performed as in a. d, Strip plot illustrating the log2-transformed fold expression changes of all genes with age for fibroblasts (left; described in Fig. 2b) and iPS cells (right; described in b). Genes detected as significantly upregulated or downregulated (DESeq2, FDR-adjusted P < 0.05, absolute fold change >1.5) with age, are shown in blue and yellow, respectively (see Supplementary Table 2q). e, PCA of metabolomes of iPS cell lines derived from young (n = 5) and old (n = 8) mice at passage 23. Ages as in b. Untargeted metabolomics profiles were generated using ultra-high performance liquid chromatography-mass spectrometry. Principal components 1 and 2 are shown. f, Unsupervised hierarchical clustering of metabolomics profiles described in e. Hierarchical clustering was performed as in a. g, Strip plot illustrating the log2-transformed fold change in signal intensity of all metabolic features with age for fibroblasts (left; described in Extended Data Fig. 2c) and iPS cells (right; described in e). Metabolic features detected as significantly up or down (using a two-tailed Wilcoxon rank-sum test with q value correction) with age are shown in blue and yellow, respectively. h, i, PCA (h) and unsupervised clustering (i) of iPS cell lines derived from young (n = 5) and old (n = 6) mice at passage 23, based on solely the genes that were significantly differentially expressed between young and old at fibroblast level. Ages as in b. Principal components 1 and 2 are shown. Hierarchical clustering was performed as in a.jl, RT–qPCR of the indicated genes in fibroblasts cultures at passage 3 (j) and 33 (k), and iPS cell cultures at passage 23 (l). The genes shown represent the three major groups of features associated with fibroblast activation that change with age in fibroblasts. Box-and-whisker plot of log2-transformed fold change in MFI over median of young fibroblasts. Box plots depict the median and interquartile range, with whiskers indicating minimum and maximum values. Data are from young (n = 6) and old (n = 6) fibroblast cultures at passage 3, young (n = 5) and old (n = 6) fibroblast cultures at passage 33, young (n = 6) and old (n = 7) iPS cell cultures at passage 23. Ages as in b. *P < 0.05, **P < 0.01; one-tailed Wilcoxon rank-sum test with Benjamini–Hochberg correction. For j: Ccl7 (also known as Mcp3), P = 0.004; Ccl2 (also known as Mcp1), P = 0.004; Acvr2a (which encodes ACVR2α), P = 0.006; Ccl11 (also known as Eotaxin), P = 0.004; Pak6, P = 0.004; Thsb2, P = 0.004; Actn3, P = 0.006; Col1a1 (which encodes COL1α1), P = 0.004; Acta2 (which encodes αSMA), P = 0.004; Lama2, P = 0.004; Dmd, P = 0.008; F2r, P = 0.008. For k: Ccl7, P = 0.027; Ccl2, P = 0.027; Acvr2a, P = 0.027; Ccl11, P = 0.049; Pak6, P = 0.027; Thsb2, P = 0.026; Actn3, P = 0.026; Col1a1, P = 0.035; Acta2, P = 0.027; Lama2, P = 0.027; Dmd2, P = 0.027; F2r, P = 0.229. For l: Ccl7, P = 0.800; Ccl2, P = 0.800; Acvr2a, P = 0.800; Ccl11, P = 1.000; Pak6, P = 0.800; Thsb2, P = 1.000; Actn3, P = 0.800; Col1a1, P = 1.000; Acta2, P = 1.000; Lama2, P = 1.000; Dmd, P = 1.000; F2r, P = 1.000. Note that the experiments were conducted independently in fibroblasts at passage 3, 33 and iPS cells, and therefore the statistical comparisons indicated were restricted to each independent experiment. However, a comparison between the expression of secreted factors at passage 3 to 33 shows that expression of Ccl11, but not Ccl2 and Ccl7, significantly decreases upon passaging.
Extended Data Fig. 4 ∣
Extended Data Fig. 4 ∣. Correlation between the fibroblast activation signature and reprogramming efficiency in single-cell RNA-seq data.
a, Single-cell RNA-seq of young (n = 30 cells), good and bad old (n = 31 cells) fibroblast cultures. t-SNE was performed on the VST-transformed read counts of all detected genes (analysed using DESeq2). Each dot represents a single fibroblast transcriptome. b, PAGODA of single-cell RNA-seq data from young and old fibroblasts at passage 3 performed using raw expression counts and all KEGG pathways, the in vitro fibroblast ageing, the fibroblast activation and de novo gene sets. Hierarchical clustering is based on 97 significantly overdispersed gene sets and the 405 genes driving the significantly overdispersed gene sets. Top, heat map of single cells from young and old fibroblast cultures. Middle, heat map of the separation of cells based on their principal component scores for the significantly overdispersed gene sets. Top heat map, PAGODA clustering of cells. Maroon and blue colours indicate increased and decreased expression of the associated gene sets, respectively. c, PAGODA as described in Extended Data Fig. 4c. Top, heat map of single cells from young and old fibroblast cultures. Middle, heat map of separation of cells based on their principal component scores for the significantly overdispersed gene sets. Top heat map, PAGODA clustering of cells. Maroon and blue colours indicate increased and decreased expression of the associated gene sets, respectively. d, PAGODA as described in c. Middle, heat map of separation of cells based on their principal component scores for the in vitro fibroblast ageing signature. Bottom, heat map of the expression of the genes that are part of the in vitro fibroblast ageing signature, and decrease with age; expression is shown as VST-transformed read counts, scaled row-wise. The scale for expression fold changes is indicated on the right. The bottom heat map indicates the cells that originate from good and bad old cultures. e, PAGODA as described in c. Middle, heat map of separation of cells based on their principal component scores for the in vitro fibroblast ageing signature. Bottom, heat map of expression of the genes that are part of the in vitro fibroblast ageing signature, and increase with age; expression is shown as VST-transformed read counts, scaled row-wise. The scale for expression fold changes is indicated on the right. The bottom heat map indicates the cells that originate from good and bad old cultures. f, PAGODA as described in c. Middle, heat map of the separation of cells based on their principal component scores for the fibroblast activation signature. Bottom, heat map of the expression of the genes that are part of the fibroblast activation gene set; expression is shown as VST-transformed read counts, scaled row-wise. The scale for expression fold changes is indicated on the right. The bottom heat map indicates the cells that originate from good and bad old cultures. g, PAGODA as described in c. Middle, heat map of the separation of cells based on their principal component scores for the KEGG cytokine–cytokine receptor interaction gene set. The heat map shows expression of the top 30 overdispersed genes in the KEGG cytokine–cytokine receptor interaction pathway; expression is shown as VST-transformed read counts, scaled row-wise. The scale for expression fold changes is indicated on the right. The bottom heat map indicates the cells that originate from good and bad old cultures.
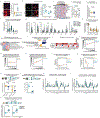
Extended Data Fig. 5 ∣
Extended Data Fig. 5 ∣. Old fibroblast cultures are enriched for activated (THY1+PDGFRα+) fibroblasts, which are intrinsically poor at reprogramming but facilitate reprogramming extrinsically via secretion of cytokines.
a, Left, representative immunofluorescence images of young and old fibroblasts at passage 3 stained for αSMA (which is encoded by the Acta2 gene). Right, quantification of the percentage of αSMA+ cells in young (3 months, n = 8) and old (29 months, n = 8) fibroblasts at passage 3 (1 experiment). Based on reprogramming efficiency, old cultures are shown as good old, bad old or old. Each dot represents cells from one mouse. Lines depict median. P value, two-tailed Wilcoxon rank-sum test. b, Left, representative immunofluorescence images of young and old fibroblasts at passage 3 incubated with EdU for 4 h, then stained for αSMA (red), EdU (green) and DAPI (blue). White arrows indicate an EdU-positive activated and a non-activated cell. Right, FACS quantification of the percentage of EdU-positive THY1PDGFRα+ (THY1) and THY1+PDGFRα+ (THY1+) cells in young (3 months, n = 5; 3 independent experiments) and old (29 months, n = 5; 1 experiment) cultures at passage 3. Dots and lines as in a. P values, two-tailed Wilcoxon rank-sum test. c, PAGODA of single-cell RNA-seq from young and old fibroblasts described in Extended Data Fig. 4c. Top heat map, PAGODA clustering of cells. Maroon and blue colours indicate increased and decreased expression of the associated gene sets, respectively. Middle heat map, expression of genes in the GO cellular senescence gene set, for which expression is shown as VST-transformed read counts, scaled row-wise. Bottom heat map, cells that originate from good and bad old cultures. The scale for expression fold changes is indicated on the right. d, RT–qPCR of p16Ink4a expression in cultures of THY1PDGFRα+ (THY1) and THY1+PDGFRα+ (THY1+) young and old cells at passages 4–6. Results are shown as fold change in expression over THY1PDGFRα+ cells. Data are from young (3 months, n = 5) and old (29 months, n = 5) cultures (6 independent experiments). One young and three old cultures were used in 2–3 independent experiments. In this case, an average of the measurements was determined. Dots and lines as in a. P values, two-tailed Wilcoxon signed-rank test. e, Percentage of SA-β-galactosidase-positive cells in young (3 months, n = 11) and old (28–29 months, n = 22) fibroblast cultures at passage 3 (3 independent experiments). log2-transformed fold change in SA-β-galactosidase-positive cells over median of young fibroblasts. Line indicates median. P values, two-tailed Wilcoxon ranked sum test. f, g, RT–qPCR of old THY1PDGFRα+ (THY1) and THY1+PDGFRα+ (THY1+) cells at passage 4–6 (3 independent experiments) untreated (f) (n = 6, 3 independent experiments) or treated with the indicated shRNA constructs for 72h (g) (n = 5, 4 independent experiments). Box-and-whisker plot of fold change in expression over THY1PDGFRα+ populations originating from the same culture (f) or over shLuciferase (shLuc) treated cells (g). Box plots depict the median and interquartile range, with whiskers indicating minimum and maximum values. *P < 0.06, one-tailed Wilcoxon signed-rank test with Benjamini–Hochberg correction. h, RT–qPCR on young (3 months, n = 5) fibroblasts after overexpression of Ebf2 for 48 h (2 independent experiments). Box-and-whisker plot of fold change in expression over cells treated with empty vector. Box plots as in f. *P < 0.06, one-tailed Wilcoxon signed-rank test with Benjamini–Hochberg correction. i, Heat map of significantly differentially expressed genes (determined by DESeq2) between freshly FACS-sorted THY1PDGFRα+Lin (THY1) and THY1+PDGFRα+Lin (THY1+) cells described in Fig. 3b and enriched KEGG pathways. Expression is shown as VST-transformed read counts, scaled row-wise. The scale for expression fold changes is indicated on the left. All depicted KEGG pathways were significantly enriched (one-sided Fisher’s exact test with Benjamini–Hochberg correction, FDR-adjusted P < 0.05). For a complete list of KEGG terms, see Supplementary Table 4e. j, Pathway enrichment analysis of KEGG pathways associated with ageing in dataset described in Fig. 3b. For a complete list of KEGG terms, see Supplementary Table 4g. **P = 0.01, ***P = 0.001; two-sided nominal P value with Benjamini–Hochberg correction. k, Top, ranked fold change (old/young) in levels of the indicated cytokines in plasma (see Extended Data Fig. 1a). Bottom, ranked fold change (old/young) in expression for the indicated cytokines in freshly FACS-sorted THY1PDGFRα+Lin (THY1) and THY1+PDGFRα+Lin (THY1+) cells from young and old ears. See ‘Cytokine profiling analysis on plasma and conditioned medium using Luminex multi-analyte’ for calculation of ranked fold changes. Gene expression related to wounded fibroblasts is from datasets described in Extended Data Fig. 7e-g. ln, Correlation between the proportion of THY1+PDGFRα+ (THY1+) fibroblasts in old cultures (29 months, n = 23) (l), young (3 months, n = 21) and bad old (29 months, n = 6) cultures (m), and young (3 months, n = 21) and good old (29 months, n = 6) cultures (n), and the reprogramming efficiency of the culture (3 independent experiments). Dots as in a. P values, two-sided algorithm AS 89 in R. The y axis denotes the fold change in the proportion of THY1+PDGFRα+ fibroblasts relative to the median of young mice, and x axis denotes the fold change in reprogramming efficiency of the culture relative to the median of young mice. o, p, Correlation between the proliferation rate (o) or the percentage of SA-β-galactosidase-positive cells (p) of a given fibroblast culture and reprogramming efficiency of the culture. Proliferation rate was determined by calculating the growth slope of young (3 months, n = 15), middle-aged (12 months, n = 10) and old (28–29 months, n = 27) ear fibroblast cultures at passage 3 (4 independent experiments). Senescence was assessed by SA-β-galactosidase staining of young (3 months, n = 11), middle-aged (12 months, n = 11) and old (28–29 months, n = 22) ear fibroblast cultures at passage 3 (3 independent experiments). Dots as in a. P values, two-sided algorithm AS 89 in R. The y axis denotes the fold change in the proliferation rate or percentage of SA-β-galactosidase-positive cells relative to the median of young mice, and x axis denotes the fold change in reprogramming efficiency of the culture relative to the median of young mice. q, Reprogramming efficiency of FACS-sorted young (3 months, n = 8) and old (29 months, n = 7) THY1PDGFRα+ (THY1) and THY1+PDGFRα+ (THY1+) fibroblasts at passages 4–6, assessed using AP staining (3 independent experiments). log2-transformed fold change in reprogramming efficiency of the cells relative to the median of young THY1PDGFRα+ fibroblasts. One old culture was used in two independent experiments. In this case, an average of the measurements was determined. Dots and lines as in a. P values, two-tailed Wilcoxon signed-rank test. r, Reprogramming efficiency of FACS-sorted young (3 months, n = 5) THY1PDGFRα+ (THY1) and THY1+PDGFRα+ (THY1+) fibroblasts at passages 4–6, assessed as in q (3 independent experiments). Reprogramming was induced using a non-lentiviral piggyBac transposon system. Results are shown as number of AP+ colonies. Dots and lines as in a. P values, one-tailed Wilcoxon rank-sum test. s, t, Cytokine profiles of conditioned medium collected from cultures of old (s) (29 months, n = 6, 3 independent experiments) and young (t) (3 months, n = 6, 2 independent experiments) THY1PDGFRα+ (THY1) and THY1+PDGFRα+ (THY1+) fibroblasts at passages 4–6. Comparisons were made between THY1PDGFRα+ and THY1+PDGFRα+ from the same original culture. Based on cytokines that are significantly different in conditioned medium from fibroblasts (Fig. 1b). Box-and-whisker plot of log2-transformed fold change in mean fluorescence intensity (MFI) over THY1PDGFRα+ fibroblasts. Box plots as in f. *P < 0.05, one-tailed Wilcoxon rank-sum test with Benjamini–Hochberg correction. Exact P values are in Supplementary Table 4h. u, Reprogramming efficiency, assessed as in q, of FACS-sorted young (3 months, n = 6) THY1PDGFRα+ (THY1) and THY1+PDGFRα+ (THY1+) fibroblasts at passages 4–6 treated with fresh conditioned medium daily starting from day 1 after infection (3 independent experiments). Conditioned medium was collected daily from the THY1PDGFRα+ or THY1+PDGFRα+ fibroblasts from the same original culture. log2-transformed fold change in reprogramming efficiency relative to the reprogramming efficiency of THY1PDGFRα+ fibroblasts treated with conditioned medium from THY1PDGFRα+ fibroblasts. One young culture was used in two independent experiments. In this case, an average of the measurements was determined. Dots and lines as in a. P values, two-tailed Wilcoxon signed-rank test. For individual experiments in b, dh, l_u and exact P values, see Supplementary Table 7.
Extended Data Fig. 6 ∣
Extended Data Fig. 6 ∣. Old fibroblasts secrete cytokines, including IL-6 and TNF, that induce inflammatory signalling pathways and modulate reprogramming efficiency.
a, Reprogramming efficiency, assessed using AP staining, of FACS-sorted young (3 months, n = 8) fibroblast cultures at passage 3 that were treated with conditioned medium from day 1 after infection (4 independent experiments). Conditioned medium was collected from young, good old or bad old fibroblast cultures. Results are shown as fold change in reprogramming efficiency relative to young fibroblasts treated with young conditioned medium. Each dot represents cells from one mouse. Lines depict median. P values, two-tailed Wilcoxon signed-rank test with Benjamini–Hochberg correction. b, Reprogramming efficiency, assessed as in a, of bad old (left, n = 7) or good old (right, n = 6) fibroblast cultures at passage 3 treated with conditioned medium from day 1 after infection (5 independent experiments). Conditioned medium was collected from good or bad old fibroblast cultures. Results are shown as fold change in reprogramming efficiency over old fibroblasts treated with bad old conditioned medium. Dots and lines as in a. P values, two-tailed Wilcoxon signed-rank test. c, Different representation of the data from Fig. 3e; each diamond represents the fold difference in reprogramming efficiency between a unique pair of good and bad old cultures (n = 8 pairs of good and bad old cultures, 5 independent experiments). Dots and lines as in a. P values, two-tailed Wilcoxon signed-rank test with Benjamini–Hochberg correction. d, Western blot analysis of young fibroblasts at passage 3 treated with the indicated cytokines at the concentration of 10 ng ml−1 for 30 min. Representative of 3 independent experiments. e, Reprogramming efficiency, assessed as in a, of young fibroblast cultures (3 months, n = 10) at passage 3 (3 independent experiments). Cells were treated with the indicated cytokines from day 1 after infection at the concentration of 10 ng ml−1. Results are shown as log2-transformed fold change in reprogramming efficiency over untreated cells. Dots and lines as in a. P values, two-tailed Wilcoxon signed-rank test with Benjamini–Hochberg correction. f, Reprogramming efficiency, assessed by SSEA1 staining, of young fibroblast cultures (3 months, n = 4) at passage 3 treated with the indicated cytokines from day 1 after infection at the concentration of 10 ng ml−1 (2 independent experiments). Results are shown as log2-transformed fold change in reprogramming efficiency over untreated cells. Dots and lines as in a. P values, one-tailed Wilcoxon signed-rank test with Benjamini–Hochberg correction. g, Reprogramming efficiency, assessed as in a, of old fibroblast cultures (29 months, n = 7) at passage 3 treated with the indicated cytokines from day 1 after infection at the concentration of 10 ng ml−1 (3 independent experiments). Results are shown as log2-transformed fold change in the reprogramming efficiency over untreated cells. Note that 1 old culture was used in 2 independent experiments. In this case, an average of the resultant measurements was determined. Dots and lines as in a. P values, two-tailed Wilcoxon signed-rank test with Benjamini–Hochberg correction. h, Reprogramming efficiency, assessed as in f, of old fibroblast cultures (29 months, n = 3) at passage 3 treated with the indicated cytokines from day 1 after infection at the concentration of 10 ng ml−1 (2 independent experiments). Results are shown as log2-transformed fold change in the reprogramming efficiency over untreated cells. Dots and lines as in a. P values, one-tailed Wilcoxon signed-rank test with Benjamini–Hochberg correction. i, Western blot analysis using the indicated antibodies of young fibroblasts at passage 3 treated with the indicated cytokines (10 ng ml−1) and blocking antibodies (8 μg ml−1) for 30 min. Cytokines were pretreated with either IgG or their corresponding blocking antibodies for 1 h before treatment. Representative of 2 independent experiments. j, Western blot analysis of old fibroblasts at passage 3 treated with the indicated cytokines at a concentration of 10 ng ml−1 for 30 min. k, Reprogramming efficiency, assessed as in a, of young fibroblast cultures (3 months, n = 4) at passage 3 treated with the indicated conditions from day 1 after infection (2 independent experiments). Cytokines (10 ng ml−1) were pretreated with either IgG or their corresponding blocking antibody (8 μg ml−1) for 1 h before treatment. Results are shown as log2-transformed fold change in reprogramming efficiency over untreated cells. Dots and lines as in a. P values, one-tailed Wilcoxon signed-rank test with Benjamini–Hochberg correction. l, m, Reprogramming efficiency, assessed as in a, of young fibroblast cultures (3 months, n = 6) at passage 3 treated with the indicated conditions from day 1 after infection (3 independent experiments). Conditioned medium was pretreated for 1 h with the indicated blocking antibody before administration. Results are shown as log2-transformed fold change relative to conditioned medium treated with IgG. Dots and lines as in a. P values, one-tailed Wilcoxon signed-rank test with Benjamini–Hochberg correction. n, Different representation of the data from Fig. 3f; each diamond represents the fold difference in reprogramming efficiency between a unique pair of good and bad old cultures (n = 6 pairs of good and bad old cultures, 4 independent experiments). Line marks median. P values, two-tailed Wilcoxon signed-rank test with Benjamini–Hochberg correction. o, Heat map showing the Spearman rank correlation coefficients between the levels of individual cytokines (top row), the ratio of the levels of TNF to other cytokines (middle row), the ratio of the levels of IL-6 to other cytokines (bottom row), and reprogramming efficiency in young (3 months, n = 19) and old (29 months, n = 18) cells (2 independent experiments). *P < 0.05, **P < 0.01; two-sided algorithm AS 89 in R; TNF:IL-6, P = 0.040; IL-6:IFNγ, P = 0.010; IL-6:IL-18, P = 0.040; IL-6:TNF, P = 0.040; IL-6:IL-10, P = 0.040; IL-6:CSF2, P = 0.005. The remaining P values can be found in Supplementary Table 7. p, q, The levels of IL-6 (p) or TNF (q) are not correlated with reprogramming efficiency. The y axis denotes the fold change in the levels of the indicated cytokine relative to the median of young mice and the x axis denotes the fold change in reprogramming efficiency of the culture relative to the median of young mice. Data are from young (3 months, n = 19) and old (29 months, n = 18) mice (2 independent experiments). P values, two-sided algorithm AS 89 in R. For individual experiments in ac, eh, kq, see Supplementary Table 7.
Extended Data Fig. 7 ∣
Extended Data Fig. 7 ∣. Ageing is associated with an increased variability in wound healing between old mice, and old fibroblasts in wounds are distinct from primary fibroblasts derived from healthy ear skin.
a, Example images of ear wounds of young mice, fast-healing old mice (fast old) and slow-healing old mice (slow old) at the indicated time points (2 independent experiments). Ink circles depict initial size of wounds. b, Ear wound healing curve from young (3–4 months, n = 26) and old (24–26 months, n = 28) mice (2 independent experiments). Full thickness wounds were induced on the dorsal side of both ears (see ‘Wounding and wound healing experiments’ for details) and the size of the wounds was assessed by imaging ear wounds every second day for 20 days. For each mouse, the average of both ear wounds was calculated. Graph depicts the average percentage of wound area remaining at the indicated time points. Data are mean ± s.e.m. c, Ear wound healing curves of the five fastest and the five slowest healing young and old mice. Graph depicts the average average of wound area remaining at the indicated time points. Data are mean ± s.e.m. d, FACS analysis as described in Fig. 3b to assess the percentage of THY1+PDGFRα+Lin (THY1+) cells in ears of young and old mice during basal conditions and at 7 days after induction of wounds. Results are shown as a percentage of THY1+PDGFRα+Lin cells over PDGFRα+Lin cells. Data shown are from young basal (3–4 months, n = 9 replicates, each with 2–3 mice), young wounded (3–4 months, n = 8 replicates, each with 2–3 mice), old basal (24–26 months, n = 10 replicates, each with 2–3 mice) and old wounded (24–26 months, n = 8 replicates, each with 2–3 mice) (3 independent experiments). Each dot represents a replicate with cells pooled from 2–3 mice. Line depicts median percentage. P values, two-tailed Wilcoxon rank-sum test. Note that the percentage of THY1+PDGFRα+Lin in young and old basal conditions is also presented in Fig. 3b. e, Pathway enrichment analysis based on population RNA-seq of young wounded (3–4 months, n = 6 replicates, each with 2–3 mice) and old wounded (24–26 months, n = 6 replicates, each with 2–3 mice) THY1PDGFRα+Lin and THY1+PDGFRα+Lin cells in vivo (1 experiment). The graph shows a subset of KEGG pathways that were found to be significantly enriched (FDR-adjusted P < 0.05). For a complete list of differentially expressed genes and pathways, with corresponding specific P values, see Supplementary Table 5c, d. **P < 0.01, ***P < 0.001; two-sided nominal P value with Benjamini–Hochberg correction. f, Comparison between the transcriptomic changes that occur in fibroblasts with age in vitro (as described in Fig. 2b) and in vivo (as described in Fig. 3b), as well as changes that occur upon wounding in young and old ears (as described in d). The heat map depicts the enrichment of the KEGG pathways that are present in at least two of the conditions described. For the complete list of differentially expressed genes and significant KEGG terms with specific P values, see Supplementary Tables 2b, c, 4f, g, 5a, b. The scale for enrichment is indicated on the left. g, Heat map of expression of a subset of cytokine genes from population RNA-seq of fibroblasts from young and old ears during basal and wounded conditions. Expression is shown as VST-transformed read counts, scaled row-wise. The scale for expression fold changes is indicated on the left. Basal and wound signatures refer to the average expression of the genes that are significantly downregulated or upregulated with wounding, respectively, in this dataset.
Extended Data Fig. 8 ∣
Extended Data Fig. 8 ∣. Single-cell RNA-seq analysis offibroblasts in wounds from young and old mice and single-cell RNA-seq analysis of entire wounds from old slow- and fast-healing mice at day 7.
a, Quality control for 10x Genomics single-cell RNA-seq data of freshly isolated PDGFRα+Lin (CD45CD31EpCAMTER119TIE2) cells from wounds of young mice (3–4 months, cells pooled from n = 10 mice) or old mice (24–26 months, cells pooled from n = 10 mice), 7 days after induction of wounds. Number of unique genes (left), percentage of mitochondrial genes (middle) and number of unique molecular identifiers (UMIs, right) for each cell are shown, separated by age group. Each dot represents a single cell. b, Seurat analysis of all live high-quality PDGFRα+Lin cells described in a (3,036 cells in total) identified two main clusters of cells. Heat map depicts the expression of the top 10 marker genes for each significant cell cluster identified by Seurat, which are defined as the genes that are most specific to each population. The cell subpopulation identity assigned to each cluster is indicated below each column. c, PAGODA of the single-cell RNA-seq dataset described in a. PAGODA was performed using all KEGG pathways, and the in vitro fibroblast ageing and the fibroblast activation signatures (see Supplementary Table 2b, f). Top, heat map of single cells from wounds from young and old mice and cell clusters identified by Seurat and PAGODA analyses. Bottom, heat map of the separation of cells based on their principal component scores for the significantly overdispersed gene sets. Top heat map, PAGODA clustering of cells. Maroon and blue colours indicate increased and decreased expression of the associated gene sets, respectively. Bottom, log2-transformed fold change in the subpopulations between young and old wounds at day 7. d, PAGODA as described in c. Middle, heat map of the separation of cells based on their principal component scores for the fibroblast activation signature. Bottom, heat map of the expression of the genes that are part of the fibroblast activation signature (see Supplementary Table 2f); expression is shown as log-transformed and normalized gene expression values as calculated by Seurat and scaled row-wise. The scale for expression fold changes is indicated on the right. e, PAGODA as described in c. Middle, heat map of the separation of cells based on their principal component scores for the KEGG cytokine–cytokine receptor interaction gene set. Bottom, heat map of the expression of the genes that are part of the KEGG cytokine–cytokine receptor interaction; expression is shown as log-transformed and normalized gene expression values as calculated by Seurat and scaled row-wise. The scale for expression fold changes is indicated on the right. f, PAGODA as described in c. Middle, heat map of the separation of cells based on their principal component scores for the KEGG TNF signalling pathway gene set. Bottom, heat map of the expression of the genes that are part of the KEGG TNF signalling pathway; expression is shown as log-transformed and normalized gene expression values as calculated by Seurat and scaled row-wise. The scale for expression fold changes is indicated on the right. g, Representative images of the ears of the two slow-healing and two fast-healing old mice used for single-cell RNA-seq at day 7 after wounding (1 experiment). h, Ear wound healing curves of the ears of the two slow-healing and two fast-healing old mice used for single-cell RNA-seq. The percentage of the wound area that was not healed at the day 6 after induction of the wounds is indicated in parentheses. i, Quality control for 10x Genomics single-cell RNA-seq data of freshly isolated live cells from the ear wounds of slow-healing (n = 2) and fast-healing old mice (n = 2), 7 days after induction of wounds. Number of genes (left), percentage of mitochondrial genes (middle) and number of unique molecular identifier (right) for each cell are shown, separated by mouse. Each dot represents a single cell. j, Seurat analysis of all live high-quality cells described in i (10,797 cells in total) identified seven main clusters of cells. Heat map depicts the expression of the top 10 marker genes for each significant cell cluster identified by Seurat, which are defined as the genes that are most specific to each population. The cell subpopulation identity assigned to each cluster is indicated below each column.
Extended Data Fig. 9 ∣
Extended Data Fig. 9 ∣. Seurat and PAGODA single-cell RNA-seq analyses of fibroblasts identify distinct fibroblast subpopulations associated with fast- or slow-healing trajectories.
ag, Analysis of cells identified as fibroblasts from the single-cell RNA-seq dataset described in Fig. 4c. a, t-SNE clustering of cells identified as fibroblasts (2,678 cells in total) coloured by significant clusters identified using a k-nearest neighbour (KNN) graph-based algorithm as implemented by Seurat, or by mouse. b, log2-transformed fold change in the number of cells in each of the three subpopulations identified by Seurat between fast-healing old wounds and slow-healing old wounds. c, Seurat analysis of fibroblasts (2,678 cells in total) identified three main clusters. Heat map depicts the expression of the top 10 marker genes for each significant cell cluster identified by Seurat, which are defined as the genes that are most specific to each population. The identity of each cell subpopulation assigned to each cluster is indicated below each column. d, PAGODA of fibroblasts. PAGODA was performed using raw expression counts and all KEGG pathways, and the in vitro fibroblast ageing and the fibroblast activation signatures (see Supplementary Table 2b, f). Top, heat map of single cells from wounds of old mice and cell clusters identified by Seurat and PAGODA analyses. Bottom, heat map of the separation of cells based on their principal component scores for the significantly overdispersed gene sets. Top heat map, PAGODA clustering of cells. Maroon and blue colours indicate increased and decreased expression of the associated gene sets, respectively. e, PAGODA as described in d. Bottom, heat map of the expression of the genes that are part of the fibroblast activation signature (see Supplementary Table 2f); expression is shown as log-transformed and normalized gene expression values as calculated by Seurat and scaled row-wise. The scale for expression fold changes is indicated on the right. f, Expression of the genes that are part of the KEGG cytokine–cytokine receptor interaction gene set as in e. g, Expression of the genes that are part of the KEGG TNF signalling pathway as in e. hl, Analysis of the combined single-cell RNA-seq datasets described in Fig. 4b, c. h, Seurat analysis of combined datasets clusters fibroblasts from both datasets together. t-SNE clustering of all live, high-quality cells from both datasets (13,833 cells in total) coloured by significant clusters identified using a KNN graph-based algorithm as implemented by Seurat, or by mouse. i, t-SNE clustering of combined fibroblasts from the datasets described in Fig. 4b (PDGFRα+Lin) and Fig. 4c. Combined fibroblasts (5,716 cells in total) are coloured by significant clusters identified using a KNN graph-based algorithm as implemented by Seurat, or by mouse. j, Seurat analysis of combined fibroblasts (5,716 cells in total) identified three main subpopulations. Heat map depicts the expression of the top 10 marker genes for each significant subpopulation identified by Seurat, which are defined as the genes that are most specific to each population. The cell subpopulation identity assigned to each cluster is indicated below each column. k, PAGODA of combined fibroblasts. PAGODA was performed using Seurat normalized counts and all KEGG pathways, the in vitro fibroblast ageing, the fibroblast activation signatures (see Supplementary Table 2b, f). Top, heat map of single fibroblasts from wounds of young and old mice or wounds from old fast- or slow-healing mice, and cell clusters identified by Seurat and PAGODA analyses. Bottom, heat map of separation of cells based on their principal component scores for a subset of the top significantly overdispersed gene sets. Top heat map, PAGODA clustering of cells. Maroon and blue colours indicate increased and decreased expression of the associated gene sets, respectively. Note that fibroblast subpopulation B did not contain cells from old/young in the combined analysis. This is probably owing to the fact that this subpopulation of fibroblast has some markers of the haematopoietic lineage, and is probably depleted in the PFGDRα+Lin FACS-sorting scheme used to isolate fibroblasts from the wounds of young and old mice. l, log2-transformed fold change in each of the three combined fibroblast subpopulations identified by PAGODA between wounds of old fast- and slow-healing mice, or between wounds from young and old mice, at day 7.
Extended Data Fig. 10 ∣
Extended Data Fig. 10 ∣. FACS schematic for in vitro and in vivo fibroblast analysis and sorting and full western blot membranes.
a, FACS schematic for analysis and sorting of THY1PDGFRα+ and THY1+PDGFRα+ cells in young and old cultures at passage 3. Gates shown on each plot are indicated above the plot. Marker and fluorophore are shown on each axis. FMO, fluorescence minus one. b, FACS schematic for analysis and sorting of live THY1PDGFRα+Lin and THY1+PDGFRα+Lin cells from young and old fresh tissues (ears), used for population RNA-seq and single-cell RNA-seq analyses. Gates shown on each plot are indicated above the plot. Marker and fluorophore are shown on each axis. c, Full western blot membranes from Extended Data Fig. 6d, i, j. Boxes indicate the cropped area.
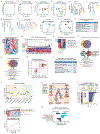
Fig. 1 ∣
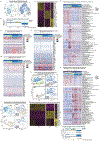
Fig. 1 ∣. Primary fibroblasts from old mice secrete inflammatory cytokines and show increased variability in reprogramming efficiency between mice.
a, Experimental schematic. Young mice, 3 months old; old mice, 28–29 months old. OSKM, OCT4, SOX2, KLF4 and MYC. b, Top, age-dependent changes in cytokine levels in plasma and conditioned medium from fibroblasts or iPS cells (Extended Data Fig. 1a, g, h). ND, not detected. Bottom, cytokine profiles of conditioned medium from primary cultures (passage 3) of ear fibroblasts from young (3 months, n = 24) and old (29 months, n = 24) male mice (3 independent experiments). Box-and-whisker plots of log2-transformed fold change in mean fluorescence intensity (MFI) compared to the median of young fibroblasts. Box plots depict median and interquartile range, with whiskers indicating minimum and maximum values. **P < 0.01, ***P < 0.001; two-tailed Wilcoxon rank-sum test with Benjamini–Hochberg correction. Exact P values can be found in Supplementary Table 1b. c, Reprogramming efficiency assessed by alkaline phosphatase (AP) staining of cultures of ear fibroblasts obtained from young (3 months, n = 44), middle-aged (12 months, n = 11) and old (28–29 months, n = 53) mice (7 independent experiments). The log2-transformed fold change over the median of young mice is shown. Each dot represents a fibroblast culture from one mouse. P values, Fligner–Killeen test to assess differences in variance between age groups with Benjamini–Hochberg correction.
Fig. 2 ∣
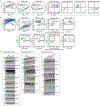
Fig. 2 ∣. Old fibroblast cultures exhibit a signature of an inflammatory activated state, which is associated with variability in reprogramming efficiency.
a, Multi-omics characterization of fibroblast cultures. ChIP–seq, chromatin immunoprecipitation followed by sequencing; UHPLC–MS, ultra-high performance liquid chromatography–tandem mass spectrometry. b, Principal component (PC) analysis of transcriptomes cultures of ear fibroblasts from young (3 months, n = 8) and old (29 months, n = 10) (left) or only old (right) mice (3 independent experiments). Old cultures were either good (high reprogramming efficiency) or bad (low reprogramming efficiency) (Supplementary Table 2a). c, Heat map of significantly differentially expressed genes (determined by DESeq2) between young and old fibroblasts described in b and enriched Kyoto Encyclopedia of Genes and Genomes (KEGG) pathways. Pathways are colour coded according to significance (one-sided Fisher’s exact test with Benjamini–Hochberg correction; black, false-discovery rate (FDR)-adjusted P < 0.05; grey, FDR-adjusted P < 0.15; Supplementary Table 2b, c). ECM, extracellular matrix. d, Summary of the multi-omics profiling of young and old fibroblast cultures (Extended Data Fig. 2). e, Pathway enrichment analysis of KEGG pathways associated with good or bad reprogramming efficiency. Overlapping significant (FDR-adjusted P < 0.05) KEGG pathways identified in a regression analysis from bad to good reprogramming efficiencies (n = 18) and in a separate analysis comparing the five highest and five lowest reprogramming efficiency cultures (exact P values can be found in Supplementary Table 3b, d). *P < 0.05, ***P < 0.001; two-sided nominal P value with Benjamini–Hochberg correction. f, PAGODA of single-cell RNA-seq from young (n = 30 cells), good and bad old (n = 31 cells) fibroblasts. Top heat maps, PAGODA clustering of cells. For cell PC score, maroon and blue colours indicate increased and decreased expression of the associated gene sets, respectively. Middle heat map, expression of specific cytokine genes (Extended Data Fig. 4g). Bottom heat map, single cells from good and bad old fibroblast cultures. Gene expression is shown as VST-transformed (variance stabilizing transformation, implemented in DESeq2) read counts scaled row-wise.
Fig. 3 ∣
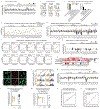
Fig. 3 ∣. Age-associated increase in activated fibroblasts and the cytokines that they secrete drive part of the variability in reprogramming between mice.
a, Top, PAGODA clustering of single-cell RNA-seq data from young and old fibroblasts as in Fig. 2f, showing Thy1 expression. Bottom, proportion of THY1+PDGFRα+ fibroblasts in fibroblast cultures of young (3 months, n = 21) and old (29 months, n = 23) mice measured by FACS (3 independent experiments). Fold changes were calculated relative to the median of young mice. P value, two-tailed Wilcoxon rank-sum test. Each dot represents a culture from one mouse. Lines depict median. b, Left, Percentage of THY1+PDGFRα+Lin out of all PDGFRα+Lin fibroblasts isolated from ears of young mice (3–4 months, n = 9 replicates, each with 2–3 mice) and old mice (24–26 months, n = 10 replicates, each with 2–3 mice) analysed by FACS (3 independent experiments). P value as in a. Each dot represents a replicate, with cells pooled from 2–3 mice. Lines depict median. Right, heat map of the expression of specific cytokine genes from population RNA-seq of fibroblasts. VST-transformed read counts are shown scaled row-wise. Young sig. and old sig. indicate the average expression of genes that are significantly downregulated and upregulated with age, respectively. c, Spearman’s correlation between the proportion of THY1+PDGFRα+ (THY1+) fibroblasts in a given culture (quantified by FACS) and the reprogramming efficiency (assessed as in Fig. 1c) of that culture (ages as in a; young, n = 21; old, n = 23; 3 independent experiments). Fold changes relative to the median of young mice. P values, two-sided algorithm AS 89 in R. Each dot represents a culture from one mouse, d, Reprogramming efficiency (RE) of FACS-sorted old THY1+PDGFRα+ (THY1+) and THY1PDGFRα+ (THY1) fibroblasts treated daily with conditioned medium (CM) from THY1PDGFRα+ or THY1+PDGFRα+ fibroblasts from the same original culture. log2-transformed fold change relative to THY1PDGFRα+ fibroblasts treated with conditioned medium from THY1PDGFRα+ fibroblasts (n = 5 old mice, 4 independent experiments). P values, two-tailed Wilcoxon signed-rank test. Each dot represents a culture from one mouse. Lines depict median, e, Reprogramming efficiency of pairs of good old and bad old fibroblast cultures treated with their own conditioned medium (self conditioned medium) or conditioned medium from the other group (swapped conditioned medium). log2-transformed fold change relative to bad old self conditioned medium. n = 8 pairs of good and old bad cultures (5 independent experiments). P values, two-tailed Wilcoxon signed-rank test with Benjamini–Hochberg correction. Each dot represents a culture from one mouse. Lines depict median. f, Reprogramming efficiency of pairs of good old and bad old fibroblast cultures treated with their own conditioned medium, which was pretreated with blocking antibodies. log2-transformed fold change in reprogramming efficiency relative to bad old conditioned medium treated with IgG antibodies. n = 6 pairs of good old and bad old cultures (4 independent experiments). P values, two-tailed Wilcoxon signed-rank test with Benjamini–Hochberg correction. Each dot represents a culture from one mouse. Lines depict median. g, Spearman’s correlation between conditioned medium and the ratio of IL-6 and TNF levels in the conditioned medium (young, n = 19; old, n = 18; ages as in a; 2 independent experiments). Fold change relative to the median of young mice. P values, two-sided algorithm AS 89 in R. Each dot represents a culture from one mouse. h, Model for the increased variability in cellular reprogramming between mice in vitro.
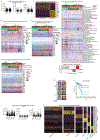
Fig. 4 ∣
Fig. 4 ∣. Wound healing rate is variable between old mice and correlates with fibroblast subpopulations with distinct cytokine signatures.
a, Ear wound healing assays in young (3–4 months, n = 26) and old (24–26 months, n = 28) mice (2 independent experiments). Left, ear wound healing curves from young mice and the five fastest- and five slowest-healing old mice. Percentage of wound area that remains on the indicated day (mean ± s.d.) Right, day of ear wound closure in young and old mice. Each dot represents one mouse. Line marks median. P values, Fligner–Killeen test to assess difference in variance between age groups. b, Single-cell RNA-seq of FACS-sorted PDGFRα+Lin cells from the ear wounds of young mice (3–4 months, cells pooled from n = 10 mice) or old mice (24–26 months, cells pooled from n = 10 mice), 7 days after induction of wounds. Left, t-distributed stochastic neighbour embedding (t-SNE) clustering of cells (3,036 total; 1,592 young, 1,444 old) coloured by Seurat clusters or age. Right, log2-transformed fold change in the subpopulations between wounds of young and old mice. c, Single-cell RNA-seq of live cells from entire wounds of old mice (24 months) with fast-healing (n = 2) and slow-healing (n = 2) trajectories, 7 days after induction of wounds. t-SNE clustering of cells (n = 10,797 total), coloured by Seurat clusters or mouse (slow old 1, n = 3,761; slow old 2, n = 2,127; fast old 1, n = 2,533; fast old 2, n = 2,376). Bottom, log2-transformed fold change in the cell types between wounds from fast-healing compared to slow-healing old mice. d, PAGODA clustering of cells (n = 2,678 total; slow old 1, n = 1,087; slow old 2, n = 551; fast old 1, n = 441; fast old 2, n = 599) identified as fibroblasts in c. Top heat map, single cells from wounds from old mice with fast- and slow-healing trajectories. Bottom heat map, separation of cells based on principal component scores for a subset of the top significantly overdispersed gene sets. For cell PC score, maroon and blue colours indicate generally increased and decreased expression of the associated gene sets, respectively. log2-transformed and normalized gene expression values calculated by Seurat and scaled row-wise. Bottom left, log2-normalized expression values of relevant genes. Each dot represents a single cell. Line marks median. Bottom right, log2-tranformed fold change in the number of cells in each of the three fibroblast subpopulations identified by PAGODA.

Comment in

Similar articles

Cited by

References

    1. Franceschi C & Campisi J Chronic inflammation (inflammaging) and its potential contribution to age-associated diseases. J. Gerontol. A Biol. Sci. Med. Sci 69, S4–S9 (2014). - PubMed
    1. Eming SA, Martin P & Tomic-Canic M Wound repair and regeneration: mechanisms, signaling, and translation. Sci. Transl. Med 6, 265sr6 (2014). - PMC - PubMed
    1. Lynch MD & Watt FM Fibroblast heterogeneity: implications for human disease. J. Clin. Invest. 128, 26–35 (2018). - PMC - PubMed
    1. Ocampo A, Reddy P & Belmonte JCI Anti-aging strategies based on cellular reprogramming. Trends Mol. Med 22, 725–738 (2016). - PubMed
    1. Chaleckis R, Murakami I, Takada J, Kondoh H & Yanagida M Individual variability in human blood metabolites identifies age-related differences. Proc. Natl Acad. Sci. USA 113, 4252–4259 (2016). - PMC - PubMed

MeSH terms