. 2019 Dec 5;4(23):e132826.
doi: 10.1172/jci.insight.132826.

Mitophagy-dependent macrophage reprogramming protects against kidney fibrosis

Affiliations

Mitophagy-dependent macrophage reprogramming protects against kidney fibrosis

Divya Bhatia et al. JCI Insight. .

Abstract

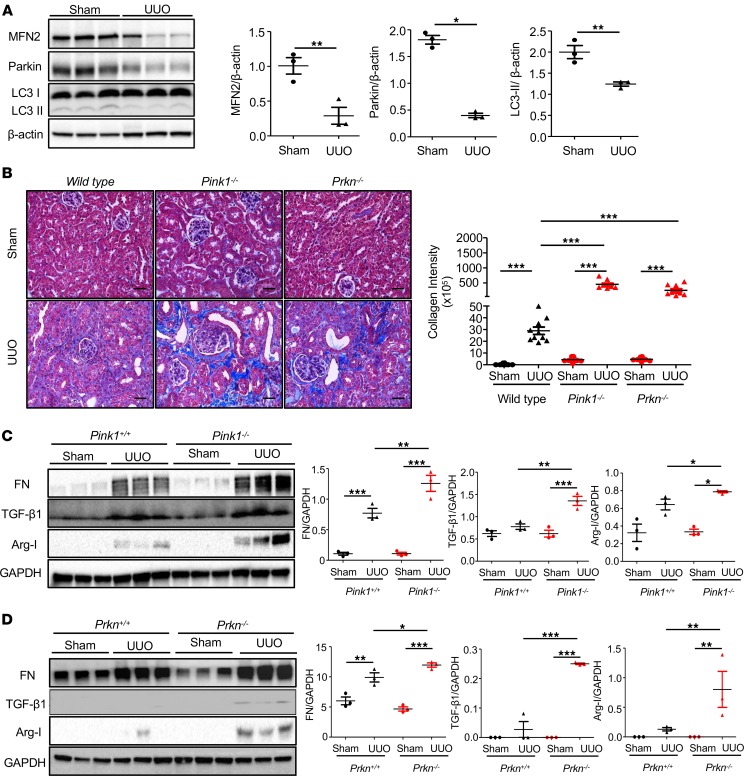
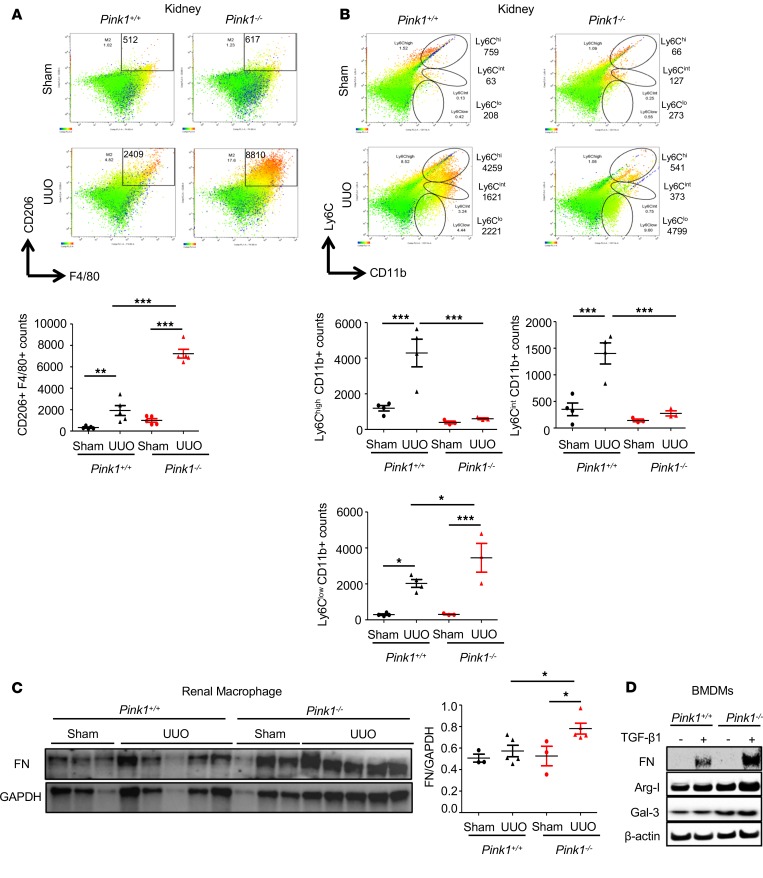
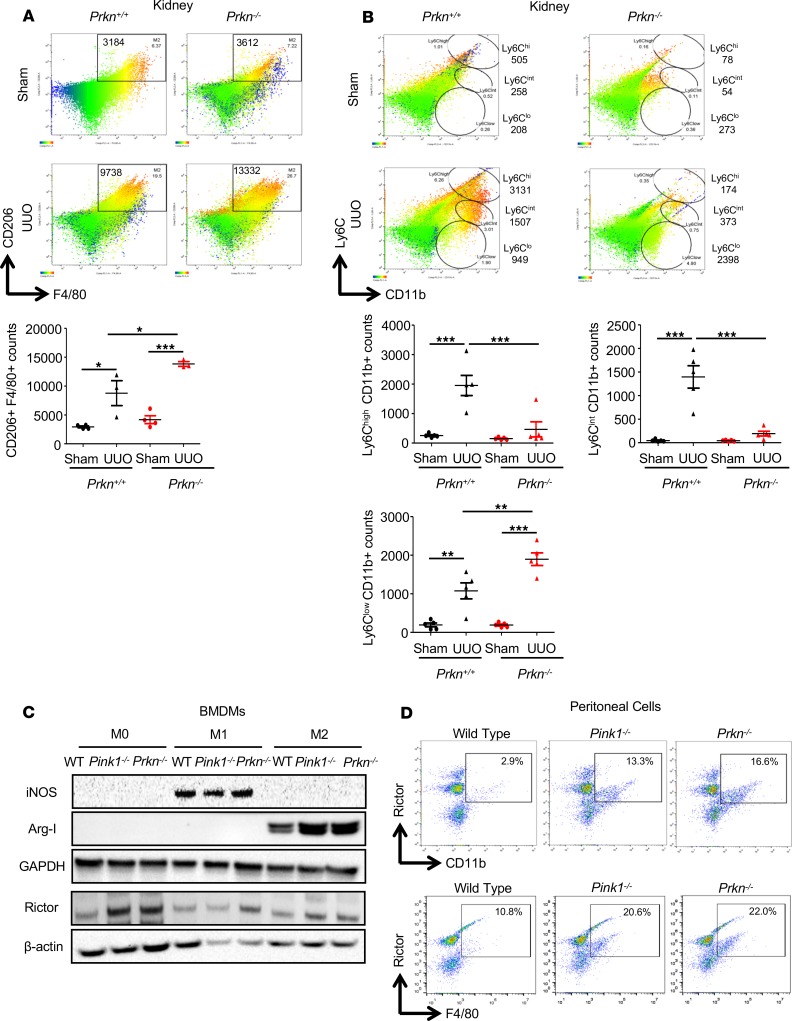
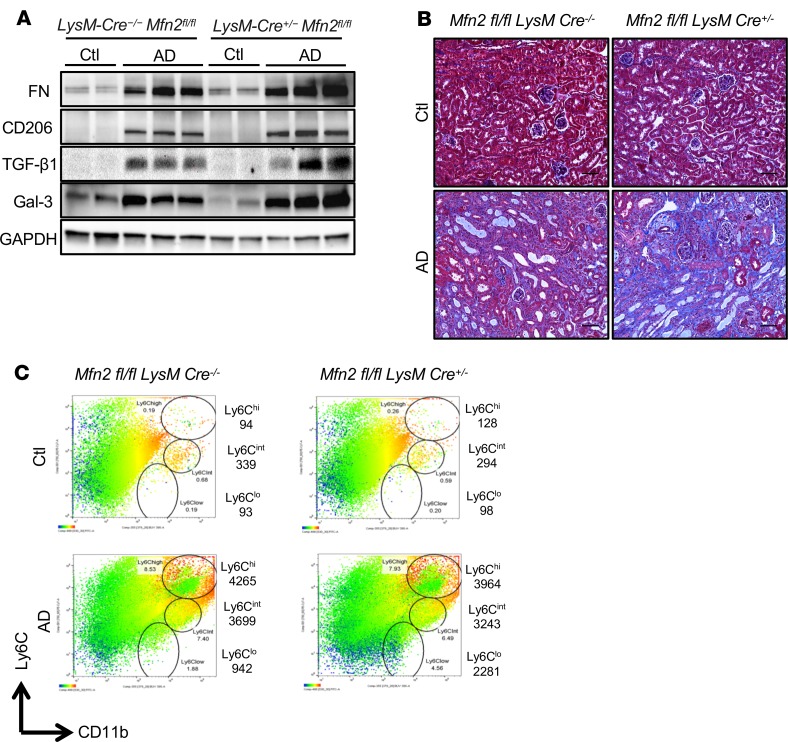
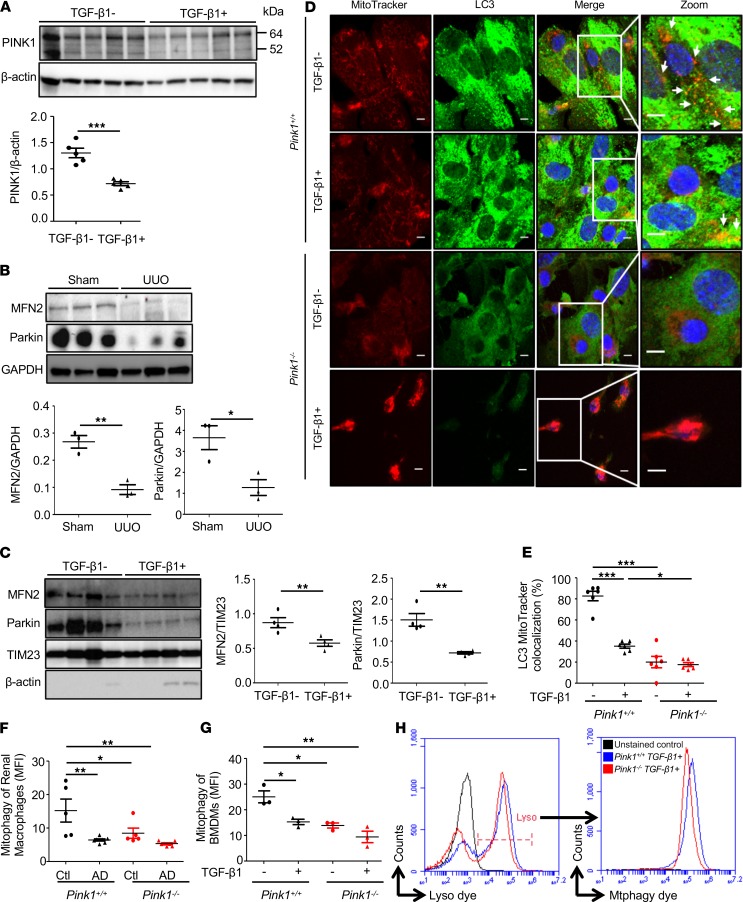
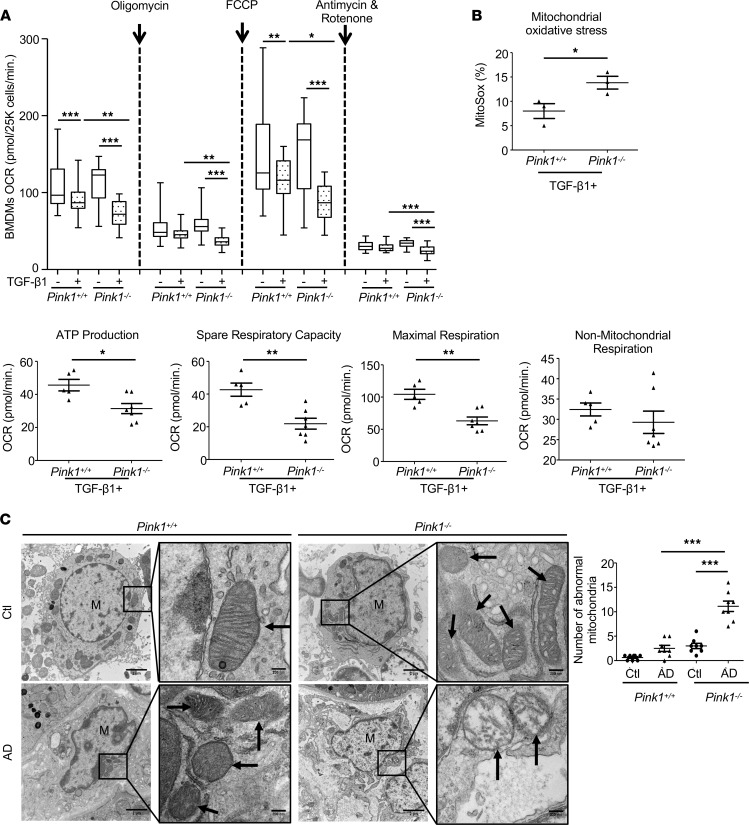
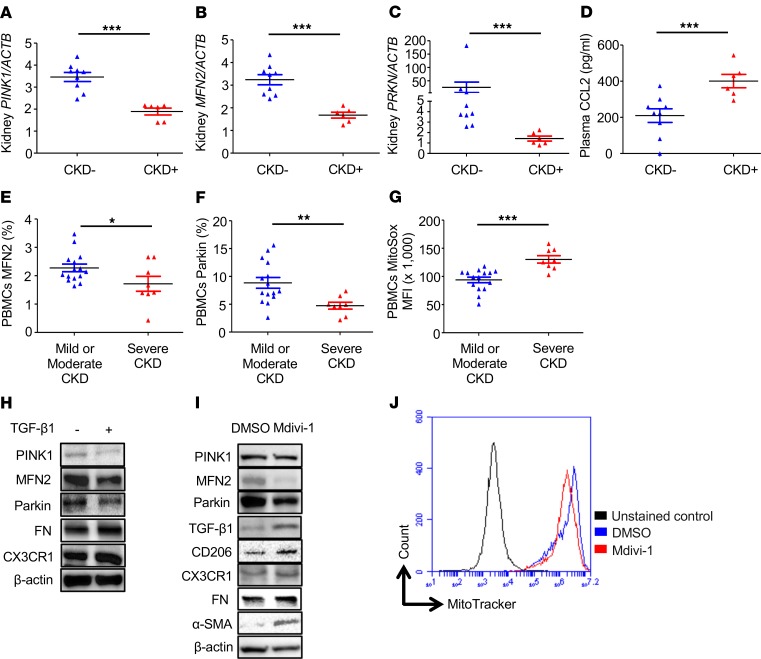
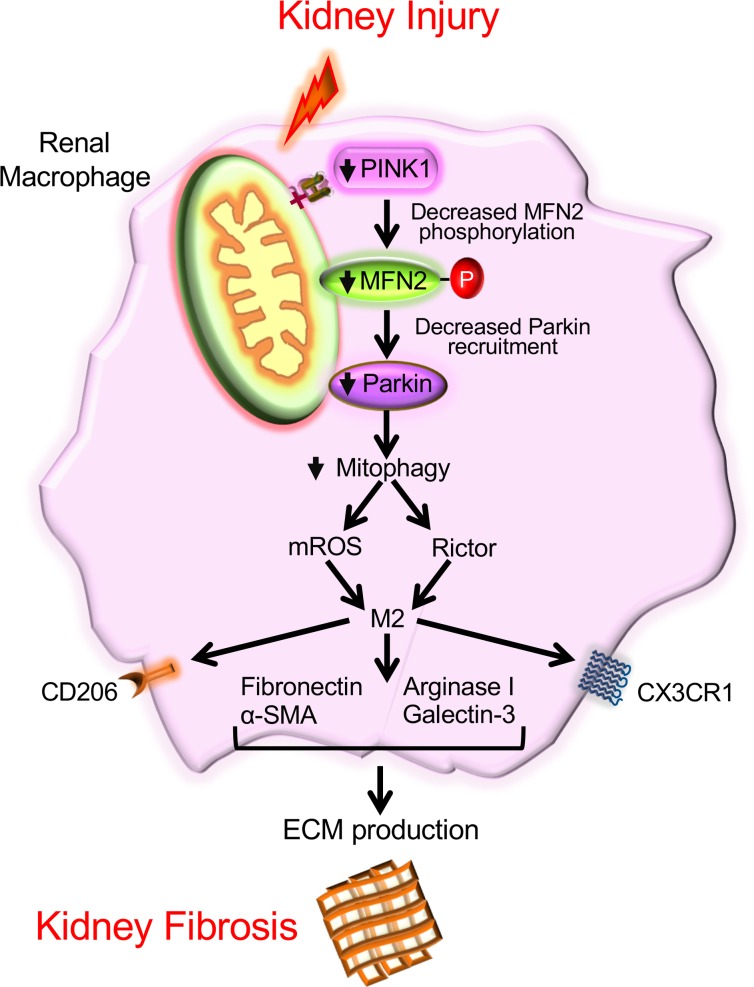
Mitophagy, by maintaining mitochondrial quality control, plays a key role in maintaining kidney function and is impaired in pathologic states. Macrophages are well known for their pathogenic role in kidney fibrosis. Here, we report that PINK1/Parkin-mediated mitophagy in macrophages is compromised in experimental and human kidney fibrosis. We demonstrate downregulation of mitophagy regulators mitofusin-2 (MFN2) and Parkin downstream of PINK1 in kidney fibrosis. Loss of either Pink1 or Prkn promoted renal extracellular matrix accumulation and frequency of profibrotic/M2 macrophages. Pink1-/- or Prkn-/- BM-derived macrophages (BMDMs) showed enhanced expression of rictor. Mitochondria from TGF-β1-treated Pink1-/- BMDMs exhibited increased superoxide levels, along with reduced respiration and ATP production. In addition, mitophagy in macrophages involves PINK1-mediated phosphorylation of downstream MFN2, MFN2-facilitated recruitment of Parkin to damaged mitochondria, and macrophage-specific deletion of Mfn2 aggravates kidney fibrosis. Moreover, mitophagy regulators were downregulated in human CKD kidney and TGF-β1-treated human renal macrophages, whereas Mdivi1 treatment suppressed mitophagy mediators and promoted fibrotic response. Taken together, our study is the first to our knowledge to demonstrate that macrophage mitophagy plays a protective role against kidney fibrosis via regulating the PINK1/MFN2/Parkin-mediated pathway.

Keywords: Fibrosis; Macrophages; Mitochondria; Nephrology.


Conflict of interest statement

Conflict of interest: The spouse of MEC is a cofounder and shareholder and serves on the Scientific Advisory Board of Proterris Inc. AMKC is a cofounder and stockholder and serves on the Scientific Advisory Board for Proterris, which develops therapeutic uses for carbon monoxide. AMKC also has a use patent on (no. 7,678,390) carbon monoxide.

Figures

Figure 1
Figure 1. Mitophagy-related proteins are downregulated in experimental kidney fibrosis, and loss of PINK1 or Parkin promotes kidney fibrosis.
(A) Western blot and densitometry analysis for expression of Mitofusin 2 (MFN2), Parkin, and microtubule‑associated protein light chain 3 (LC3) normalized to β-actin in kidney tissue lysates from WT mice 7 days after sham or UUO surgery. Data are mean ± SEM representative of 3 independent experiments (n = 3 per group) and analyzed by Student’s unpaired 2-tailed t test. (B) Representative Masson’s trichrome–stained kidney tissue sections (×40 magnification) from WT, Pink1–/–, and Prkn–/– mice 7 days after sham (n = 3 per group) or UUO (n = 5 per group) surgery. Ten areas from random fields per experimental group were analyzed and quantitated using ImageJ. Data are mean ± SEM, compared using 1-way ANOVA. Scale bars: 200 μm. (C and D) Western blot and densitometry analysis for the expression of fibronectin (FN), TGF-β1, and arginase I (Arg-I) normalized to GAPDH in kidney tissue lysates from Pink1+/+ and Pink1–/– (C), as well as Prkn+/+ and Prkn–/– (D), mice 7 days after sham or UUO surgery. Data are mean ± SEM representative of 3 independent experiments (n = 3 per group) and analyzed by 1-way ANOVA. *P < 0.05, **P < 0.01, ***P < 0.001.
Figure 2
Figure 2. PINK1-deficient renal macrophages display higher profibrotic response.
(A) Representative flow cytometric plots and analysis showing the numbers of CD206+F4/80+ cells in the kidney from Pink1+/+ and Pink1–/– mice 7 days after sham or UUO surgery (n = 5 per group). (B) Representative flow cytometric data showing the counts of Ly6Chi, Ly6Cint, and Ly6Clo CD11b+ populations in the kidney from Pink1+/+ (n = 4 per group) and Pink1–/– (n = 3 per group) mice 7 days after sham or UUO surgery. (C) Densitometry analysis and Western blot for fibronectin (FN) normalized to GAPDH in Pink1+/+ and Pink1–/– renal macrophages isolated 7 days after sham (n = 3 per group) or UUO (n = 5 per group) surgery. (D) Western blot for fibronectin (FN), arginase (Arg-I), galectin-3 (Gal-3), and β-actin in Pink1+/+ or Pink1–/– BM-derived macrophages (BMDMs) cultured in the absence (–) or presence (+) of TGF-β1 (5 ng/mL) for 24 hours. The data are representative of 3 independent experiments. Data are mean ± SEM. *P < 0.05, **P < 0.01, ***P < 0.001 analyzed by 1-way ANOVA.
Figure 3
Figure 3. Loss of Parkin increases profibrotic macrophages during kidney fibrosis.
(A) Flow cytometric data showing the numbers of CD206+F4/80+ cells in the kidney from Prkn+/+ and Prkn–/– mice 7 days after sham (n = 4 per group) or UUO surgery (n = 3 per group). (B) Frequencies of Ly6Chi, Ly6Cint, and Ly6Clo CD11b+ populations in the kidney from Prkn+/+ and Prkn–/– mice 7 days after sham (n = 5 per group) or UUO (n = 5 per group) surgery analyzed by flow cytometry. (C) Western blot for inducible nitric oxide synthase (iNOS), Arg-I, rictor, and GAPDH on M0, M1, or M2 WT, Pink1–/–, or Prkn–/– BMDMs. The data are representative of 3 independent experiments. (D) Flow cytometry data showing the expression of rictor on CD11b+ (upper panels) or F4/80+ (lower panels) populations in the cells isolated from peritoneal cavity. The data are representative of 3 independent experiments and are mean ± SEM. *P < 0.05, **P < 0.01, ***P < 0.001 analyzed by 1-way ANOVA.
Figure 4
Figure 4. Myeloid-specific loss of MFN2 promotes kidney fibrosis.
(A) Western blot for the expression of fibronectin (FN), CD206, TGF-β1, galectin-3 (Gal-3), and GAPDH in kidney tissue lysates from LysM-Cre–/– Mfn2fl/fl and LysM-Cre+/– Mfn2fl/fl mice fed with control (Ctl) or adenine (AD) diet for 28 days. (B) Representative Masson’s trichrome–stained kidney tissue sections (×20 magnification) from LysM-Cre–/– Mfn2fl/fl and LysM-Cre+/– Mfn2fl/fl mice fed with Ctl or AD for 28 days. Scale bars: 200 μm. (C) Representative flow cytometric data showing the counts of Ly6Chi, Ly6Cint, and Ly6Clo CD11b+ populations in the kidney from LysM-Cre–/– Mfn2fl/fl and LysM-Cre+/– Mfn2fl/fl mice fed with Ctl or AD for 28 days. n = 2 (Ctl) or n = 3 (AD) samples per group.
Figure 5
Figure 5. Macrophage PINK1-mediated mitophagy is suppressed during fibrotic conditions.
(A) Western blot and densitometry analysis for PINK1 expression normalized to β-actin in THP-1–derived human macrophages cultured in the absence (–) or presence (+) of TGF-β1 (5 ng/mL) for 48 hours (n = 5 per group). (B) Western blot and densitometry analysis for MFN2 and Parkin normalized to GAPDH in renal macrophages isolated from WT mice 7 days after sham or UUO surgery (n = 3 per group). (C) Western blot and densitometry analysis for MFN2 and Parkin normalized to TIM23 in mitochondrial lysates from BMDMs (n = 4 per group) cultured in the absence (–) or presence (+) of TGF-β1 (5 ng/mL) for 48 hours. β-Actin (a cytosolic marker) was used to confirm the purity of mitochondrial fractions. (D and E) Representative confocal microscopy images (D) and quantification of mitochondria colocalized with LC3 (E). Pink1+/+ and Pink1–/– BMDMs cultured in absence or presence of TGF-β1 were analyzed using MitoTracker (red) dye, anti-LC3 (green), and Hoechst (blue) dye. White arrows indicate colocalization of LC3 with mitochondria. Over 100 cells from 6 random fields per experimental group, each in triplicate, were analyzed using ImageJ. Scale bar: 10 mm. (F) Mitophagy assessment in Pink1+/+ and Pink1–/– F4/80+ renal macrophages from mice fed with control (Ctl, n = 5 per group) or adenine (AD, n = 7 per group) diet for 28 days and stained with MitoTracker and LysoTracker dyes using flow cytometry. (G) Mitophagy assessment in Pink1+/+ and Pink1–/– BMDMs (n = 3 per group) cultured in the absence or presence of TGF-β1 (5 ng/mL) for 48 hours using flow cytometry. (H) Representative histograms for the detection of mitophagy showing the lyso dye–labeled positive lysosomes gated for Mtphagy dye–stained mitochondria. Data are mean ± SEM representative of 3 independent experiments and analyzed by Student’s unpaired 2-tailed t test (A, B, and C) or 1-way ANOVA (E, F, and G). *P < 0.05. **P < 0.01, ***P < 0.001.
Figure 6
Figure 6. PINK1 mediates phosphorylation of MFN2 and MFN2 facilitates Parkin recruitment to the macrophage mitochondria.
(A) THP-1–derived human macrophages transfected with Pink1 siRNA or nontargeting (NT) control siRNA, cultured in the absence (–) or presence (+) of TGF-β1 (5 ng/mL) for 48 hours. Western blot for PINK1 (full length, 64 kDa; cleaved, 52 kDa) and phosphorylated MFN2 Serine-442 (86 kDa). (B) Mitophagy measured in LysM-Cre–/– Mfn2fl/fl (n = 3 per group) and LysM-Cre+/– Mfn2fl/fl BMDMs (n = 5 per group) cultured in the absence (–) or presence (+) of TGF-β1 (5 ng/mL) for 48 hours (B). (C) Representative histograms for the assessment of mitophagy showing the Lyso dye–positive events, gated for Mtphagy dye–stained mitochondria. The mean fluorescence intensity (MFI) of Mtphagy dye–stained mitochondria colocalized with Lyso dye–labeled lysosomes measured using flow cytometry. (D) Western blot for Parkin and TOM20 in peritoneal macrophages isolated from LysM-Cre–/– Mfn2fl/fl and LysM-Cre+/– Mfn2fl/fl cultured in the presence of DMSO (vehicle control) or FCCP (5 μM/mL) for 2 hours. Data are mean ± SEM and representative of 2 independent experiments. *P < 0.05, ***P < 0.001 analyzed by 1-way ANOVA.
Figure 7
Figure 7. PINK1 mediates macrophage mitochondrial respiration during kidney fibrosis.
(A) Pink1+/+ and Pink1–/– BMDMs were cultured in the absence (–, n = 5 per group) or presence (+, n = 5 per group) of TGF-β1 (5 ng/mL) for 24 hours. Box-and-whisker plots displaying the first and the third quartiles, with the line within the box indicating the median value (upper panel). Oxygen consumption rate (OCR) under basal conditions followed by the sequential measurements after addition of oligomycin, FCCP, rotenone, or antimycin A were determined using Mito Stress test. Dot plots show mean ± SEM. (B) Frequency of mitochondrial-derived superoxide detected in Pink1+/+ and Pink1–/– TGF-β1–treated BMDMs (n = 3 per group) using MitoSox staining by flow cytometry. (C) Representative transmission electron microscopy (TEM) images displaying renal macrophages (labeled as M; ×12,000 magnification; scale bars: 2 μm) and their mitochondria (pointed by arrow, ×80,000 magnification; scale bars: 200 nm) in Pink1+/+ and Pink1–/– mice after 28 days of control (Ctl) or adenine (AD) diet. Abnormal mitochondria counted from 4 (Ctl) or 7 (AD) renal macrophages from n = 3 mice per group. Data are mean ± SEM. *P < 0.05. **P < 0.01, ***P < 0.001 analyzed by 1-way ANOVA (A, upper panel, and C) or Student’s unpaired 2-tailed t test (A, lower panels, and B).
Figure 8
Figure 8. Mitophagy is compromised in patients with CKD and in TGF-β1–treated human renal macrophages.
(AC) Relative mRNA expression levels of PINK1 (A), MFN2 (B), and PRKN (C) normalized with β-actin (ACTB) were determined by TaqMan qPCR in kidney biopsy from patients with CKD (CKD+, n = 6) and patients without CKD (CKD–, n = 9) and analyzed using Mann-Whitney U test. (D) Plasma CCL2 levels in patients with (CKD+, n = 6) or without CKD (CKD–, n = 9) were determined by ELISA and analyzed using Mann-Whitney U test. (EG) Frequency of MFN2 (E) and Parkin (F) and median fluorescence intensity (MFI) of MitoSox dye (G) in peripheral blood mononuclear cells (PBMCs) from patients with severe CKD (n = 8) vs. mild or moderate CKD (n = 15) were determined by flow cytometry and analyzed using student’s unpaired 2-tailed t test. (H) Western blot for the expression of PINK1, MFN2, Parkin, fibronectin (FN), CX3CR1, and β-actin in human primary renal macrophages cultured in the absence (–) or presence (+) of TGF-β1 (5 ng/mL) for 24 hours. (I) Western blot for the expression of PINK1, MFN2, Parkin, TGF-β1, CD206, CX3CR1, FN, α-SMA, and β-actin in human primary renal macrophages cultured in the presence of DMSO (vehicle control) or Mdivi-1 (50 μM) for 3 hours. (J) Mitochondrial membrane potential in human primary renal macrophages treated with DMSO (vehicle control) or Mdivi-1 (50 μM) for 3 hours detected by staining with MitoTracker dye through flow cytometry. The histogram was gated from forward scatter (FSC) vs. side scatter (SSC) parent population. Data are mean ± SEM, *P < 0.05, **P < 0.01, ***P < 0.001.
Figure 9
Figure 9. Proposed mechanism of regulation of macrophage-derived fibrotic response by mitophagy.
Kidney injury by suppressing the expression of mitophagy regulators (PINK1, MFN2, and Parkin) contributes to mitochondrial dysfunction in renal macrophages. The deficiency of PINK1 causes a reduction in the mitofusin-2 (MFN2) phosphorylation at Serine-442. The loss of MFN2 results in lower recruitment of Parkin to the mitochondria and defective mitophagy in macrophages. The failure of mitophagy causes accumulation of abnormal mitochondria, increase in mROS production, and expression of rictor in macrophages. mROS and rictor both promote the differentiation of macrophages toward profibrotic/M2 phenotype. The increase in the frequency of profibrotic/M2 macrophages results in higher extracellular matrix (ECM) production and progression of kidney fibrosis.

Similar articles

Cited by

References

    1. Lee SY, Kim SI, Choi ME. Therapeutic targets for treating fibrotic kidney diseases. Transl Res. 2015;165(4):512–530. doi: 10.1016/j.trsl.2014.07.010. - DOI - PMC - PubMed
    1. Nikolic-Paterson DJ, Wang S, Lan HY. Macrophages promote renal fibrosis through direct and indirect mechanisms. Kidney Int Suppl (2011) 2014;4(1):34–38. doi: 10.1038/kisup.2014.7. - DOI - PMC - PubMed
    1. Lee S, et al. Distinct macrophage phenotypes contribute to kidney injury and repair. J Am Soc Nephrol. 2011;22(2):317–326. doi: 10.1681/ASN.2009060615. - DOI - PMC - PubMed
    1. Peng X, Zhang J, Xiao Z, Dong Y, Du J. CX3CL1-CX3CR1 Interaction Increases the Population of Ly6C(-)CX3CR1(hi) Macrophages Contributing to Unilateral Ureteral Obstruction-Induced Fibrosis. J Immunol. 2015;195(6):2797–2805. doi: 10.4049/jimmunol.1403209. - DOI - PubMed
    1. Lin SL, Castaño AP, Nowlin BT, Lupher ML, Duffield JS. Bone marrow Ly6Chigh monocytes are selectively recruited to injured kidney and differentiate into functionally distinct populations. J Immunol. 2009;183(10):6733–6743. doi: 10.4049/jimmunol.0901473. - DOI - PubMed

Publication types

MeSH terms