

Methylation and gene expression differences between reproductive and sterile bumblebee workers
- PMID: 31636941
- PMCID: PMC6791180
- DOI: 10.1002/evl3.129
Methylation and gene expression differences between reproductive and sterile bumblebee workers
Abstract
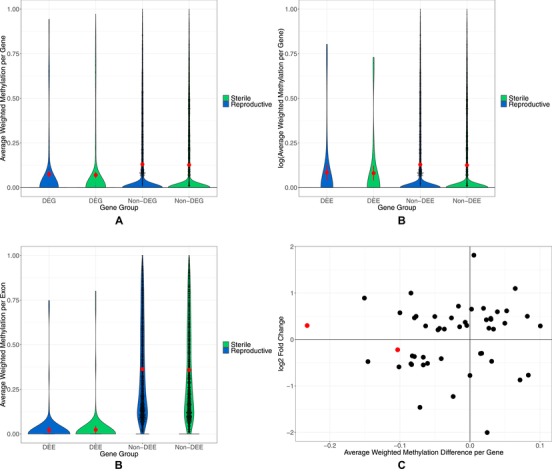
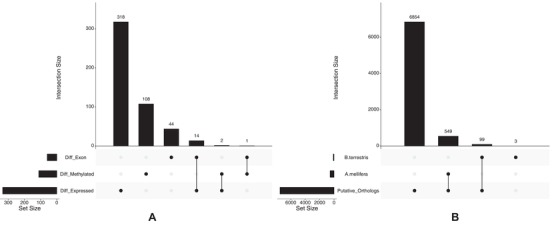
Phenotypic plasticity is the production of multiple phenotypes from a single genome and is notably observed in social insects. Multiple epigenetic mechanisms have been associated with social insect plasticity, with DNA methylation being explored to the greatest extent. DNA methylation is thought to play a role in caste determination in Apis mellifera, and other social insects, but there is limited knowledge on its role in other bee species. In this study, we analyzed whole genome bisulfite sequencing and RNA-seq data sets from head tissue of reproductive and sterile castes of the eusocial bumblebee Bombus terrestris. We found that genome-wide methylation in B. terrestris is similar to other holometabolous insects and does not differ between reproductive castes. We did, however, find differentially methylated genes between castes, which are enriched for multiple biological processes including reproduction. However, we found no relationship between differential methylation and differential gene expression or differential exon usage between castes. Our results also indicate high intercolony variation in methylation. These findings suggest that methylation is associated with caste differences but may serve an alternate function, other than direct caste determination in this species. This study provides the first insights into the nature of a bumblebee caste-specific methylome as well as its interaction with gene expression and caste-specific alternative splicing, providing greater understanding of the role of methylation in phenotypic plasticity within social bee species. Future experimental work is needed to determine the function of methylation and other epigenetic mechanisms in insects.
Keywords: Bombus; bumblebee; expression; hymenoptera; methylation.
© 2019 The Author(s). Evolution Letters published by Wiley Periodicals, Inc. on behalf of Society for the Study of Evolution (SSE) and European Society for Evolutionary Biology (ESEB).
Figures

Similar articles
-
Independent variations in genome-wide expression, alternative splicing, and DNA methylation in brain tissues among castes of the buff-tailed bumblebee, Bombus terrestris.J Genet Genomics. 2021 Aug 20;48(8):681-694. doi: 10.1016/j.jgg.2021.04.008. Epub 2021 May 25. J Genet Genomics. 2021. PMID: 34315685
-
DNA methylation is associated with codon degeneracy in a species of bumblebee.Heredity (Edinb). 2023 Apr;130(4):188-195. doi: 10.1038/s41437-023-00591-z. Epub 2023 Jan 19. Heredity (Edinb). 2023. PMID: 36658299 Free PMC article.
-
Gene expression during larval caste determination and differentiation in intermediately eusocial bumblebees, and a comparative analysis with advanced eusocial honeybees.Mol Ecol. 2021 Feb;30(3):718-735. doi: 10.1111/mec.15752. Epub 2021 Jan 7. Mol Ecol. 2021. PMID: 33238067 Free PMC article.
-
(Epi)Genetic Mechanisms Underlying the Evolutionary Success of Eusocial Insects.Insects. 2021 May 27;12(6):498. doi: 10.3390/insects12060498. Insects. 2021. PMID: 34071806 Free PMC article. Review.
-
The role of epigenetics, particularly DNA methylation, in the evolution of caste in insect societies.Philos Trans R Soc Lond B Biol Sci. 2021 Jun 7;376(1826):20200115. doi: 10.1098/rstb.2020.0115. Epub 2021 Apr 19. Philos Trans R Soc Lond B Biol Sci. 2021. PMID: 33866805 Free PMC article. Review.
Cited by
-
Phenotypic Plasticity: What Has DNA Methylation Got to Do with It?Insects. 2022 Jan 19;13(2):110. doi: 10.3390/insects13020110. Insects. 2022. PMID: 35206684 Free PMC article. Review.
-
The effect of DNA methylation on bumblebee colony development.BMC Genomics. 2021 Jan 22;22(1):73. doi: 10.1186/s12864-021-07371-1. BMC Genomics. 2021. PMID: 33482723 Free PMC article.
-
Exploring changes in social spider DNA methylation profiles in all cytosine contexts following infection.Heredity (Edinb). 2024 Dec;133(6):410-417. doi: 10.1038/s41437-024-00724-y. Epub 2024 Sep 12. Heredity (Edinb). 2024. PMID: 39266675 Free PMC article.
-
Changes in gene body methylation do not correlate with changes in gene expression in Anthozoa or Hexapoda.BMC Genomics. 2022 Mar 25;23(1):234. doi: 10.1186/s12864-022-08474-z. BMC Genomics. 2022. PMID: 35337260 Free PMC article.
-
Complex regulatory role of DNA methylation in caste- and age-specific expression of a termite.Open Biol. 2022 Jul;12(7):220047. doi: 10.1098/rsob.220047. Epub 2022 Jul 6. Open Biol. 2022. PMID: 35857972 Free PMC article.
References
-
- Alaux, C. , Jaisson P., and Hefetz A.. 2006. Regulation of worker reproduction in bumblebees (Bombus terrestris): Workers eavesdrop on a queen signal. Behav. Ecol. Sociobiol. 60:439–446.
