. 2019 Oct 18;10(1):4739.
doi: 10.1038/s41467-019-12732-2.

Resident memory T cells are a cellular reservoir for HIV in the cervical mucosa

Affiliations

Resident memory T cells are a cellular reservoir for HIV in the cervical mucosa

Jon Cantero-Pérez et al. Nat Commun. .

Abstract

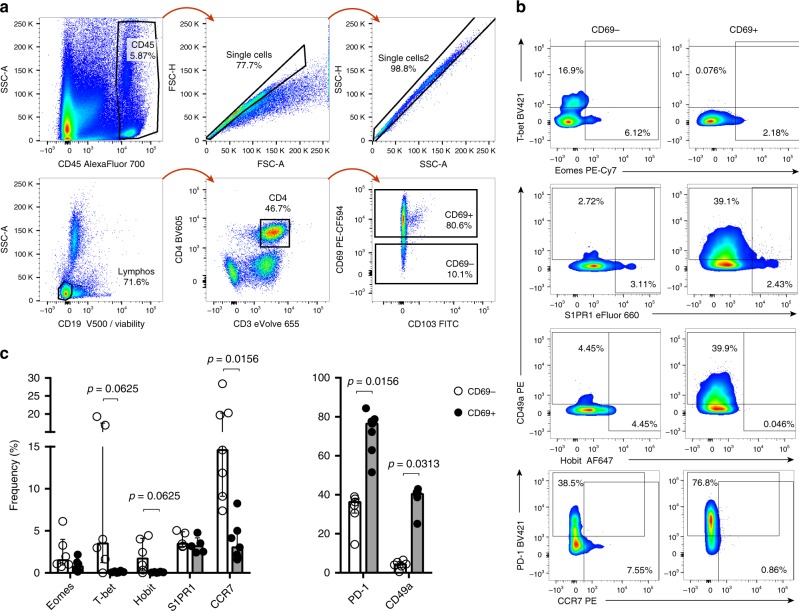
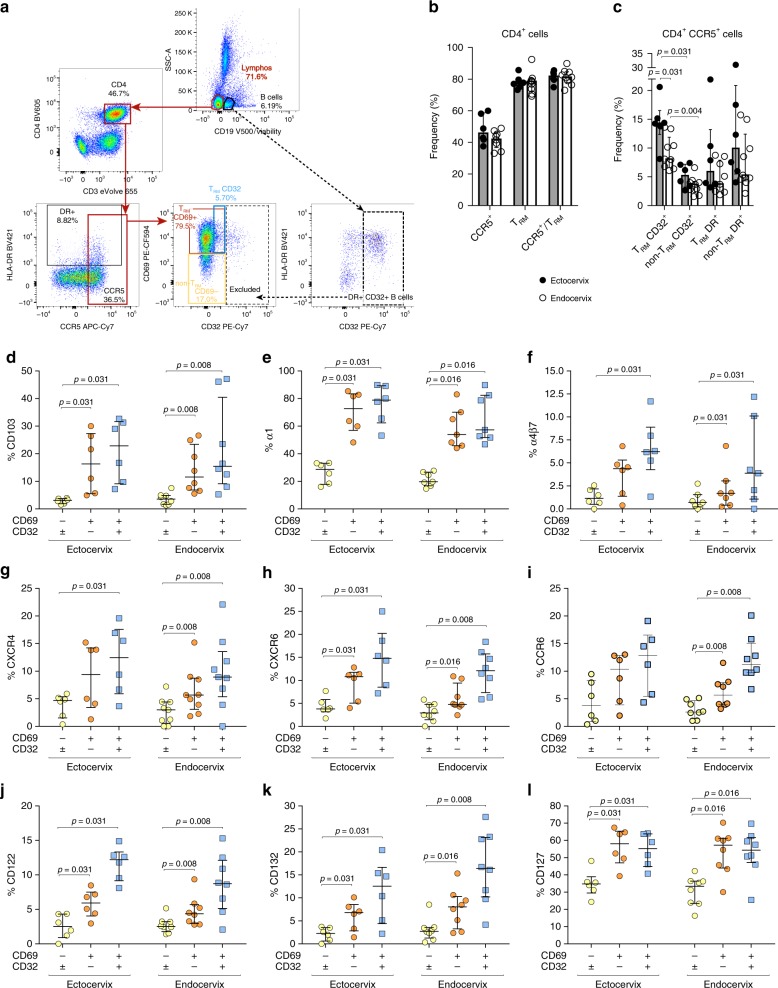
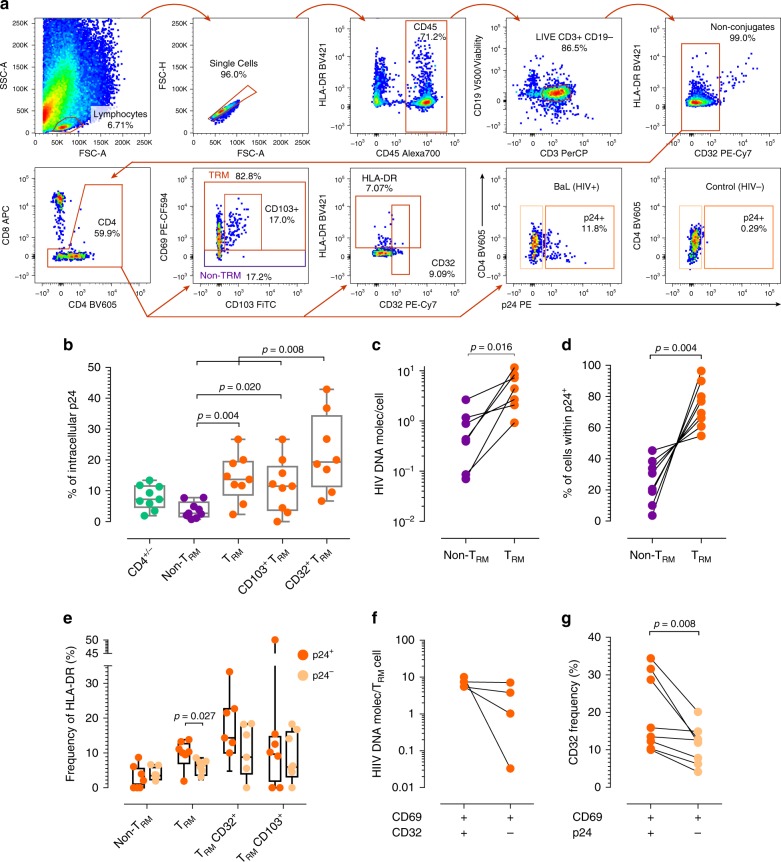
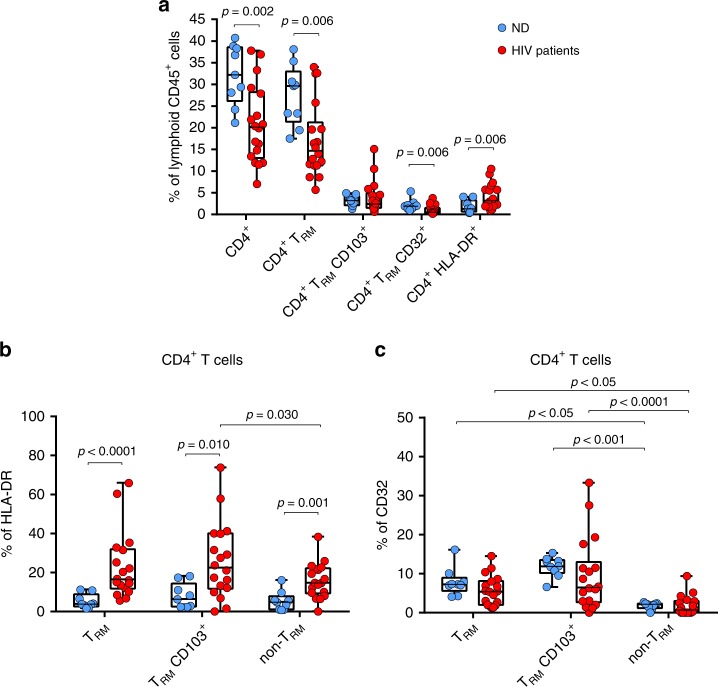
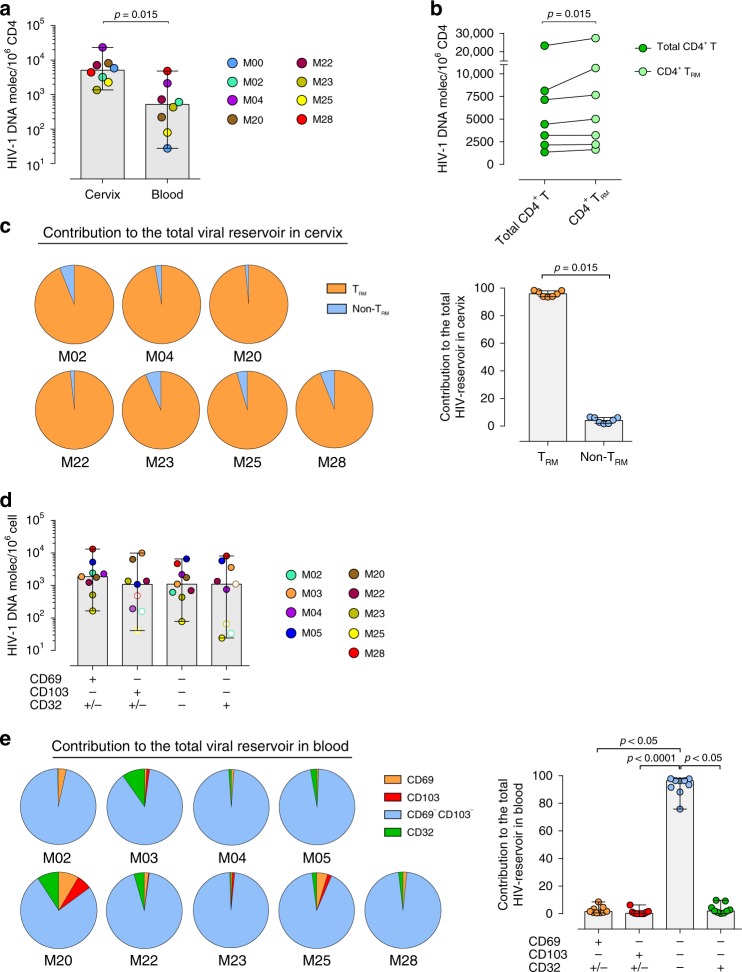
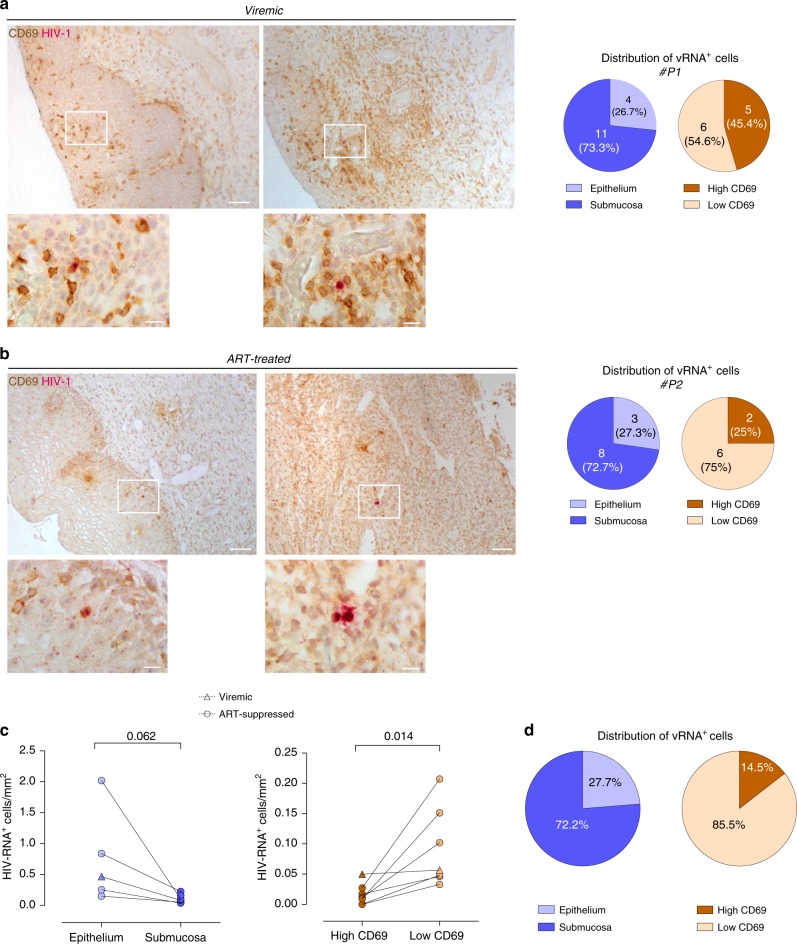
HIV viral reservoirs are established very early during infection. Resident memory T cells (TRM) are present in tissues such as the lower female genital tract, but the contribution of this subset of cells to the pathogenesis and persistence of HIV remains unclear. Here, we show that cervical CD4+TRM display a unique repertoire of clusters of differentiation, with enrichment of several molecules associated with HIV infection susceptibility, longevity and self-renewing capacities. These protein profiles are enriched in a fraction of CD4+TRM expressing CD32. Cervical explant models show that CD4+TRM preferentially support HIV infection and harbor more viral DNA and protein than non-TRM. Importantly, cervical tissue from ART-suppressed HIV+ women contain high levels of viral DNA and RNA, being the TRM fraction the principal contributor. These results recognize the lower female genital tract as an HIV sanctuary and identify CD4+TRM as primary targets of HIV infection and viral persistence. Thus, strategies towards an HIV cure will need to consider TRM phenotypes, which are widely distributed in tissues.


Conflict of interest statement

The authors declare no competing interests.

Figures

Fig. 1
Fig. 1
CD4+ TRM identification in cervix. a General gating strategy for phenotyping of CD4+ T cells obtained from cervicovaginal tissue of healthy donors. Gating strategy consisted of selecting hematopoietic CD45+ cells, followed by a double doublet exclusion, dead and CD19+ cells exclusion and finally a CD3+ CD4+ T cell gate from where CD69+/− cells were identified. b Representative flow cytometry plots of the expression of different cell-surface proteins and transcriptional factors in the CD4+CD69+/− T cell subsets from the cervical tissue of healthy donors (CD69 on the left column, CD69+ on the right column). c Frequency of different cell-surface proteins and transcriptional factors shown in b for CD4+CD69 T cells (empty circles) and CD4+CD69+ T cells (full circles; n = 5 for S1PR1; n = 6 for Eomes, T-bet, Hobit, CD49a; n = 7 for CCR7, PD-1). Lines and error bars represent median and interquartile ranges. Statistical comparisons were performed using Wilcoxon matched-pairs signed rank test to compare the two groups. Source data are provided as a Source Data file
Fig. 2
Fig. 2
CCR5+ CD4+ TRM protein expression signature in cervix. a Gating strategy for phenotyping of CD4+ T cells obtained from cervicovaginal tissue of healthy donors. Based on the gating strategy shown in Fig. 1a, a lymphocyte gate (marked in red) was selected in a plot where dead and CD19+ were excluded. From one hand, CD3+ CD4+ T cells and then CCR5 positive cells were selected to further analyze three different subsets based on CD69 and CD32 expression: non-TRM (yellow gate), TRM CD32 (orange gate) and TRM CD32+ (blue gate). Of note, to identify CD4+ T cells expressing low levels of CD32 (CD32dim, blue gate), we previously defined a gate of exclusion in putative B cells (CD19+, depicted in dotted black lines) as these cells express high levels of CD32. b Frequency of diverse subsets within CD4+ T cells from human ectocervix (n = 6) and endocervix (n = 9). c Frequency of diverse subsets within CD4+ CCR5+ T cells from human ectocervix (n = 6) and endocervix (n = 9). dl Frequency of expression of diverse cell-surface proteins within three different CD4+CCR5+ T cell subsets; namely CD69 non-TRM (yellow), CD32 TRM (orange) and CD32+ TRM (blue), in human ectocervix (n = 6) and endocervix (n = 7 for 2e, 2f; n = 8 for 2d, 2h, 2i, 2j, 2k, 2l; n = 9 for 2b, 2c, 2g). Lines and error bars represent median and interquartile ranges. All statistical comparisons were performed using Wilcoxon matched-pairs signed rank test. Source data are provided as a Source Data file
Fig. 3
Fig. 3
TRM are preferentially infected in the cervical explant model of HIV infection. a General gating strategy for phenotype analyses and intracellular p24 detection in CD4+/− TRM and non-TRM obtained from cervicovaginal tissue infected ex vivo with HIV-1BaL strain. Gating strategy consisted of a lymphocyte gate based on FSC vs. SSC, followed by doublet exclusion, hematopoietic CD45+ cells, live CD3+ T cells with CD19+ cells exclusion, further B cell exclusion and a CD4+/− T cell gate from where the different gates shown were quantified: CD4+/− non-TRM (purple) or CD4+/− TRM (orange) or HLA-DR/CD32dim expression. An example of p24 expression from an infected and a non-infected sample is shown. b Frequency of p24 viral antigen in total CD4+/− cells (green), CD4+/− non-TRM (purple), CD4+/− TRM (orange), CD4+/− CD103+ TRM and CD4+/− CD32+ TRM detected after 10–12 days of ex vivo infection and measured by flow cytometry (n = 9, except for CD4+/− CD32+ TRM where n = 8). c Number of HIV-DNA molecules per cell in non-TRM and TRM detected after 10–12 days of ex vivo infection and measured by qPCR (n = 7). d Frequency of non-TRM and TRM from the total p24 positive cells measured by flow cytometry (n = 9). e Frequency of HLA-DR expression in different subsets based on their expression of p24 viral antigen after 10–12 days of ex vivo infection (n = 9, except for CD4+/− CD32+ TRM where n = 8). f Number of HIV-DNA molecules per cell in TRM CD32+ and TRM CD32 detected after 10–12 days of ex vivo infection and measured by qPCR (n = 4). g CD32 frequency in p24+ TRM compared to p24 TRM, measured by flow cytometry (n = 8). For b and e the median is shown as a solid line, the box indicates the 25–75 percentile range, while the whiskers show the range. Statistical analysis consisted of a Wilcoxon matched-pairs signed rank test. Source data are provided as a Source Data file
Fig. 4
Fig. 4
Impact of HIV infection on CD4+ TRM cell subsets from cervix. a Frequency of cervical CD4+, TRM, TRM CD103+, TRM CD32+, and HLA-DR+ CD4+ T cells from the total cervical CD45+ lymphoid cells was determined following the gating strategy described in Fig. 3 in normal donors (ND, blue circles, n = 9) and HIV infected patients (red circles, n = 18, corresponding to M01-M05, M11, M15-M23, and M25-M27). b HLA-DR expression in cervical TRM, CD103+ TRM and non-TRM in normal donors and HIV infected patients. c CD32 expression in cervical TRM, CD103+ TRM and non-TRM in normal donors and HIV infected patients. The median is shown as a solid line, the box indicates the 25–75 percentile range, while the whiskers show the range. Statistical comparisons were performed using two-tailed Mann–Whitney rank test to compare the two groups and using Friedman test with post hoc Dunn’s correction for multiple comparisons for intra-group comparisons. Source data are provided as a Source Data file
Fig. 5
Fig. 5
Cellular reservoirs in CD4+/− T cells from cervix and blood of ART-suppressed HIV-1 infected women. a Comparison of HIV-1 DNA molecules per million CD4+/− T cells in cervix and PBMCs from the same ART-treated women (n = 8). b Comparison of HIV-1 DNA molecules per million CD4+/− T cells and per million CD4+/− CD69+ (TRM) in cervix from seven ART-suppressed women. c Individual contribution of CD4+/− TRM and non-TRM to the total HIV reservoir in cervicovaginal tissue (left) and summary data from all patients (right). d HIV-1 DNA molecules per million cells in four different subsets based on the expression of CD69, CD103 and CD32 in CD4+/− T cells from blood in HIV-infected women (n = 9). Empty circles represent values under the limit of detection. e Contribution of analyzed subsets to the total HIV reservoir in blood (left) and summary data from all patients (right). Boxes and error bars represent median and range. Statistical comparisons in Fig. 5a–c were performed using Wilcoxon matched-pairs signed rank test and in Fig. 5d and e using Friedman test with post hoc Dunn’s correction for multiple comparisons. Source data are provided as a Source Data file
Fig. 6
Fig. 6
Detection of HIV-RNA+ CD69+ cells in the cervical mucosa of virologically suppressed women. Paraffin-embedded cervical tissue from one viremic and six ART-suppressed HIV-infected women were stained for HIV-1 RNA (rose) using the RNAscope 2.5 HD Duplex Reagent Kit in combination with immunohistochemistry of CD69 protein (brown). a Two representative images of a viremic HIV-infected patient (#P1) with a cell co-expressing HIV-1 RNA and CD69 in the epithelium (left) and in the submucosa (right) are shown inside a white square. Lower panels show high magnification of each of these squares. Scale bar is 100 µm and 20 µm in top and bottom panels, respectively. Left pie chart shows the proportion of HIV-RNA+ cells detected in the epithelium (light blue) or in the submucosa (dark blue) from the total of 15 HIV-RNA+ cells detected in the cervix of #P1. Right pie chart shows the proportion of HIV-RNA+ cells detected in the submucosa associated to CD69 enriched clusters (dark brown) or independent from CD69 clusters (light brown). b Two representative images of an ART-suppressed HIV-infected patient (#P2) with a cell co-expressing HIV-1 RNA and CD69 in the epithelium (left) and in the submucosa (right) are shown inside a white square. Lower panels show high magnification of each of these squares. Scale bar is 100 µm and 20 µm in top and bottom panels, respectively. Pie charts represent the same proportions as in a for a total of 11 HIV-RNA+ cells detected in the cervix (left) or of 8 HIV-RNA+ cells in the submucosa (right) of #P2 patient. c Comparison of positive cells harboring vRNA per square millimeter in the epithelium and the submucosa of n = 7 HIV-infected patients. Triangle symbols correspond to a viremic patient and circle symbols correspond to data from ART-suppressed patients. Statistical comparisons were performed using Wilcoxon matched-pairs signed rank test. d Distribution of HIV-RNA+ cells in different localizations of the cervical tissue in n = 7 HIV-infected patients. Source data are provided as a Source Data file

Similar articles

Cited by

References

    1. Chun TW, et al. Early establishment of a pool of latently infected, resting CD4(+) T cells during primary HIV-1 infection. Proc. Natl Acad. Sci. USA. 1998;95:8869–8873. doi: 10.1073/pnas.95.15.8869. - DOI - PMC - PubMed
    1. Murray AJ, Kwon KJ, Farber DL, Siliciano RF. The Latent Reservoir for HIV-1: how immunologic memory and clonal expansion contribute to HIV-1 persistence. J. Immunol. 2016;197:407–417. doi: 10.4049/jimmunol.1600343. - DOI - PMC - PubMed
    1. Estes JD, et al. Defining total-body AIDS-virus burden with implications for curative strategies. Nat. Med. 2017;23:1271–1276. doi: 10.1038/nm.4411. - DOI - PMC - PubMed
    1. Fletcher CV, et al. Persistent HIV-1 replication is associated with lower antiretroviral drug concentrations in lymphatic tissues. Proc. Natl Acad. Sci. USA. 2014;111:2307–2312. doi: 10.1073/pnas.1318249111. - DOI - PMC - PubMed
    1. Chomont N, et al. HIV reservoir size and persistence are driven by T cell survival and homeostatic proliferation. Nat. Med. 2009;15:893–900. doi: 10.1038/nm.1972. - DOI - PMC - PubMed

Publication types

MeSH terms

Substances