

Targeting TGFβR2-mutant tumors exposes vulnerabilities to stromal TGFβ blockade in pancreatic cancer
- PMID: 31609088
- PMCID: PMC6835203
- DOI: 10.15252/emmm.201910515
Targeting TGFβR2-mutant tumors exposes vulnerabilities to stromal TGFβ blockade in pancreatic cancer
Abstract
TGFβ is important during pancreatic ductal adenocarcinoma (PDA) progression. Canonical TGFβ signaling suppresses epithelial pancreatic cancer cell proliferation; as a result, inhibiting TGFβ has not been successful in PDA. In contrast, we demonstrate that inhibition of stromal TGFβR2 reduces IL-6 production from cancer-associated fibroblasts, resulting in a reduction of STAT3 activation in tumor cells and reversion of the immunosuppressive landscape. Up to 7% of human PDA have tumor cell-specific deficiency in canonical TGFβ signaling via loss of TGFβR2. We demonstrate that in PDA that harbors epithelial loss of TGFβR2, inhibition of TGFβ signaling is selective for stromal cells and results in a therapeutic benefit. Our study highlights the potential benefit of TGFβ blockade in PDA and the importance of stratifying PDA patients who might benefit from such therapy.
Keywords: IL-6; TGFβ; cancer-associated fibroblast; pancreatic cancer; tumor immunology.
© 2019 The Authors. Published under the terms of the CC BY 4.0 license.
Conflict of interest statement
RAB reports receiving a commercial research grant from Eli Lilly & Company. KED is an employee of Eli Lilly and Company. The authors have no additional financial interests.
Figures
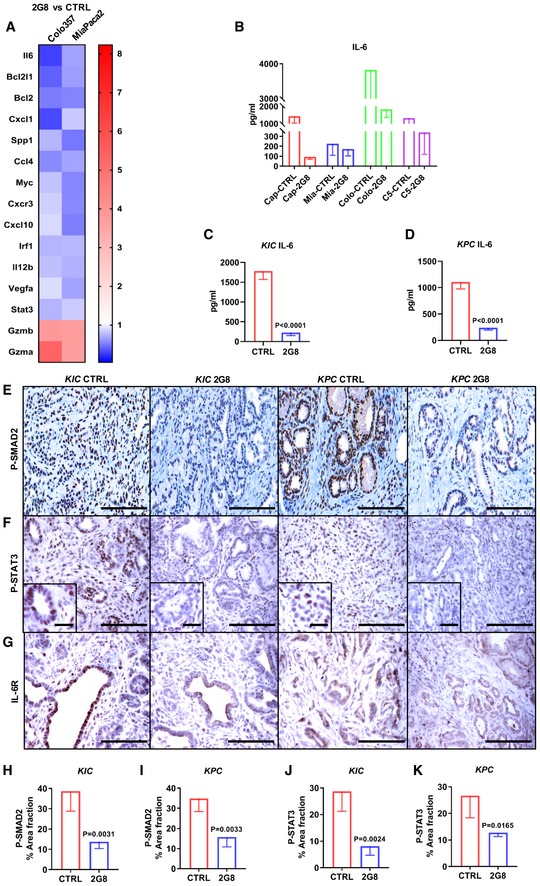
- A
Mouse qPCR array analysis was performed with Colo357 and MiaPaca‐2 orthotopic tumor samples treated with saline (control) or 2G8 (n = 3/group) to detect changes in mouse stromal gene expression after treatment. A heat map was generated with ratios of gene expression (2G8 versus control).
- B
ELISA‐based Quansys mouse chemokine assay was performed with Capan‐1 (Cap), MiaPaCa‐2 (Mia), Colo357 (Colo), and C5LM2 (C5) orthotopic tumor samples treated with saline (control) or 2G8 (n = 3/group) to detect mouse chemokine changes after treatment. Change in mouse IL‐6 was shown.
- C, D
KIC mice were treated for 4 weeks, and KPC mice were treated for 55 days with Mac84 (control) or 2G8. Tumors from were collected for mouse IL‐6 ELISA (n = 6/group).
- E–K
KIC mice were treated for 4 weeks, and KPC mice were treated for 55 days with Mac84 (control) or 2G8. The activation of SMAD2 (P‐Ser465/467) (E and H–I) and STAT3 (P‐Tyr705) (F and J–K) and expression of IL‐6R (G) were detected by immunohistochemistry (n = 4/group). Scale bars outside the magnification boxes = 50 μm, and scale bars inside the magnification boxes = 10 μm.
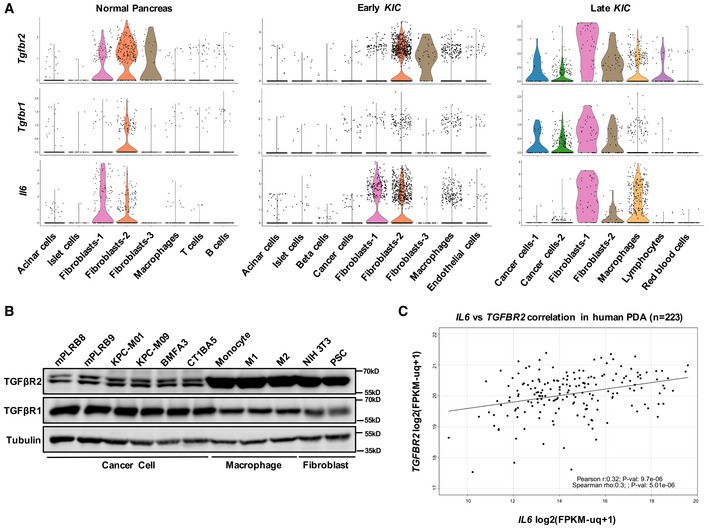
- A
Single‐cell RNA sequencing was performed to profile cell populations in normal mouse pancreas (n = 2), early KIC (40‐day‐old, n = 2), and late KIC (60‐day‐old, n = 3) pancreata. Samples from the same stage were pooled. Violin plots of expression of Il6, Tgfbr1, and Tgfbr2 in distinct cell populations is shown.
- B
The expression of TGFβR1 and TGFβR2 in cell lysates harvested from KIC (mPLRB8, mPLRB9), KPC (KPC‐M01, KPC‐M09), and KPfC (BMFA3, CT1BA5) mouse cancer cells, mouse macrophages (RAW 264.7), and mouse fibroblasts (NIH 3T3 and pancreatic stellate cells). RAW 264.7 cells were induced into M1 (30 ng/ml LPS for 18 h) or M2 (20 ng/ml IL‐4 for 18 h) macrophages. Tubulin was used as a loading control.
- C
Pearson and Spearman correlation of the expression of IL6 and TGFBR2 in PDA patients from TCGA (n = 223) using R.
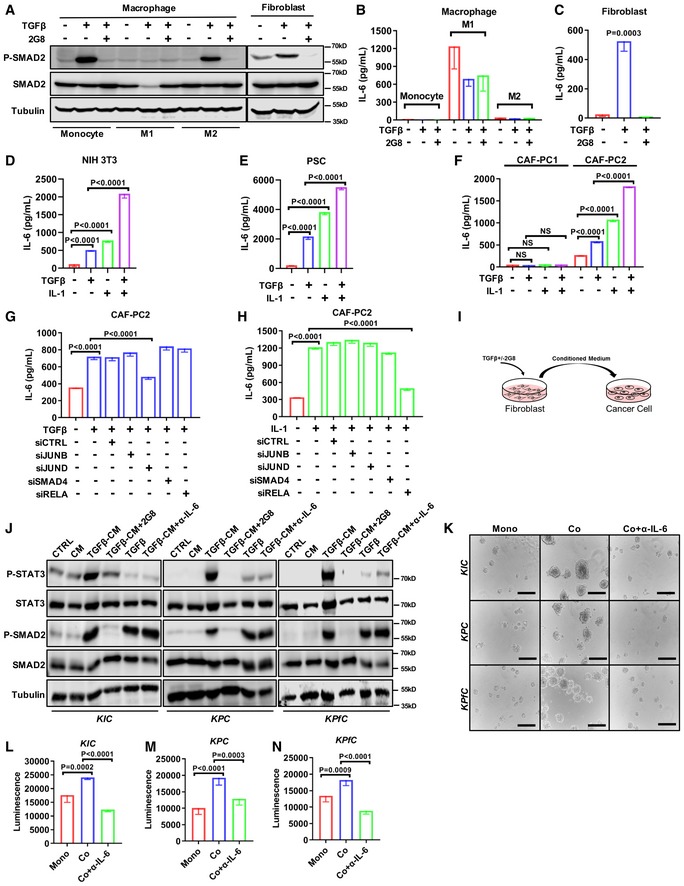
- A–C
Control, M1 (LPS stimulated), and M2 (IL‐4 stimulated) RAW 264.7 cells, and NIH 3T3 cells were treated with TGFβ (30 ng/ml), or TGFβ + 2G8 (100 ng/ml) for 24 h. Cell lysates were harvested and blotted for P‐SMAD2 (P‐Ser465/467), SMAD2, and tubulin (A). Conditioned media (CM) was collected for mouse IL‐6 ELISA (B–C). P value by ANOVA is shown.
- D–F
NIH 3T3 (D), pancreatic stellate cells (PSC) (E), and human CAF cell lines CAF‐PC1 and CAF‐PC2 (F) were treated with TGFβ (30 ng/ml) and/or IL‐1α (1 ng/ml) for 24 h. CM was collected for mouse or human IL‐6 ELISA. P values by t‐test are shown.
- G, H
CAF‐PC2 cells were treated with TGFβ (30 ng/ml) (G) or IL‐1α (1 ng/ml) (H) for 24 h with siRNA‐mediated knockdown of JUNB, JUND, SMAD4, or RELA. CM was collected and subjected to human IL‐6 ELISA. P values by t‐test were shown.
- I, J
KIC (mPLRB9), KPC (KPC‐M09), and KPfC (BMFA3) cell lines were treated with normal DMEM (CTRL), CM from NIH 3T3 (CM), CM from TGFβ‐treated NIH 3T3 (TGFβ‐CM), CM from TGFβ‐treated NIH 3T3 + 2G8 (TGFβ‐CM + 2G8) (I), normal DMEM + TGFβ (TGFβ), and CM from TGFβ‐treated NIH 3T3 + IL‐6 neutralizing antibody (TGFβ‐CM + IL‐6 Ab). Cell lysates were harvested and blotted for P‐STAT3 (P‐Tyr705), STAT3, P‐SMAD2 (P‐Ser465/467), SMAD2, and tubulin (J).
- K–N
3D culture: cells were seeded on poly‐HEMA‐coated 96‐well plates and cultured for 4 days (5,000 cancer cells for monoculture, 3,000 cancer cells + 2,000 NIH 3T3 for co‐culture). IL‐6 neutralizing antibody (100 ng/ml). Scale bars = 50 μm. n = 5/group, P values by t‐test are shown.
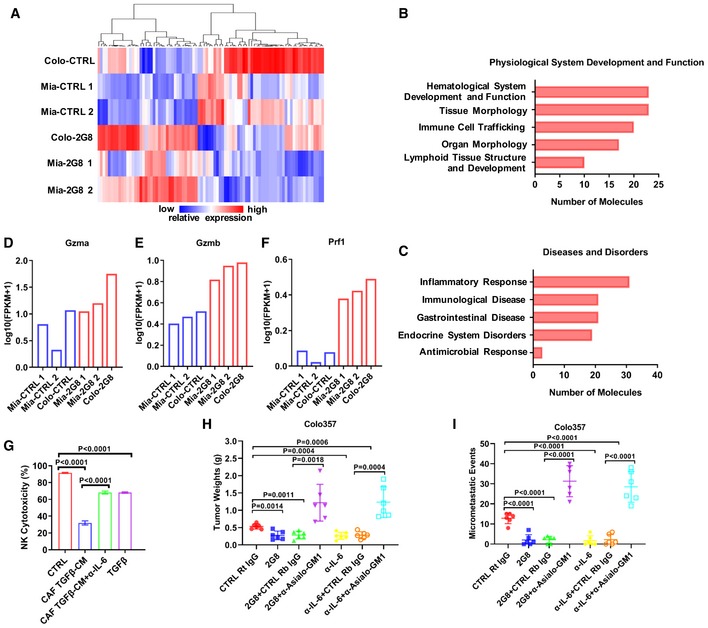
- A–F
Saline and 2G8‐treated MiaPaca‐2 and Colo375 xenografts were subjected to RNA‐seq analysis for mouse gene expression changes. A heat map was generated with gene clustering (A). IPA showing pathways most effected by 2G8 (B–C). Molecules most significantly effected by 2G8 treatment. Y‐axis values shown are log10(FPKM+1) of the transcript levels (D‐F).
- G
An in vitro NK cell cytotoxicity assay was performed. Human NKL cells were used as effector cells, and mouse pancreatic cancer BMFA3 cells were used as target cells in normal DMEM (control), conditioned medium collected from TGFβ (30 ng/ml)‐treated human pancreatic CAFs (CAF‐PC2; CAF TGFβ‐CM), CAF TGFβ‐CM + IL‐6 antibody (100 ng/ml), or normal DMEM + TGFβ (TGFβ). Living cells were labeled with CFSE, and dead cells were labeled with 7‐AAD. Samples were analyzed by flow cytometry. Cytotoxicity percentage was calculated using the formula (7‐AAD‐positive cells %)/(7‐AAD‐positive cells % + CFSE‐positive cells %) × 100%. n = 4/group, P values by t‐test are shown.
- H, I
Human pancreatic cancer cell line Colo357 was orthotopically implanted into NOD SCID mice. After tumor establishment, mice were randomized to receive rat IgG Mac84 (control), 2G8, or anti‐mouse IL‐6 antibody MP5‐20F3 (each 30 mg/kg 2×/week, n = 6/group) for 3 weeks. For NK cell depletion, prior to therapies, mice received 50 μg of control rabbit IgG or anti‐Asialo‐GM1 3 days in a row. For maintenance, 25 μg of control rabbit IgG or anti‐Asialo‐GM1 was given twice a week throughout the whole study. Tumors were harvested for analysis, and metastatic burden was determined by histologic evaluation of H&E‐stained liver tissue. Ten sections of the anterior lobe of the liver (n = 6 per group) were scored for lesions. P values by t‐test are shown.
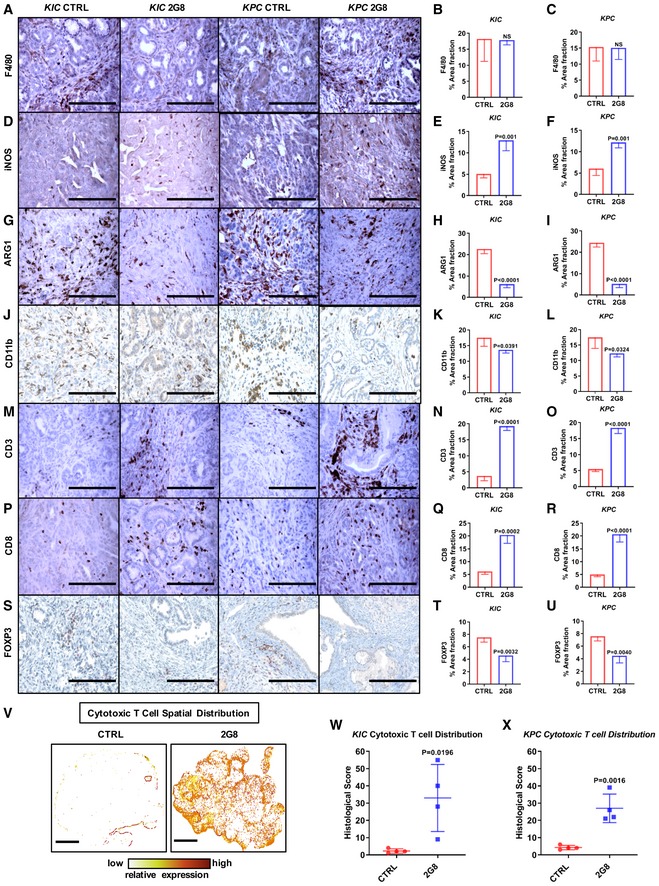
- A–U
KIC mice were treated for 4 weeks, and KPC mice were treated for 55 days with Mac84 (control) or 2G8. Immune landscape changes were detected by immunohistochemistry for macrophage makers F4/80 (total, A–C), iNOS (M1, D–F), ARG1 (M2, G–I), CD11b (myeloid‐derived suppressor cells, J–L), and T‐cell markers CD3 (M–O), CD8 (P–R), and FOXP3 (regulatory T cells, S–U) in KIC and KPC mice. Scale bars = 50 μm. n = 4/group, P values by t‐test are shown.
- V–X
Spatial distribution analysis of CD8‐positive T cells after 2G8 treatment. Details are described in Appendix Fig S7. Sample images of KPC tumors are shown (V). Substantial cytotoxic T‐cell infiltration was observed after 2G8 treatment. Histological score was calculated using the following formula (W, X): low IHC cells % + 2× (medium IHC cells %) + 3× (high IHC cells %). Scale bars = 500 μm. n = 4/group, P values versus control by t‐test are shown.
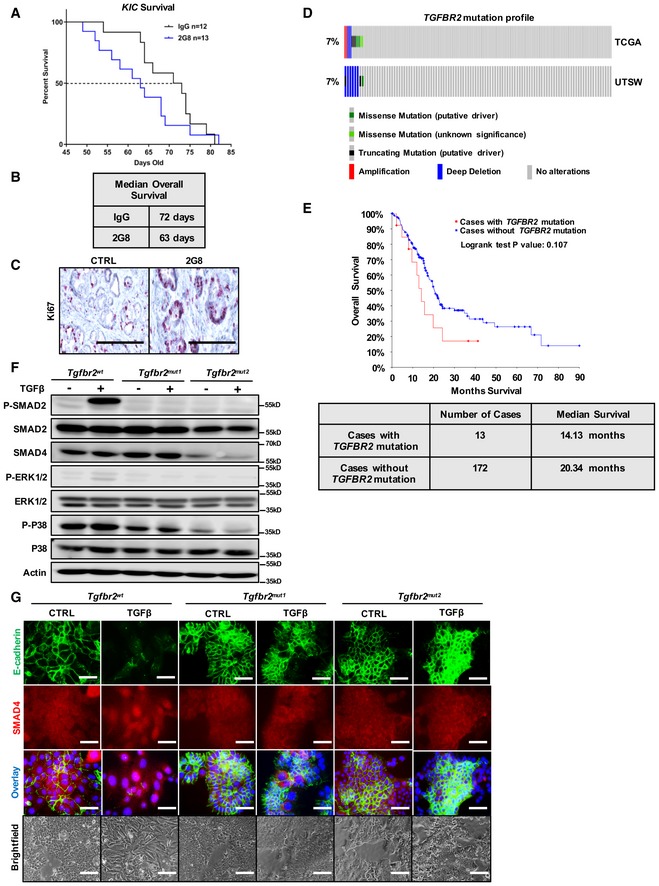
- A, B
KIC mice were treated in a survival study with rat IgG Mac48 (control) or 2G8. Median overall survival of rat IgG treatment was 72 days, while median overall survival of 2G8 treatment was 63 days (B).
- C
Tissues from (A) were stained for Ki67. Scale bars = 50 μm.
- D
Mutation profile of TGFBR2 in PDA patient samples from two independent sources (UTSW and TCGA).
- E
Overall survival of PDA patients from TCGA with and without TGFBR2 mutation.
- F
Loss‐of‐function mutation of Tgfbr2 was generated by CRISPR with two different gRNAs (mut1 and mut2) in the mouse PDA cell line BMFA3 derived from KPfC model. Control cell line (Tgfbr2 wt) and two Tgfbr2‐mutant cell lines (Tgfbr2 mut1 and Tgfbr2 mut2) were treated with TGFβ (30 ng/ml) for 5 h. Cell lysates were harvested and Western blotting for P‐SMAD2, SMAD2, SMAD4, P‐ERK1/2, ERK1/2, P‐P38, P38, and actin was performed.
- G
Immunofluorescence was performed to study the expression and localization of E‐cadherin and SMAD4 after TGFβ treatment (30 ng/ml for 24 h) in control cell line and two Tgfbr2‐mutant cell lines. Scale bars = 50 μm (fluorescent), scale bars = 100 μm (brightfield).
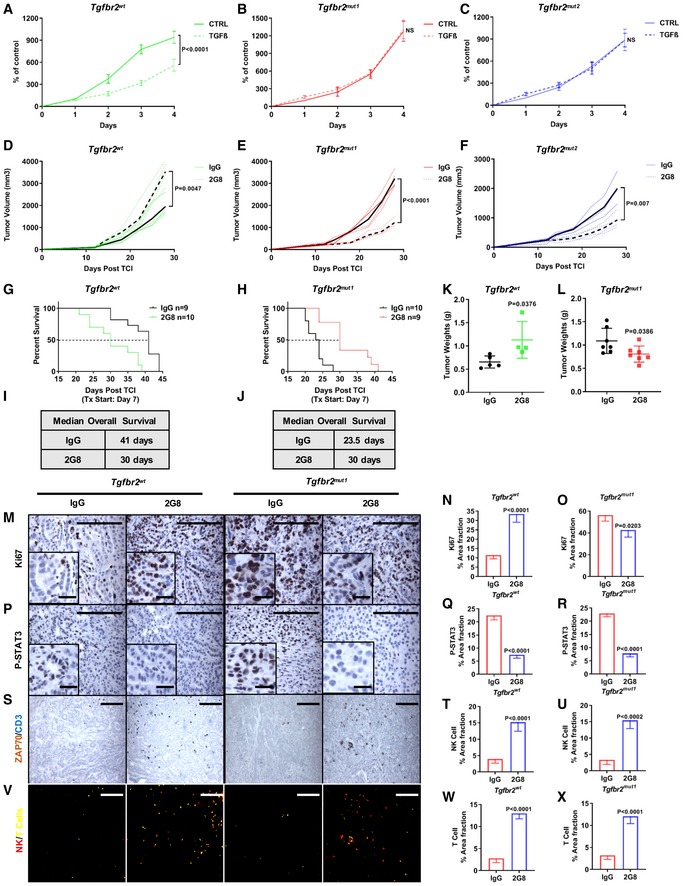
- A–C
Control cell line (Tgfbr2 wt) (A) and two Tgfbr2‐mutant cell lines (Tgfbr2 mut1 and Tgfbr2 mut2) (B, C) were treated with TGFβ at different time points, and cell growth (MTT) assays were performed. n = 8, P value by t‐test is shown. NS, not significant.
- D–F
Subcutaneous tumors established from control cell line (D) and two Tgfbr2‐mutant cell lines (E, F) in C57Bl/6 mice received rat IgG Mac48 (control) or 2G8 (each 30 mg/kg 2×/week, n = 4/group). Therapy started at day 12 post‐tumor cell injection; mice were on therapy for 16 days. Tumor volume was measured twice per week. P values by t‐test are shown.
- G–L
Control cell line (Tgfbr2 wt; G and I) and the Tgfbr2‐mutant cell line (Tgfbr2 mut1; H and J) were orthotopically implanted in C57Bl/6 mice. Mice received rat IgG Mac48 or 2G8, n = 9–10/group for survival study (each 30 mg/kg 2×/week). Mice were sacrificed when they became moribund. Tumors were harvested and weighed (K–L). P values by t‐test are indicated.
- M–X
Immunohistochemistry with tumor samples from (G, H) for Ki67 (M–O), P‐STAT3 (P–R), ZAP70, and CD3 (S–X) was performed. ZAP70 is a common marker for NK cells and T cells and was stained with a brown chromogen, and CD3 is a specific T‐cell marker and was stained with a blue chromogen. Brown signal was converted to red signal, and blue signal was converted to green by ImageJ (V); therefore, NK cells are highlighted as red (ZAP70+CD3−) and T cells are highlighted as yellow (ZAP70+CD3+). Scale bars outside the magnification boxes = 50 μm, scale bars inside the magnification boxes = 10 μm. n = 4/group, P values versus control by t‐test are shown.
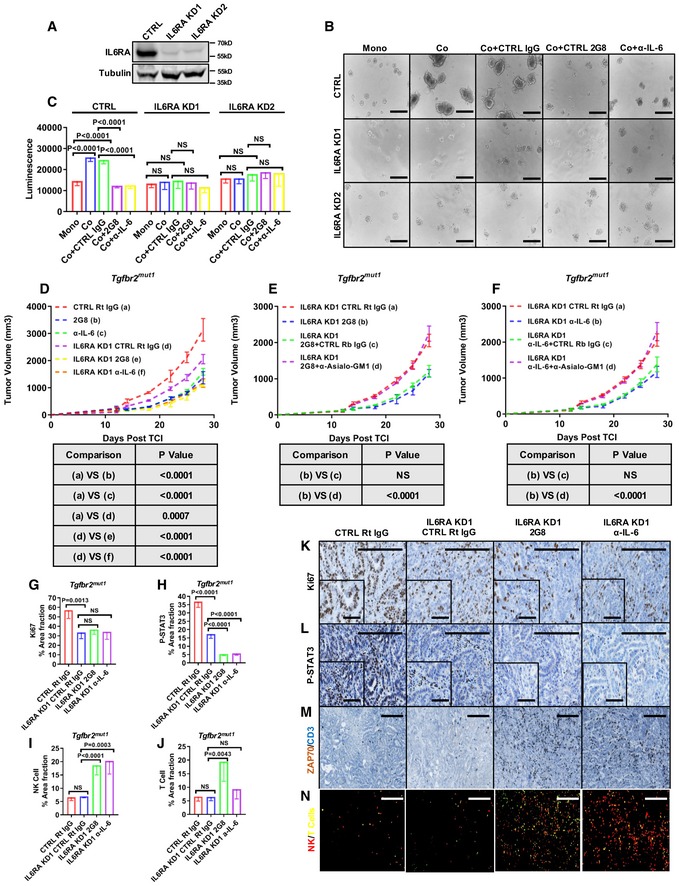
- A
Control shRNA or two different shRNAs against IL6RA were used to knock down IL6RA in the Tgfbr2‐mutant cell line Tgfbr2 mut1. Cell lysates were harvested and Western blotting for IL6RA and tubulin.
- B, C
3D culture: Control or IL6RA knockdown Tgfbr2 mut1 cells were seeded on poly‐HEMA‐coated 96‐well plates and cultured for 4 days (5,000 cancer cells for monoculture, 3,000 cancer cells + 2,000 NIH 3T3 for co‐culture). Control IgG, 2G8, and IL‐6 neutralizing antibody (each 100 ng/ml, n = 5/group). Scale bars = 50 μm. P values by t‐test are shown (C).
- D–F
Subcutaneous tumors established from control and IL6RA knockdown Tgfbr2‐mutant cell lines in C57Bl/6 mice received rat IgG Mac48 (control), 2G8, or anti‐mouse IL‐6 antibody MP5‐20F3 (each 30 mg/kg 2×/week, n = 5/group). For NK cell depletion, prior to therapies, mice received 50 μg of control rabbit IgG or anti‐Asialo‐GM1 3 days in a row. For maintenance, 25 μg of control rabbit IgG or anti‐Asialo‐GM1 was given twice a week throughout the whole study. Therapy started at day 12 post‐tumor cell injection, and mice were on therapy for 16 days. Tumor volume was measured twice per week. P values by t‐test are indicated.
- G–N
Immunohistochemistry with tumor samples from (D) for Ki67 (G and K), P‐STAT3 (H and L), ZAP70, and CD3 (I–J and M–N) was performed. NK cells are highlighted as red (ZAP70+CD3−), and T cells are highlighted as yellow (ZAP70+CD3+) by ImageJ (N). Scale bars outside the magnification boxes = 50 μm, scale bars inside the magnification boxes = 10 μm. n = 5/group, P values versus control by t‐test are shown.
Comment in
-
Toward personalized TGFβ inhibition for pancreatic cancer.EMBO Mol Med. 2019 Nov 7;11(11):e11414. doi: 10.15252/emmm.201911414. Epub 2019 Oct 22. EMBO Mol Med. 2019. PMID: 31639254 Free PMC article.
Comment on
-
Nuclear receptor corepressor 1 represses cardiac hypertrophy.EMBO Mol Med. 2019 Nov 7;11(11):e9127. doi: 10.15252/emmm.201809127. Epub 2019 Sep 18. EMBO Mol Med. 2019. PMID: 31532577 Free PMC article.
Similar articles
-
Stromal TGFβR2 signaling: a gateway to progression for pancreatic cancer.Mol Cell Oncol. 2014 Dec 1;2(3):e975606. doi: 10.4161/23723556.2014.975606. eCollection 2015 Jul-Sep. Mol Cell Oncol. 2014. PMID: 27308449 Free PMC article.
-
Neutralizing murine TGFβR2 promotes a differentiated tumor cell phenotype and inhibits pancreatic cancer metastasis.Cancer Res. 2014 Sep 15;74(18):4996-5007. doi: 10.1158/0008-5472.CAN-13-1807. Epub 2014 Jul 24. Cancer Res. 2014. PMID: 25060520 Free PMC article.
-
TGFβ Signaling in the Pancreatic Tumor Microenvironment Promotes Fibrosis and Immune Evasion to Facilitate Tumorigenesis.Cancer Res. 2016 May 1;76(9):2525-39. doi: 10.1158/0008-5472.CAN-15-1293. Epub 2016 Mar 15. Cancer Res. 2016. PMID: 26980767 Free PMC article.
-
T-cell programming in pancreatic adenocarcinoma: a review.Cancer Gene Ther. 2017 Mar;24(3):106-113. doi: 10.1038/cgt.2016.66. Epub 2016 Dec 2. Cancer Gene Ther. 2017. PMID: 27910859 Review.
-
Abrogation of transforming growth factor-beta signaling in pancreatic cancer.World J Surg. 2005 Mar;29(3):312-6. doi: 10.1007/s00268-004-7824-3. World J Surg. 2005. PMID: 15706432 Review.
Cited by
-
Targeting STAT3 in Cancer Immunotherapy.Mol Cancer. 2020 Sep 24;19(1):145. doi: 10.1186/s12943-020-01258-7. Mol Cancer. 2020. PMID: 32972405 Free PMC article. Review.
-
The Desmoplastic Stroma of Pancreatic Cancer: Multilayered Levels of Heterogeneity, Clinical Significance, and Therapeutic Opportunities.Cancers (Basel). 2022 Jul 5;14(13):3293. doi: 10.3390/cancers14133293. Cancers (Basel). 2022. PMID: 35805064 Free PMC article. Review.
-
Heterogeneity of Cancer-Associated Fibroblasts and the Tumor Immune Microenvironment in Pancreatic Cancer.Cancers (Basel). 2022 Aug 18;14(16):3994. doi: 10.3390/cancers14163994. Cancers (Basel). 2022. PMID: 36010986 Free PMC article. Review.
-
Pancreatic cancer stroma: an update on therapeutic targeting strategies.Nat Rev Gastroenterol Hepatol. 2020 Aug;17(8):487-505. doi: 10.1038/s41575-020-0300-1. Epub 2020 May 11. Nat Rev Gastroenterol Hepatol. 2020. PMID: 32393771 Free PMC article. Review.
-
The Cellular Origins of Cancer-Associated Fibroblasts and Their Opposing Contributions to Pancreatic Cancer Growth.Front Cell Dev Biol. 2021 Sep 27;9:743907. doi: 10.3389/fcell.2021.743907. eCollection 2021. Front Cell Dev Biol. 2021. PMID: 34646829 Free PMC article. Review.
References
-
- Albrengues J, Bourget I, Pons C, Butet V, Hofman P, Tartare‐Deckert S, Feral CC, Meneguzzi G, Gaggioli C (2014) LIF mediates proinvasive activation of stromal fibroblasts in cancer. Cell Rep 7: 1664–1678 - PubMed
-
- Bernard V, Semaan A, Huang J, San Lucas FA, Mulu FC, Stephens BM, Guerrero PA, Huang Y, Zhao J, Kamyabi N et al (2019) Single‐cell transcriptomics of pancreatic cancer precursors demonstrates epithelial and microenvironmental heterogeneity as an early event in neoplastic progression. Clin Cancer Res 25: 2194–2205 - PMC - PubMed
Publication types
MeSH terms
Substances
Associated data
- Actions
Grants and funding
LinkOut - more resources
Full Text Sources
Medical
Molecular Biology Databases
Miscellaneous
