. 2019 Sep 30:8:e48792.
doi: 10.7554/eLife.48792.

Molecular mechanism of TRPV2 channel modulation by cannabidiol

Affiliations

Molecular mechanism of TRPV2 channel modulation by cannabidiol

Ruth A Pumroy et al. Elife. .

Abstract

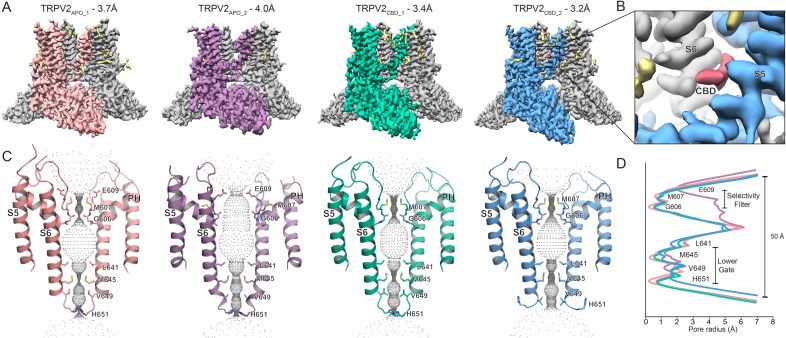
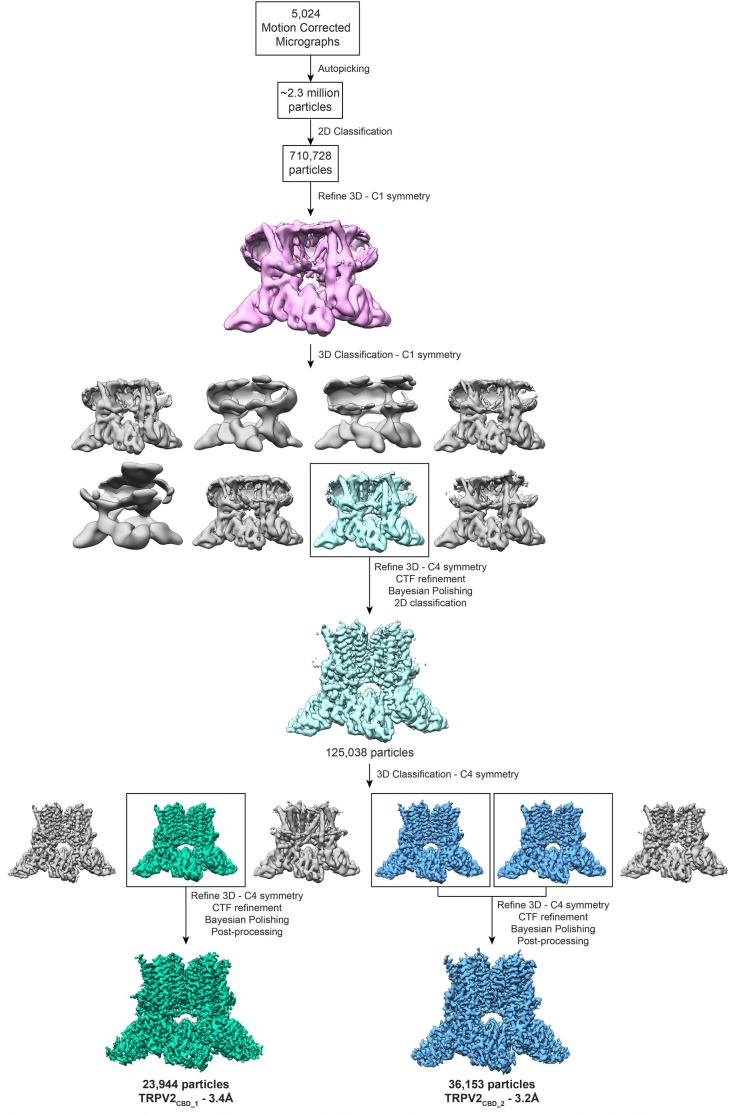
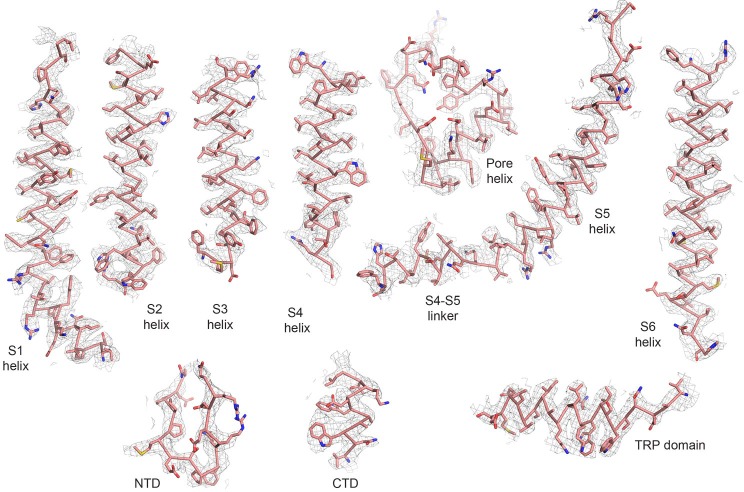
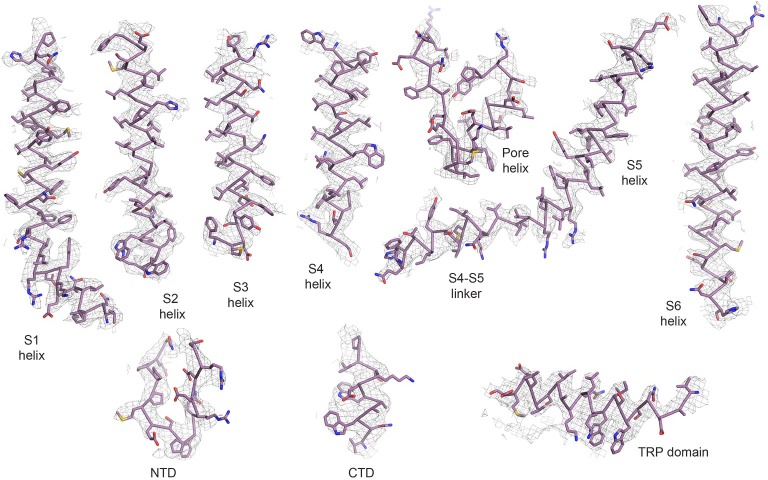
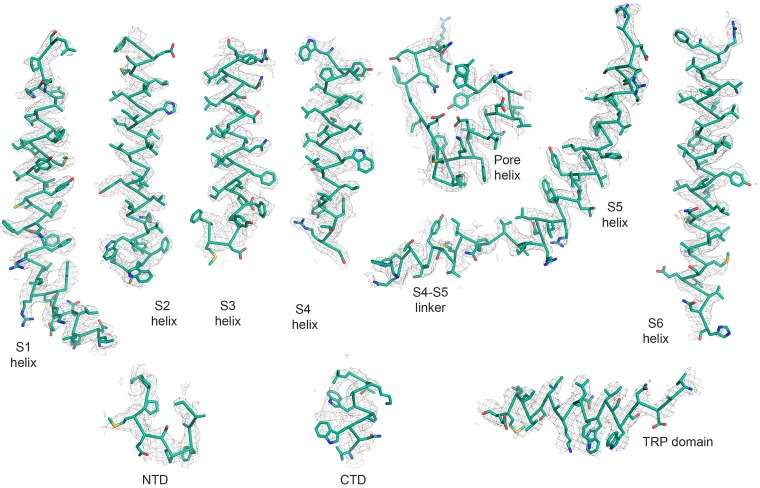
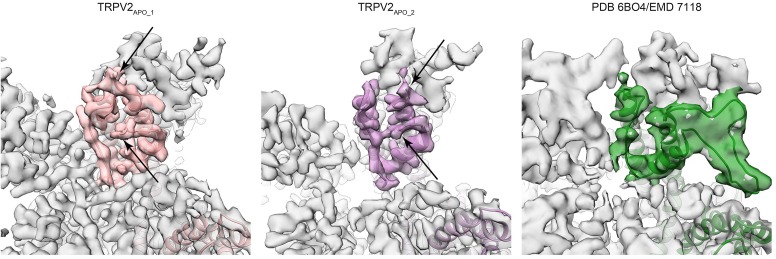
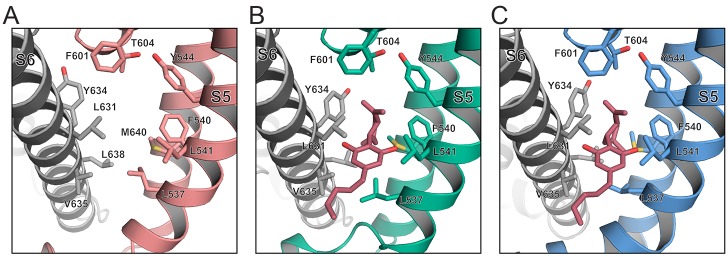
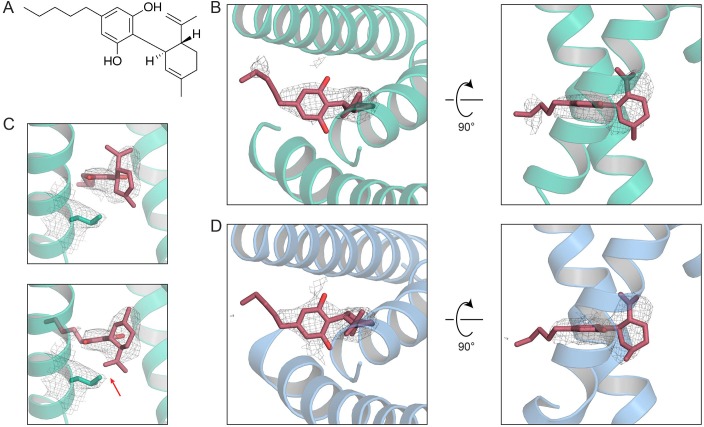
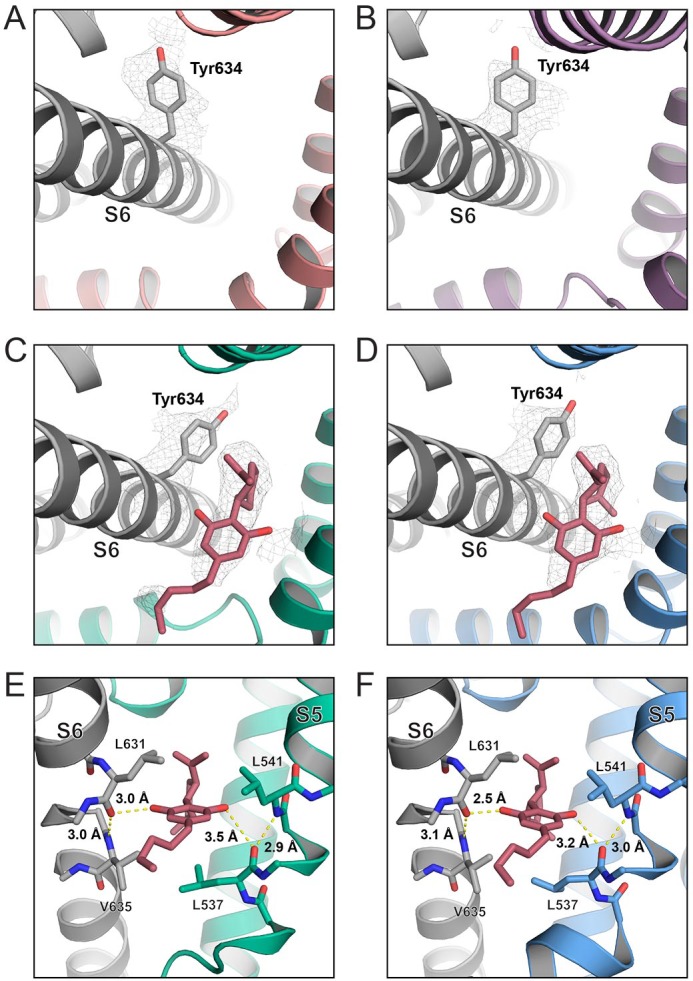
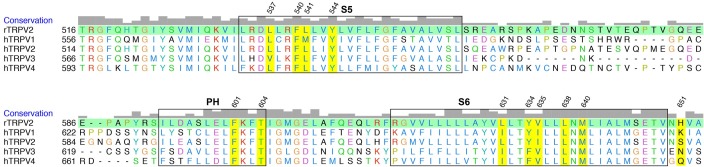
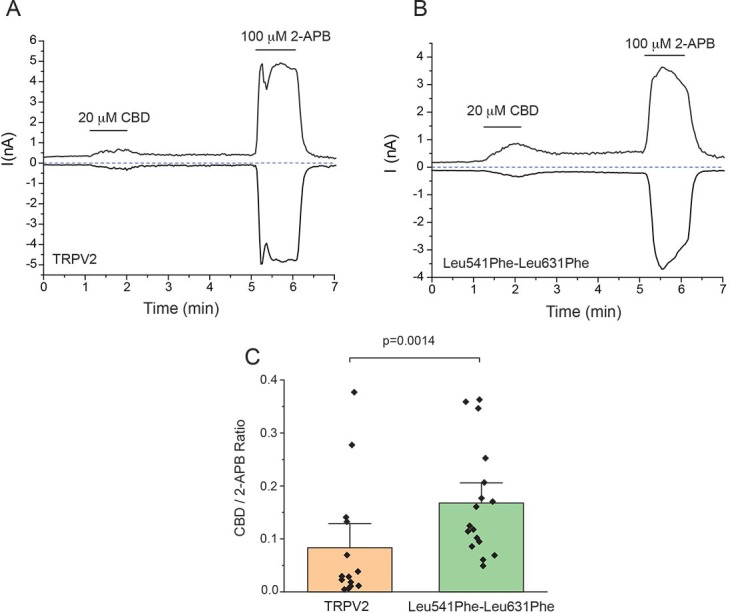
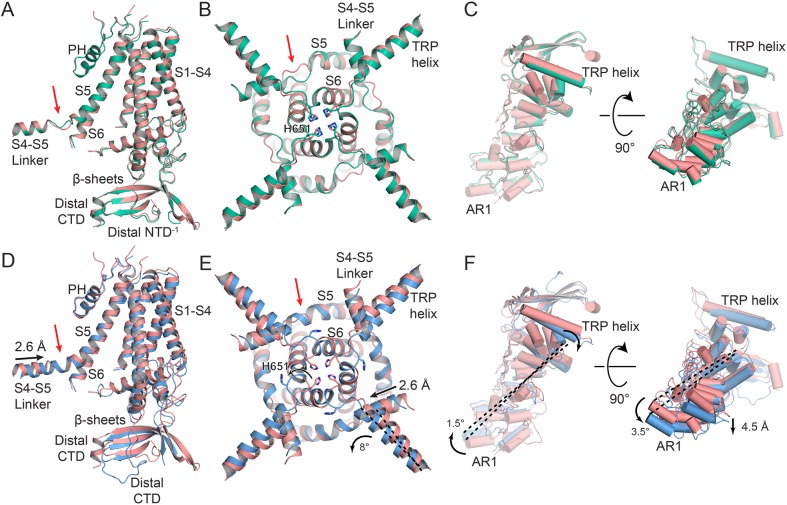
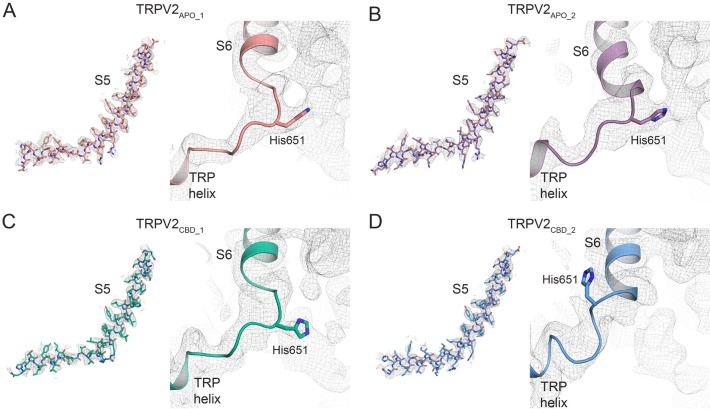
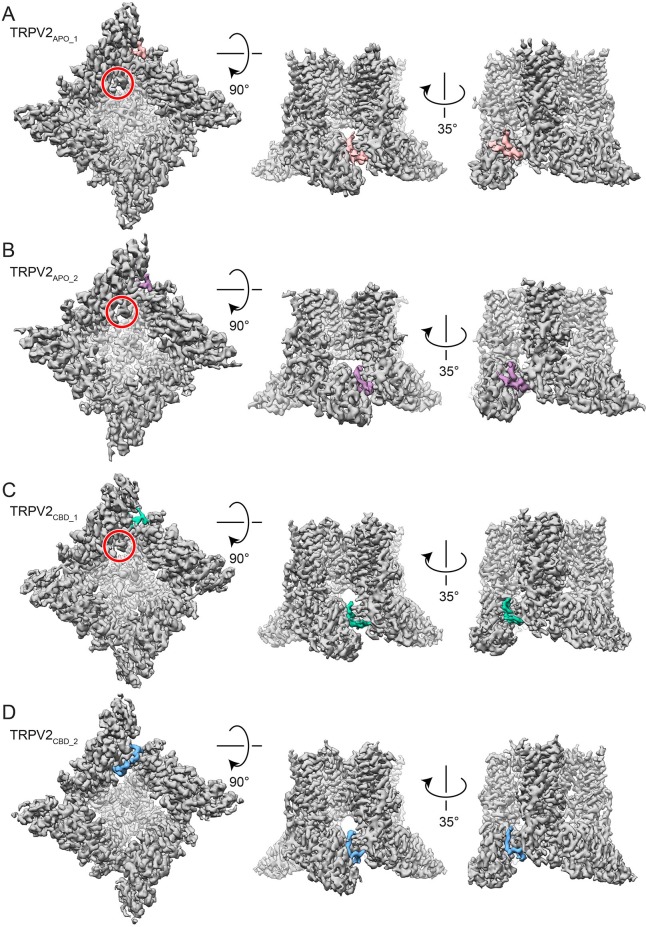
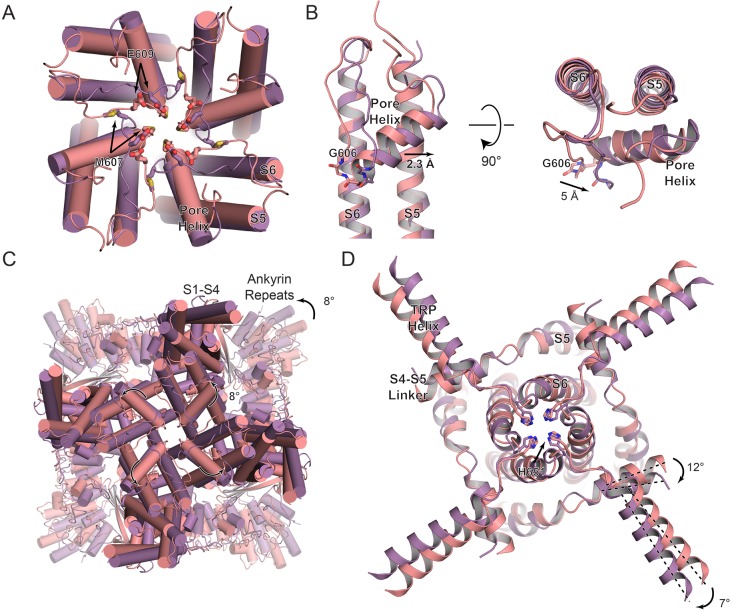
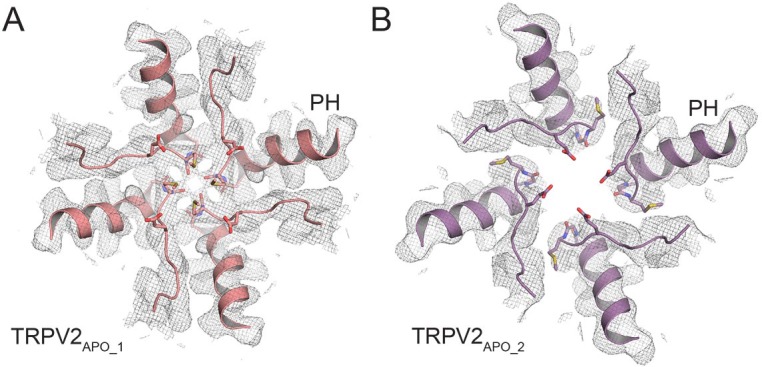
Transient receptor potential vanilloid 2 (TRPV2) plays a critical role in neuronal development, cardiac function, immunity, and cancer. Cannabidiol (CBD), the non-psychotropic therapeutically active ingredient of Cannabis sativa, is an activator of TRPV2 and also modulates other transient receptor potential (TRP) channels. Here, we determined structures of the full-length rat TRPV2 channel in apo and CBD-bound states in nanodiscs by cryo-electron microscopy. We show that CBD interacts with TRPV2 through a hydrophobic pocket located between S5 and S6 helices of adjacent subunits, which differs from known ligand and lipid binding sites in other TRP channels. CBD-bound TRPV2 structures revealed that the S4-S5 linker plays a critical role in channel gating upon CBD binding. Additionally, nanodiscs permitted us to visualize two distinct TRPV2 apo states in a lipid environment. Together these results provide a foundation to further understand TRPV channel gating, their divergent physiological functions, and to accelerate structure-based drug design.

Keywords: S. cerevisiae; TRP channels; cannabidiol; cryo-EM; ion channels; molecular biophysics; structural biology.


Conflict of interest statement

RP, AS, TH, SZ, YY, TR, VM No competing interests declared, YL, SH is affiliated with Pfizer Research and Development. The author has no financial interests to declare

Figures

Figure 1.
Figure 1.. Overview of the full-length rat TRPV2 channel structures in nanodiscs.
(A) Three-dimensional cryo-EM reconstructions for TRPV2APO_1 at 3.7 Å (salmon), TRPV2APO_2 at 4.0 Å (purple), TRPV2CBD_1 at 3.4 Å (green), TRPV2CBD_2 at 3.2 Å (blue); (B) CBD binding pocket in the TRPV2CBD_2 structure. The S5 and S6 helices are shown in blue and gray, respectively. Density attributed to CBD is shown in pink. (C) The profile of the ion permeation pathway for TRPV2APO_1 (salmon), TRPV2APO_2 (purple), TRPV2CBD_1 (green) and TRPV2CBD_2 (blue) structures; (D) Graphical representation of the radius of the pore as a function of the distance along the ion conduction pathway.
Figure 1—figure supplement 1.
Figure 1—figure supplement 1.. EM summary of apo full-length rat TRPV2 in nanodiscs.
(A) Representative micrograph and 2D classes of cryo-EM data. Map FSC curves and model validation curves for (B) TRPV2APO_1 and (C) TRPV2APO_2. Angular distribution for the final 3D reconstruction of (D) TRPV2APO_1 and (F) TRPV2APO_2. Tall red cylinders indicate a large number of particles aligned at a position and short blue cylinders indicate fewer particles. (D) Side and bottom views of (E) TRPV2APO_1 and (G) TRPV2APO_2 colored based on local resolution as calculated via RELION. Blue, white and red regions indicate resolutions of 3.5 Å, 4.5 Å and 5.5 Å, respectively.
Figure 1—figure supplement 2.
Figure 1—figure supplement 2.. Apo TRPV2 cryo-EM data processing.
Workflow for 3D reconstruction resulting in two distinct apo TRPV2 structures.
Figure 1—figure supplement 3.
Figure 1—figure supplement 3.. EM summary of CBD-bound full-length rat TRPV2 in nanodiscs.
(A) Representative micrograph and 2D classes of cryo-EM data. Map FSC curves and model validation curves for (B) TRPV2CBD_1 and (C) TRPV2CBD_2. Angular distribution for the final 3D reconstruction of (D) TRPV2CBD_1 and (F) TRPV2CBD_2. Tall red cylinders indicate a large number of particles aligned at a position and short blue cylinders indicate fewer particles. (D) Side and bottom views of (E) TRPV2CBD_1 and (G) TRPV2CBD_2 colored based on local resolution as calculated via RELION. Blue, white and red regions indicate resolutions of 3.0 Å, 4.0 Å and 5.0 Å, respectively.
Figure 1—figure supplement 4.
Figure 1—figure supplement 4.. CBD-bound TRPV2 cryo-EM data processing.
Workflow for 3D reconstruction resulting in two distinct CBD-bound TRPV2 structures.
Figure 1—figure supplement 5.
Figure 1—figure supplement 5.. Representative densities from the TRPV2APO_1 cryo-EM map.
Densities are contoured at σ = 5.
Figure 1—figure supplement 6.
Figure 1—figure supplement 6.. Representative densities from the TRPV2APO_2 cryo-EM map.
Densities are contoured at σ = 5.
Figure 1—figure supplement 7.
Figure 1—figure supplement 7.. Representative densities from the TRPV2CBD_1 cryo-EM map.
Densities are contoured at σ = 5.
Figure 1—figure supplement 8.
Figure 1—figure supplement 8.. Representative densities from the TRPV2CBD_2 cryo-EM map.
Densities are contoured at σ = 5.
Figure 1—figure supplement 9.
Figure 1—figure supplement 9.. Apo full-length rat TRPV2 pore turret comparison.
Comparison of cryo-EM density maps of TRPV2APO_1 (left, salmon), TRPV2APO_2 (middle, purple) and full-length rat TRPV2 in detergent (EMD 7118; right, green) in the pore turret region. The density surrounding the pore helix and the top of S5 is colored to standout from the rest of the density. A cartoon model of a single monomer is shown in each map. Arrows indicate the final residues visible on each end of the pore turret.
Figure 1—figure supplement 10.
Figure 1—figure supplement 10.. Cryo-EM density in the CBD binding pocket.
TRPV2 models overlaid with the final postprocessed map and the two corresponding half maps for (A) TRPV2APO_1, (B) TRPV2APO_2, (C) TRPV2CBD_1, and (D) TRPV2CBD_2. Cryo-EM densities are contoured at σ = 5 and are shown as gray mesh. Side chains of interest are shown as sticks. Bound CBD is not shown.
Figure 2.
Figure 2.. The CBD binding site.
Model representations of the CBD binding pockets in the (A) TRPV2APO_1 (salmon), (B) TRPV2CBD_1 (green) and (C) TRPV2CBD_2 (blue) structures. CBD is shown as pink sticks. Residues of interest are labeled and represented as sticks.
Figure 2—figure supplement 1.
Figure 2—figure supplement 1.. CBD fit in the cryo-EM map.
(A) Chemical diagram of cannabidiol (CBD). (B) Fit of CBD into the TRPV2CBD_1 map. (C) Comparison of two poses of CBD in the TRPV2CBD_1 map. The residue shown in sticks is Leu537. The red arrow indicates a clash. (D) Fit of CBD into the TRPV2CBD_2 map.
Figure 2—figure supplement 2.
Figure 2—figure supplement 2.. Hydrogen binding between CBD and the helical backbone.
The CBD binding pocket of (A) TRPV2CBD_1 (green) and (B) TRPV2CBD_2 (blue) represented as cartoons and sticks. Dashed yellow lines indicate measured distances and residues of interest are labeled.
Figure 2—figure supplement 3.
Figure 2—figure supplement 3.. Sequence alignment of thermoTRPV channels.
Alignment of human thermo TRPV channels and rat TRPV2 (highlighted in green). Residues are colored using the Clustal X coloration scheme. Residues of interest in this study are highlighted in yellow.
Figure 2—figure supplement 4.
Figure 2—figure supplement 4.. The double mutant L541F-L631F increases current responses to CBD.
Whole cell patch clamp experiments in HEK293T cells were performed as described in the Materials and methods section. Representative current traces in response to 20 μM CBD and 100 μM 2-APB at 100 mV (upward deflections) and at −100 mV (downward deflections) in cells transfected with (A) wild type TRPV2 and with (B) Leu541Phe-Leu631Phe mutant. (C) Summary of the ratio of currents induced by CBD and 2-APB. Statistical significance was determined by the non-parametric Kolmogorov Smirnov test.
Figure 3.
Figure 3.. Conformational changes upon CBD binding.
(A) Overlay of the TRPV2APO_1 (salmon) and TRPV2CBD_1 (green) structures, aligned to the tetrameric pore (S5–PH–S6). (B) Zoom view from the intracellular side of the membrane on the overlay between TRPV2APO_1 (salmon) and TRPV2CBD_1 (green) structures. (C) Overlay of one ARD from the TRPV2APO_1 (salmon) and TRPV2CBD_1 (green) structures with helices displayed as cylinders. (D) Overlay of the TRPV2APO_1 (salmon) and TRPV2CBD_2 (blue) structures, aligned to the tetrameric pore (S5–PH–S6). (E) Zoom view from the intracellular side of the membrane on the overlay between TRPV2APO_1 (salmon) and TRPV2CBD_2 (blue) structures. (F) Overlay of one ARD in the TRPV2APO_1 (salmon) and TRPV2CBD_2 (blue) structures with helices displayed as cylinders. Residues of interest are represented as sticks and labeled. Red arrows indicate the junction between the S4-S5 linker and S5. Dashed black lines are references to indicate rotation. The measurements for rotation and lateral shifts are labeled and indicated with black arrows.
Figure 3—figure supplement 1.
Figure 3—figure supplement 1.. Cryo-EM map density around the S4-S5 linker, S5, and the TRP helices.
Density for (A) TRPV2APO_1 (salmon), (B) TRPV2APO_2 (purple), (C) TRPV2CBD_1 (green), and (D) TRPV2CBD_2 (blue) is contoured to σ = 5. The view of the S4-S5 linker and S5 is from a single monomer. The TRP helix tetramer is viewed from the intracellular side of the membrane.
Figure 3—figure supplement 2.
Figure 3—figure supplement 2.. Cryo-EM maps highlighting the CTD and NTD.
Cryo-EM maps showing the overall channel in gray with the NTD and CTD highlighted. (A) Cryo-EM map of TRPV2APO_1 with density for the NTD colored salmon. (B) Cryo-EM map of TRPV2APO_2 with density for the NTD colored purple. (C) Cryo-EM map of TRPV2CBD_1 with density for the NTD colored green. (D) Cryo-EM map of TRPV2CBD_2 with density for the CTD colored blue. A red circle indicates the end of the CTD in TRPV2APO_1, TRPV2APO_2, and TRPV2CBD_1.
Figure 3—figure supplement 3.
Figure 3—figure supplement 3.. Cryo-EM map density around the CTD and NTD of TRPV2APO_1 and TRPV2CBD_2.
Model representation of the distal CTDs of (A) left panel) TRPV2APO_1 (salmon) and (B) left panel) TRPV2CBD_2 (blue). This view is of the back of the region indicated by the black square on the overall models (A–B) center panels). Model representation of the distal NTD of (A) right panel) TRPV2APO_1 (salmon) and the distal CTD of (B) right panel) TRPV2CBD_2 (blue). This view is of the front of the region indicated by the black square on the overall models (A–B) center panels). Chain A of each model is colored salmon (TRPV2APO_1) or blue (TRPV2CBD_2). For both models, the adjacent chain B is colored wheat. Residues of interest are represented as sticks. Cryo-EM map density is contoured to σ = 5.
Figure 4.
Figure 4.. Conformational changes between apo TRPV2 states.
(A) Overlay of the TRPV2APO_1 (salmon) and TRPV2APO_2 (purple) selectivity filter, viewed from the extracellular side of the membrane. (B) Zoom view of the overlay at S5-PH-S6. (C) Overlay of the TRPV2APO_1 (salmon) and TRPV2APO_2 (purple) structures, viewed from the extracellular side of the membrane. (D) Zoom view from the intracellular side of the membrane of the overlay of the TRPV2APO_1 (salmon) and TRPV2APO_2 (purple) structures. Residues of interest are represented as sticks and labeled. Dashed black lines are references to indicate rotation. The measurements for rotation and lateral shifts are labeled and indicated with black arrows.
Figure 4—figure supplement 1.
Figure 4—figure supplement 1.. Cryo-EM map density around the selectivity filter of TRPV2APO_1 and TRPV2APO_2.
Density for (A) TRPV2APO_1 (salmon) and (B) TRPV2APO_2 (purple) is contoured to σ = 5. The selectivity filter is viewed from the extracellular side of the membrane. Residues of interest are represented as sticks.
Figure 4—figure supplement 2.
Figure 4—figure supplement 2.. Conformational changes at the selectivity filter between TRPV1 apo and DkTx/RTX-bound structures in nanodiscs.
(A) Overlay of the TRPV1 apo state (PDB 5IRZ, gray) and TRPV1 DkTx/RTX-bound state (PDB 5IRX, orange) selectivity filter, viewed from the extracellular side of the membrane. (B) Zoom view of the overlay at S5-PH-S6. Residues of interest are represented as sticks and labeled. Shifts are with black arrows.

Similar articles

  • Structural insights into TRPV2 activation by small molecules.
    Pumroy RA, Protopopova AD, Fricke TC, Lange IU, Haug FM, Nguyen PT, Gallo PN, Sousa BB, Bernardes GJL, Yarov-Yarovoy V, Leffler A, Moiseenkova-Bell VY. Pumroy RA, et al. Nat Commun. 2022 Apr 28;13(1):2334. doi: 10.1038/s41467-022-30083-3. Nat Commun. 2022. PMID: 35484159 Free PMC article.
  • Cannabidiol sensitizes TRPV2 channels to activation by 2-APB.
    Gochman A, Tan XF, Bae C, Chen H, Swartz KJ, Jara-Oseguera A. Gochman A, et al. Elife. 2023 May 18;12:e86166. doi: 10.7554/eLife.86166. Elife. 2023. PMID: 37199723 Free PMC article.
  • Structure of the full-length TRPV2 channel by cryo-EM.
    Huynh KW, Cohen MR, Jiang J, Samanta A, Lodowski DT, Zhou ZH, Moiseenkova-Bell VY. Huynh KW, et al. Nat Commun. 2016 Mar 29;7:11130. doi: 10.1038/ncomms11130. Nat Commun. 2016. PMID: 27021073 Free PMC article.
  • Determining the Crystal Structure of TRPV6.
    Saotome K, Singh AK, Sobolevsky AI. Saotome K, et al. In: Kozak JA, Putney JW Jr, editors. Calcium Entry Channels in Non-Excitable Cells. Boca Raton (FL): CRC Press/Taylor & Francis; 2018. Chapter 14. In: Kozak JA, Putney JW Jr, editors. Calcium Entry Channels in Non-Excitable Cells. Boca Raton (FL): CRC Press/Taylor & Francis; 2018. Chapter 14. PMID: 30299652 Free Books & Documents. Review.
  • Pharmacological effects of cannabidiol by transient receptor potential channels.
    Etemad L, Karimi G, Alavi MS, Roohbakhsh A. Etemad L, et al. Life Sci. 2022 Jul 1;300:120582. doi: 10.1016/j.lfs.2022.120582. Epub 2022 Apr 26. Life Sci. 2022. PMID: 35483477 Review.

Cited by

References

    1. Adams PD, Grosse-Kunstleve RW, Hung LW, Ioerger TR, McCoy AJ, Moriarty NW, Read RJ, Sacchettini JC, Sauter NK, Terwilliger TC. PHENIX: building new software for automated crystallographic structure determination. Acta Crystallographica Section D Biological Crystallography. 2002;58:1948–1954. doi: 10.1107/S0907444902016657. - DOI - PubMed
    1. Badheka D, Borbiro I, Rohacs T. Transient receptor potential melastatin 3 is a phosphoinositide-dependent ion channel. The Journal of General Physiology. 2015;146:65–77. doi: 10.1085/jgp.201411336. - DOI - PMC - PubMed
    1. Cao E, Liao M, Cheng Y, Julius D. TRPV1 structures in distinct conformations reveal activation mechanisms. Nature. 2013;504:113–118. doi: 10.1038/nature12823. - DOI - PMC - PubMed
    1. De Petrocellis L, Vellani V, Schiano-Moriello A, Marini P, Magherini PC, Orlando P, Di Marzo V. Plant-Derived cannabinoids modulate the activity of transient receptor potential channels of ankyrin Type-1 and melastatin Type-8. Journal of Pharmacology and Experimental Therapeutics. 2008;325:1007–1015. doi: 10.1124/jpet.107.134809. - DOI - PubMed
    1. De Petrocellis L, Orlando P, Moriello AS, Aviello G, Stott C, Izzo AA, Di Marzo V. Cannabinoid actions at TRPV channels: effects on TRPV3 and TRPV4 and their potential relevance to gastrointestinal inflammation. Acta Physiologica. 2012;204:255–266. doi: 10.1111/j.1748-1716.2011.02338.x. - DOI - PubMed

Publication types