. 2019 Oct 3;179(2):470-484.e21.
doi: 10.1016/j.cell.2019.08.037. Epub 2019 Sep 19.

Organization of Chromatin by Intrinsic and Regulated Phase Separation

Affiliations

Organization of Chromatin by Intrinsic and Regulated Phase Separation

Bryan A Gibson et al. Cell. .

Abstract

Eukaryotic chromatin is highly condensed but dynamically accessible to regulation and organized into subdomains. We demonstrate that reconstituted chromatin undergoes histone tail-driven liquid-liquid phase separation (LLPS) in physiologic salt and when microinjected into cell nuclei, producing dense and dynamic droplets. Linker histone H1 and internucleosome linker lengths shared across eukaryotes promote phase separation of chromatin, tune droplet properties, and coordinate to form condensates of consistent density in manners that parallel chromatin behavior in cells. Histone acetylation by p300 antagonizes chromatin phase separation, dissolving droplets in vitro and decreasing droplet formation in nuclei. In the presence of multi-bromodomain proteins, such as BRD4, highly acetylated chromatin forms a new phase-separated state with droplets of distinct physical properties, which can be immiscible with unmodified chromatin droplets, mimicking nuclear chromatin subdomains. Our data suggest a framework, based on intrinsic phase separation of the chromatin polymer, for understanding the organization and regulation of eukaryotic genomes.

Keywords: BRD4; acetylation; chromatin organization; epigenetics; genome; histone; histone H1; nucleosome; nucleosome spacing; phase separation.


Conflict of interest statement

DECLARATION OF INTERESTS

M.K.R. is a consultant with Third Rock Ventures.

Figures

Figure 1.
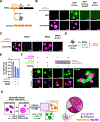
Figure 1.. Phase separation of reconstituted chromatin in physiologic salt.
(A) Assembly of a dodecameric nucleosomal array (chromatin, unless otherwise stated) labeled with a fluorophore (magenta). (B) Fluorescence microscopy images of chromatin labeled on histone H2A with Atto565 (magenta) and dsDNA stained with YOYO-1 (green), following addition of cationic salts. (C) Phase diagram of chromatin (46 base pair internucleosome linker length) under varying conditions. Magenta circles indicate LLPS. Gray scale in each circle indicates coefficient of variation (CV) value calculated from representative images following titration of potassium acetate (KOAc) and either Mg(OAc)2 (top) or chromatin (bottom). (D) Fluorescence microscopy images of chromatin labeled with Alexa Fluor 594 (AF594) with different numbers of nucleosomes at identical total nucleosome concentration (100 nM). (E) (left) Structure of “intact” and “tail-less” nucleosome core particles (PDBID: 1AOI), with and without N-terminal histone tails, respectively. (right) Fluorescence microscopy images of AF594-labeled chromatin following 30 minutes of trypsin digestion. Scale bars, in orange and white, are 4 and 10 μm, respectively.
Figure 2.
Figure 2.. Chromatin droplets are highly concentrated and liquid-like.
(A) Graphical depiction of nucleosome concentrations within chromatin droplets formed by chromatin with 46 base pair internucleosomal linker lengths. See Figs. S3E–G for details. (B) Microscopy images of fluorescence recovery following partial photobleaching of AF594-labeled chromatin droplets. (C) Quantification of average relative fluorescence intensity and its initial rate of change both inside (black, kin) and outside (grey, kout) the area of photobleach across 6 individual chromatin droplets. Error bars and ± error are standard deviation. (D) Experimental workflow for two-color droplet mixing assay. (E) Fluorescence microscopy images of chromatin droplets labeled with either Alexa Fluor 488 (AF488) or AF594 fusing. Scale bars, in orange and white, are 4 and 10 μm, respectively.
Figure 3.
Figure 3.. The C-terminal domain of histone H1 promotes phase separation of chromatin with altered material properties.
(A) Coomassie brilliant blue-stained SDS-PAGE gel of proteins in supernatant (sup.) or pellet following sedimentation of chromatin droplets containing bovine linker histones. (B) Fluorescence microscopy of AF594-labeled chromatin following titration of potassium acetate with (bottom) or without (top) bovine linker histones. Enumeration of pixel intensities is indicated below each buffering condition and orange arrows indicate stalled droplet fusion intermediates. (C) Microscopy images of fluorescence recovery of AF594-labeled chromatin in the presence of bovine linker histones following partial droplet photobleaching. (D) Schematic depicting approximate nucleosome binding sites of LANA peptide (teal) and histone H1 (blue) relative to the nucleosome core particle (PDBID: 1AOI). (E) Microscopy images of GFP fusion proteins of human histone H1.4, LANA peptide, and H1.4 fragments bound to AF594-labeled chromatin droplets before and after partial droplet photobleaching. Images were processed separately for each experimental condition. So unlike data for panel G, relative brightness is not comparable between conditions. (F) Quantitation of relative fluorescence recovery of GFP fusion proteins (above) and AF594-labeled H2B (below) following partial droplet photobleaching. (G) Quantification of relative fluorescence intensity of droplets of chromatin alone and in the presence of bovine linker histones, or unlabeled recombinant human histone H1.4, LANA peptide, or H1.4-fragments. Error bars indicate standard deviation (N = 6 droplets in each case). Scale bars are 10 m.
Figure 4.
Figure 4.. Physiologic spacing of nucleosomes drives LLPS of chromatin and modulates chromatin droplet density.
(A) Genome-wide analyses of internucleosome linker lengths in yeast (black) and mouse ES cells (gray) at base pair resolution. (B) Data in (A) following LOESS normalization to quantify the extent of linker length bias. (C) End orientation trajectories (5’ to 3’ of terminal phosphates) of idealized B-form DNA with 10n+5 or 10n base pair distances. (D) Fluorescence microscopy images of AF594-labelled chromatin (0.5 μM nucleosome) with the indicated internucleosome linker lengths (10n+5 series above, 10n series, below), following addition of 150 mM KOAc. (E) Graphical depiction of internucleosome linker length and linker histone expression differences between mouse and yeast. (F) Fluorescence intensity within droplets (n=6) composed of 10n+5-spaced chromatin with different internucleosome linker lengths both with and without binding of bovine linker histone H1. Nucleosome length for analysis is assumed to be 147 bp and scale bars are 10 μm.
Figure 5.
Figure 5.. Histone acetylation dissolves chromatin droplets.
(A) A TetO-containing chromatin and small-molecule modulated model transactivating protein GFP-TetR-p300HAT. (B) Fluorescence microscopy images of AF594-labeled chromatin (magenta) and GFP fused to either the model transcription factor TetR (GFP-TetR) or TetR fused to the catalytic domain of p300 (GFP-TetR-p300HAT) (both green) including doxycycline (Dox) and/or AcetylCoA. (C) (top) Western blot of histone H3K27 acetylation following addition of doxycycline and/or AcetylCoA to TetO-containing chromatin composed of wild-type or basic-patch mutant histones in the presence of GFP-TetR-p300HAT and 150 mM KOAC. (bottom) Coomassie brilliant blue-stained SDS-PAGE gel of core histone proteins. (D) Fluorescence microscopy of AF594-labeled chromatin (magenta) and GFPTetR-p300HAT (green) following addition of AcetylCoA. (E) Mean droplet circularity and pixel intensity of AF594-labeled chromatin droplets in the presence of GFP-TetR-p300HAT following addition of AcetylCoA. Error bars indicate standard error. Scale bars, in orange and white, are 4 and 10 μm, respectively.
Figure 6.
Figure 6.. Nucleosomal arrays form condensates in the nucleus of cells.
(A) Nuclear microinjection of fluorophore-labeled nucleosomal arrays into cultured cells. (B) (left) Confocal live-cell fluorescence microscopy of Hoechst 33342 DNA stained HeLa cell nuclei injected with (middle) unmodified nucleosomal arrays (green) and acetylated nucleosomal arrays (magenta). (right) Close up view of DNA, unmodified arrays, and acetylated nucleosomal arrays from orange dotted box of confocal fluorescence microscopy image. (C) Spatial correlation of mean fluorescence intensity from 31 cells across two biological replicates between Hoechst 33342 DNA stain and either unmodified AF488-labeled arrays or acetylated AF594-labeled arrays. (D) Confocal live-cell fluorescence microscopy of unmodified nucleosomal arrays and acetylated nucleosomal arrays injected into Hoechst 33342-stained HeLa cell nuclei following 3 hours of treatment with Trichostatin A. Quantitation from 42 cells (mean fluor. > 0.5 AU) across two biological replicates (E) mean nuclear fluorescence and coefficient of variation (CV) (F) for injected unmodified and acetylated nucleosomal arrays in the nuclei.
Figure 7.
Figure 7.. BRD4 promotes a new liquid phase of acetylated chromatin.
(A) Schematic illustration of the domain organization of BRD4 and bromo5 and their JQ-1-sensitive interactions with acetyllysine. (B) and (C) Fluorescence microscopy images of AF594-labeled chromatin (magenta) without and with acetylation by the catalytic domain of p300HAT and (B) with synthetic GFP-labeled bromodomain-containing proteins and (C) with BRD4 without and with JQ-1. (D) Schematic depicting the effects of BRD4 on nonacetylated and acetylated chromatin. (E) Relative H2B fluorescence intensity of chromatin droplets composed of chromatin alone and BRD4 or bromo5 and acetylated chromatin. (F) Fluorescence microscopy of unmodified AF594-labeled chromatin mixed in stoichiometric quantities of either unmodified or acetylated AF488-labeled chromatin with and without unlabeled bromo5. Scale bars are 10 μm. (G) Model for phase separation-based organization of chromatin in nuclei.

Similar articles

Cited by

References

    1. Allahverdi A, Yang R, Korolev N, Fan Y, Davey CA, Liu CF, and Nordenskiold L (2011). The effects of histone H4 tail acetylations on cation-induced chromatin folding and self-association. Nucleic acids research 39, 1680–1691. - PMC - PubMed
    1. Amendola M, and van Steensel B (2015). Nuclear lamins are not required for lamina-associated domain organization in mouse embryonic stem cells. EMBO reports 16, 610–617. - PMC - PubMed
    1. Balleza E, Kim JM, and Cluzel P (2018). Systematic characterization of maturation time of fluorescent proteins in living cells. Nature methods 15, 47–51. - PMC - PubMed
    1. Banani SF, Lee HO, Hyman AA, and Rosen MK (2017). Biomolecular condensates: organizers of cellular biochemistry. Nature reviews Molecular cell biology 18, 285–298. - PMC - PubMed
    1. Bass MV, Nikitina T, Norouzi D, Zhurkin VB, and Grigoryev SA (2019). Nucleosome spacing periodically modulates nucleosome chain folding and DNA topology in circular nucleosome arrays. The Journal of biological chemistry 294, 4233–4246. - PMC - PubMed

Publication types