

Racial/Ethnic Disparities in the Prevalence of Diabetes and Prediabetes by BMI: Patient Outcomes Research To Advance Learning (PORTAL) Multisite Cohort of Adults in the U.S
- PMID: 31537541
- PMCID: PMC6868463
- DOI: 10.2337/dc19-0532
Racial/Ethnic Disparities in the Prevalence of Diabetes and Prediabetes by BMI: Patient Outcomes Research To Advance Learning (PORTAL) Multisite Cohort of Adults in the U.S
Abstract
Objective: To examine racial/ethnic disparities in the prevalence of diabetes and prediabetes by BMI category.
Research design and methods: In a consortium of three U.S. integrated health care systems, 4,906,238 individuals aged ≥20 years during 2012-2013 were included. Diabetes and prediabetes were ascertained by diagnosis and laboratory results; antihyperglycemic medications were also included for diabetes ascertainment.
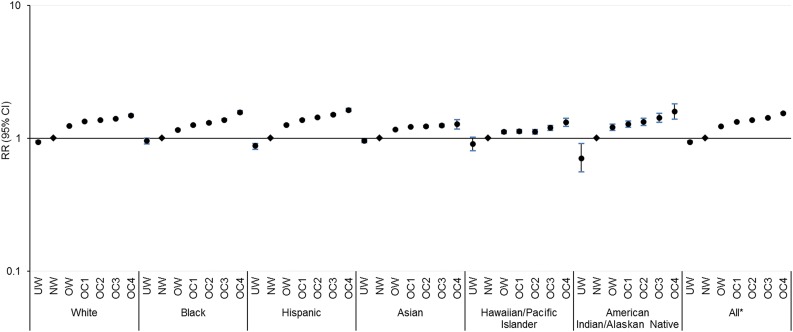
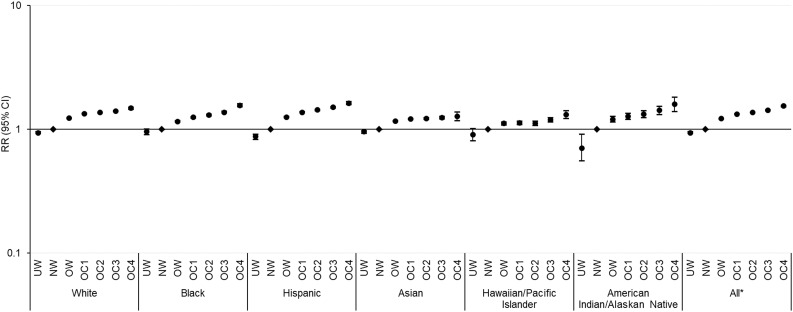
Results: The age-standardized diabetes and prediabetes prevalence estimates were 15.9% and 33.4%, respectively. Diabetes but not prediabetes prevalence increased across BMI categories among all racial/ethnic groups (P for trend < 0.001). Racial/ethnic minorities reached a given diabetes prevalence at lower BMIs than whites; Hawaiians/Pacific Islanders and Asians had a diabetes prevalence of 24.6% (95% CI 24.1-25.2%) in overweight and 26.5% (26.3-26.8%) in obese class 1, whereas whites had a prevalence of 23.7% (23.5-23.8%) in obese class 2. The age-standardized prediabetes prevalence estimates in overweight among Hispanics (35.6% [35.4-35.7%]), Asians (38.1% [38.0-38.3%]), and Hawaiians/Pacific Islanders (37.5% [36.9-38.2%]) were similar to those in obese class 4 among whites (35.3% [34.5-36.0%]), blacks (36.8% [35.5-38.2%]), and American Indians/Alaskan Natives (34.2% [29.6-38.8%]). In adjusted models, the strength of association between BMI and diabetes was highest among whites (relative risk comparing obese class 4 with normal weight 7.64 [95% CI 7.50-7.79]) and lowest among blacks (3.16 [3.05-3.27]). The association between BMI and prediabetes was less pronounced.
Conclusions: Racial/ethnic minorities had a higher burden of diabetes and prediabetes at lower BMIs than whites, suggesting the role of factors other than obesity in racial/ethnic disparities in diabetes and prediabetes risk and highlighting the need for tailored screening and prevention strategies.
© 2019 by the American Diabetes Association.
Figures
Comment in
-
Diabetes in Normal-Weight Individuals: High Susceptibility in Nonwhite Populations.Diabetes Care. 2019 Dec;42(12):2164-2166. doi: 10.2337/dci19-0046. Diabetes Care. 2019. PMID: 31748211 Free PMC article. No abstract available.
Similar articles
-
Secular and race/ethnic trends in glycemic outcomes by BMI in US adults: The role of waist circumference.Diabetes Metab Res Rev. 2017 Jul;33(5). doi: 10.1002/dmrr.2889. Epub 2017 Mar 24. Diabetes Metab Res Rev. 2017. PMID: 28198145
-
Associations of overweight/obesity and socioeconomic status with hypertension prevalence across racial and ethnic groups.J Clin Hypertens (Greenwich). 2018 Mar;20(3):532-540. doi: 10.1111/jch.13217. Epub 2018 Feb 12. J Clin Hypertens (Greenwich). 2018. PMID: 29432662 Free PMC article.
-
Screening and Interventions for Childhood Overweight [Internet].Rockville (MD): Agency for Healthcare Research and Quality (US); 2005 Jul. Rockville (MD): Agency for Healthcare Research and Quality (US); 2005 Jul. PMID: 20722132 Free Books & Documents. Review.
-
Changes in racial/ethnic disparities in the prevalence of Type 2 diabetes by obesity level among US adults.Ethn Health. 2009 Oct;14(5):439-57. doi: 10.1080/13557850802699155. Ethn Health. 2009. PMID: 19360513 Free PMC article.
-
Behavioral and Pharmacotherapy Weight Loss Interventions to Prevent Obesity-Related Morbidity and Mortality in Adults: An Updated Systematic Review for the U.S. Preventive Services Task Force [Internet].Rockville (MD): Agency for Healthcare Research and Quality (US); 2018 Sep. Report No.: 18-05239-EF-1. Rockville (MD): Agency for Healthcare Research and Quality (US); 2018 Sep. Report No.: 18-05239-EF-1. PMID: 30354042 Free Books & Documents. Review.
Cited by
-
Anti-Inflammatory Properties In Vitro and Hypoglycaemic Effects of Phenolics from Cultivated Fruit Body of Phellinus baumii in Type 2 Diabetic Mice.Molecules. 2021 Apr 15;26(8):2285. doi: 10.3390/molecules26082285. Molecules. 2021. PMID: 33920885 Free PMC article.
-
Determinants of Metabolic Syndrome and Type 2 Diabetes in the Absence of Obesity: The Jackson Heart Study.J Endocr Soc. 2022 Apr 9;6(6):bvac059. doi: 10.1210/jendso/bvac059. eCollection 2022 Jun 1. J Endocr Soc. 2022. PMID: 35528825 Free PMC article.
-
Effect of the interaction between physical activity and estimated macronutrient intake on HbA1c: population-based cross-sectional and longitudinal studies.BMJ Open Diabetes Res Care. 2022 Jan;10(1):e002479. doi: 10.1136/bmjdrc-2021-002479. BMJ Open Diabetes Res Care. 2022. PMID: 34980592 Free PMC article.
-
Nontargeted and Targeted Metabolomic Profiling Reveals Novel Metabolite Biomarkers of Incident Diabetes in African Americans.Diabetes. 2022 Nov 1;71(11):2426-2437. doi: 10.2337/db22-0033. Diabetes. 2022. PMID: 35998269 Free PMC article.
-
Gestational Diabetes and Overweight/Obesity: Analysis of Nulliparous Women in the U.S., 2011-2019.Am J Prev Med. 2021 Dec;61(6):863-871. doi: 10.1016/j.amepre.2021.05.036. Epub 2021 Aug 24. Am J Prev Med. 2021. PMID: 34446313 Free PMC article.
References
-
- Centers for Disease Control and Prevention National Diabetes Statistics Report, 2017: estimates of diabetes and its burden in the United States. Atlanta, GA, Department of Health and Human Services, Centers for Disease Control and Prevention, 2017
-
- Lanting LC, Joung IM, Mackenbach JP, Lamberts SW, Bootsma AH. Ethnic differences in mortality, end-stage complications, and quality of care among diabetic patients: a review. Diabetes Care 2005;28:2280–2288 - PubMed
-
- Koh HK, Graham G, Glied SA. Reducing racial and ethnic disparities: the action plan from the department of health and human services. Health Aff (Millwood) 2011;30:1822–1829 - PubMed
-
- Mendola ND, Chen TC, Gu Q, Eberhardt MS, Saydah S. Prevalence of total, diagnosed, and undiagnosed diabetes among adults: United States, 2013-2016. NCHS Data Brief 2018:1–8 - PubMed
Publication types
MeSH terms
Grants and funding
LinkOut - more resources
Full Text Sources
Medical
