. 2019 Sep;573(7775):539-545.
doi: 10.1038/s41586-019-1563-y. Epub 2019 Sep 18.

Electrical and synaptic integration of glioma into neural circuits

Affiliations

Electrical and synaptic integration of glioma into neural circuits

Humsa S Venkatesh et al. Nature. 2019 Sep.

Abstract

High-grade gliomas are lethal brain cancers whose progression is robustly regulated by neuronal activity. Activity-regulated release of growth factors promotes glioma growth, but this alone is insufficient to explain the effect that neuronal activity exerts on glioma progression. Here we show that neuron and glioma interactions include electrochemical communication through bona fide AMPA receptor-dependent neuron-glioma synapses. Neuronal activity also evokes non-synaptic activity-dependent potassium currents that are amplified by gap junction-mediated tumour interconnections, forming an electrically coupled network. Depolarization of glioma membranes assessed by in vivo optogenetics promotes proliferation, whereas pharmacologically or genetically blocking electrochemical signalling inhibits the growth of glioma xenografts and extends mouse survival. Emphasizing the positive feedback mechanisms by which gliomas increase neuronal excitability and thus activity-regulated glioma growth, human intraoperative electrocorticography demonstrates increased cortical excitability in the glioma-infiltrated brain. Together, these findings indicate that synaptic and electrical integration into neural circuits promotes glioma progression.


Conflict of interest statement

The authors declare the following competing interests: MM is an SAB member of Cygnal Therapeutics. AR is a founder and equity holder of Celsius Therapeutics and an SAB member of ThermoFisher Scientific and Syros Pharmaceuticals.

Figures
Extended Data Figure 1:
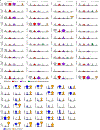
Extended Data Figure 1:. Synaptic gene expression in single cell primary glioma and patient-derived xenografts
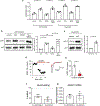
a, Primary human biopsy single cell transcriptomic data illustrating synapse associated and ion-channel gene expression in H3K27M+ diffuse midline glioma (DMG; grey, n=2,259 cells/6 subjects), IDHwt adult high-grade glioma (red, n=599 cells/3 subjects), IDHmut adult high-grade glioma (purple, n=5,096 cells/10 subjects) malignant cells, and tumor-associated, non-malignant immune cells (green; n=96 cells/5 subjects) and oligodendrocytes (yellow; n=232 cells). b, As in (a) for single cell transcriptomic analysis of H3K27M+ DMG xenograft models (SU-DIPVI, blue and SU-DIPGXIII-FL, yellow) illustrating broad synaptic gene expression similar to that found in primary DMG tissue samples as shown in Fig. 1a. For each individual violin plot, y-axis represents log2 TPM (transcripts per million), and x-axis represents number of individual cells with indicated expression value.
Extended Data Figure 2:
Extended Data Figure 2:. Synaptic gene expression and structural synapses in glioma
a, Plot of the lineage (x-axis) and stemness (y-axis) scores for H3K27M+ DMG malignant single cells (dots) sorted from patient-derived glioma xenograft models (SU-DIPG-VI and SU-DIPG-XIII-FL). Overlay of grey-red enrichment score indicates relative score for OPC-like genes (left) and synapse-related genes (right; n=335/4 cells/mice; pearson correlation rho=0.57, P<0.0001). b, Plot of the lineage vs. stemness scores for H3K27M+ DMG malignant single cells in (a), colored by xenograft model. Red=SU-DIPGXIII-FL, blue=SU-DIPGVI. Though each xenograft model clearly contains cells across all lineages, SU-DIPGXIII-FL has a prominent astrocyte-like cell population, while SU-DIPGVI has a prominent OPC-like population. c, Unbiased principal component analysis of single cell gene expression from an individual patient primary biopsy sample of H3K27M+ glioma (BCH869) reveals cellular clusters that resemble proliferating cells (cell-cycle), OPCs (OPC-like), astrocytes (AC-like) and mixed astroglial/oligodendroglial cells (AC/OC). Synaptic gene enrichment for individual cells shown below and co-localizes in the OPC-like cluster. d, Electron microscopy of primary adult glioblastoma tumor sample illustrating clear synaptic structure. Scale bar, 500μm. e, Original (non-pseudo-colored) immuno-EM images shown in Fig.1c. f, Additional examples of neuron:glioma synapses identified by immuno-electron microscopy in patient-derived xenografts of SU-DIPGVI and SU-DIPGXIII-FL (n=3 mice/group). Arrowheads indicate immuno-gold particle labeling of GFP. Scale bar, 200μm. g, Quantification of neuron:glioma synaptic structures in SU-DIPGVI (n=101 sections) and SU-DIPGXIII-FL (n=104 sections) xenografts. For each individual violin plot, y-axis represents number of identified unambiguous neuron:glioma synapses in each section, x-axis represents number of individual cells with indicated value. h, Quantification of colocalized post-synaptic glioma-derived PSD95-RFP with pre-synaptic synapsin in co-cultures of SU-DIPGXIII-FL glioma cells with WT or Nlgn3y/− neurons (NL3KO; n=21 cells in 10 coverslips/group). Data shown as mean ± s.e.m. P-values determined by two-sided Mann-Whitney test. **** P < 0.0001.
Extended Data Figure 3:
Extended Data Figure 3:. Mitogenic effects of NLGN3 are independent from AMPAR signaling and properties of glioma AMPARs
a, Proliferative response of GFP (control) and GluA2-dominant negative subunit expressing glioma cells (GluA2-DN) after 24-hour exposure to soluble extracellular neuroligin-3 (NLGN3; 100nm) in the presence and absence of AMPA-receptor blocker, NBQX (10μM). b, Western blot analysis of phospho-AKT (Ser473) and total AKT in GFP (control) glioma cells in response to 5-minute exposure of soluble extracellular neuroligin-3 (NLGN3; 100nm) in the presence and absence of AMPA-receptor blocker, NBQX (10μM); left. Quantitative analysis of the ratio of pAKT/AKT normalized to vehicle (right). c, Western blot analysis of phospho-AKT (Ser473) and total AKT in GluA2-DN expressing glioma cells in response to 5-minute exposure of soluble extracellular neuroligin-3 (NLGN3; 100nm; left). Quantitative analysis of the ratio of pAKT/AKT normalized to vehicle (right). d, Time course of evoked glioma cell EPSC block by NASPM (100 μM, duration=red bar (n=7/5 cells/mice; left); Representative trace before (black) and after (red) addition of NASPM (right). e, Quantification of (d). f, GluA2 subunit Q/R editing efficiency in SU-DIPGXIII-FL and SU-DIPGVI cells as measured by PCR and expressed as % edited. g, Expression of ADAR1, the enzyme responsible for Q/R editing of GluA2 mRNA. Plot illustrates ADAR1 enzyme mRNA expression relative to beta-actin as measured by qPCR. Analyses in a,b,c,f,g were calculated from three independent sets of cells. Data shown as mean ± s.e.m. P values determined by one-way ANOVA with Tukey’s post-hoc analysis (a,b), by two-tailed Student’s t-test (c), by two-tailed paired Student’s t-test (e). All data shown as mean ± s.e.m. *P<0.01, **P<0.001, ***P<0.001, ****P<0.0001, NS = not significant.
Extended Data Figure 4:
Extended Data Figure 4:. Glioma xenograft calcium imaging with GCaMP6
a, Confocal micrographs of xenografted SU-DIPGXIII-FL cells expressing GCaMP6s-tdTomato into the hippocampus stained with DAPI (blue), human nuclear antigen (HNA, green), and TdTomato nuclear tag (red). Merged image shown on the right illustrates specificity of Tdtomato tag to HNA+ cells. Scale bar = 20μm for all images. Immunostaining independently replicated in three mice. b, Spontaneous calcium transients in SU-DIPGVI xenograft visualized by two-photon in situ calcium imaging. Representative frames shown with red = glioma td-Tomato nuclear tag; green = GCaMP6s in glioma cells. Scale bar = 50μm; n=5 mice. See also Supplementary Video 1. c, Trace of normalized GCaMP6s intensity over time in an individual xenografted glioma (SU-DIPGVI) cell exhibiting an oscillatory spontaneous transient. Data plotted as ρF/Fo. Results were replicated across n=3 mice. d, As in (c), trace of normalized GCaMP6s intensity over time in an individual xenografted glioma (SU-DIPGXIII-FL) cell exhibiting a less regular spontaneous transient. This type of transient is more frequently observed in glioma xenografts. Data plotted as ρF/Fo. Results were replicated across n=3 mice. e, Individual xenografted glioma (SU-DIPGXIII-FL) cellular responses to axonal stimulation before and after application of tetrodotoxin (0.5μM) as measured by GCaMP6s intensity. Data plotted as ρFmax/Fo; n=40/4 cells/mice. P-values determined by one-tailed Wilcoxon matched-pairs signed rank test. **** P < 0.0001.
Extended Data Figure 5:
Extended Data Figure 5:. Prolonged glioma currents and pediatric glioma tumor microtubes
a, Time course of prolonged current block by NASPM (100μM; duration=red bar; n=8/5 cells/mice. Data are means ± s.e.m. (left); Representative traces of evoked prolonged current (block) unaffected by NASPM (red). b, Quantification of (a). P values determined by two-tailed paired Student’s t-test. NS = not significant. c, Alignment of phase-locked simultaneous recording of glioma prolonged potential with the field potential of firing neuronal population. d, Representative prolonged current traces with increasing stimulation intensity. Maximum intensity, red; intermediate intensities, blue and green (inset). Zoomed-in view illustrates distinct spike-like waveforms consistent with response to neuronal population firing. e, Relationship of extracellular field potential to magnitude of prolonged current (SU-DIPGXIII-FL xenograft) illustrated by simultaneous field potential (fEPSP) and whole-cell glioma current-clamp recordings. f, Prolonged glioma potential amplitudes vs. slope of fEPSPs elicited by electrical stimulation (10, 20, 30, 50, 70, 100 and 150 μA; R2= 0.92; n=14/4 cells:fields/mice for each except n=11/3 cells:fields/mice for 30 μA). g, Representative trace of potassium (K+)-induced prolonged current in SU-DIPGXIII-FL xenografts (n=9/2 cells/mice). h, Effect of TBOA on prolonged current in glioma (SU-DIPGXIII-FL). (1) Representative trace of residual current left after application with D-AP5 + NBQX in prolonged response to stimulation (top). D-AP5 + NBQX likely reduces the prolonged current due to the effect on CA1 pyramidal neurons, not through direct effect on the glioma cells themselves; (2) Representative trace of residual current after trace 1 was then treated with glutamate transporter blocker, 200μM TBOA (middle); (1 minus 2) Subtraction of trace 2 from trace 1 reveals 2pA current, that can be accounted for by TBOA. It should be noted that a small residual current remains (bottom; n=5/2 cells/mice). i, Synchronicity analysis of calcium peaks in glioma cells in Figure 3 shown over the course of 10 minutes. Red lines indicate cells synchronized with one another at various timepoints during indicated period. j-o, Confocal micrographs of primary human glioma tissue samples illustrate density and length of nestin immunopositive tumor microtubes. j-n, primary human tissue samples of pediatric H3K27M+ diffuse midline gliomas of the pons (also known as diffuse intrinsic pontine glioma, DIPG), sampled at the time of autopsy. o, Analysis in a primary tissue sample from an adult glioblastoma (SU-GBM092) illustrates similarity to adult glioma. For all images, blue, DAPI; yellow, nestin; magenta, H3K27M (tumor-specific antigen). Scale bar=20μm, except in (n), scale bar is 10μm. Data independently replicated in three sections per sample.
Extended Data Figure 6:
Extended Data Figure 6:. Prolonged currents in pediatric glioma amplified by gap-junction coupling
a, Input resistance of non-responding and depolarizing cells (n=29 fast EPSC, n=247 prolonged current, n=319 no response). b, Biocytin dye filling illustrates coupling of xenografted glioma cells that exhibit prolonged currents (n=7/2 slices/mice); Red = streptavidin-biocytin; green = GFP. Scale bar, 100μm. c, Prolonged currents in glioma largely blocked by carbenoxolone (CBX, 100μM). Red box highlights zoomed in view of representative trace to illustrate residual slow current after application of CBX. d, Time course of prolonged current in glioma cells (black) and pyramidal cell EPSC (blue) responses to addition of CBX with subsequent washout of inhibitor (duration=red bar; n=6/6 glioma cells/mice; n=5/2, neurons/mice). e, Bar graph with additional data quantifies the drop in current amplitude after addition of CBX (n=19/11 cells/mice; data also shown in Fig.3l). f, Input resistance of cells in (d) in response to CBX. g, Quantification of (f) (n=19/11 cells/mice). h, Time course of prolonged current in glioma in response to addition of meclofenamate (100μM; duration=red bar; n=8/3 cells/mice). i, Quantification of (h); data also shown in Fig.3l; left. Representative traces illustrating block of prolonged current amplitude after addition of meclofenamate (red, right). j, Input resistance of cells in (h) in response to addition of meclofenamate (n=8/3 cells/mice). k, Quantification of (j). l, Representative frames from two photon calcium imaging of in situ SU-DIPGXIII-FL glioma xenografts illustrating spontaneous transients before (top) or after addition of CBX (bottom). Red = tdTomato nuclear tag in glioma cells; green = GCaMP6s. Scale bar, 50μm; Results replicated across 3 mice. m, Synchronicity analyses of spontaneous calcium transients before (top) or after addition of CBX (bottom). n, Representative trace of GCaMP6s peak intensity over time (s) in a single cell before (black) and after addition of CBX (red). Data plotted as ρF/Fo; n=3 mice. o, Synchronicity scores of individual cells within glioma xenograft before and after addition of CBX (n=164 cells across 3 mice). y-axis represents synchronicity score, x-axis represents number of cells with specific score. For a, d, e, f, g, h, i, j, and k, data are shown as means ± s.e.m. P-values determined by one-way ANOVA for (a), and by one-tailed Wilcoxon matched-pairs signed rank test. for (e,g,i,k,o). **P<0.01. ****P<0.0001. NS indicates P > 0.05.
Extended Data Figure 7:
Extended Data Figure 7:. Heterogeneity of glioma cell electrophysiological response and validation of ChR2 and DN-GluA2 function in glioma
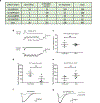
a, Electrophysiological responses by model. Number of whole cell patch clamp recordings from cells in xenografted hippocampal slices separated by electrophysiological response to local electrical stimulation. b, Demonstration of depolarizing inward current in SU-DIPXIII-FL-ChR2 cells in response to single stimulation and 20Hz pulses of blue light as measured in current clamp (top) and voltage clamp (bottom). c, Proliferation index of xenografted SU-DIPGXIII-FL-YFP control glioma cells (no opsin expressed) in response to blue light stimulation or mock stimulation as measured by the proportion of GFP+/HNA+ cells expressing Ki67 24-hours after five optogenetic stimulation sessions (n=3 mice, mock stim; n=4 mice, stim). d, Quantification of cleaved caspase-3 in xenografted SU-DIPGXIII-FL-YFP control glioma cells in response to blue light stimulation or mock stimulation as measured by total number of HNA+ cells co-labeled with cleaved caspase-3 (n=3 mice/group). e, As in (d), quantification of cleaved caspase-3 in xenografted SU-DIPXIII-FL-ChR2 glioma cells (n=3 mice, mock stim; n=4 mice, stim). f, Validation of GluA2-dominative negative AMPA receptor subunit expressing construct. Representative traces of whole-cell voltage-clamp recording of WT (black) and GluA2-DN expressing (grey) SU-DIPGVI cells in response to 500μM (S)-AMPA (n=6 cells). g, Representative traces of whole-cell voltage-clamp recording in WT (black) and GluA2-DN expressing (grey) SU-DIPGXIII-FL cells in response to 500μM (S)-AMPA (n=6 cells). SU-DIPGXIII-FL cells are unable to homogeneously express the dominant construct, and therefore may be connected to WT GluA2 expressing cells, which accounts for the remaining current in the illustrated trace. Incorporation of the GluA2-DN construct thus results in a significantly abrogated AMPAR-dependent depolarization. Data shown as mean ± s.e.m for (c,d,e). All P-values determined by two-tailed Student’s t-test. NS = not significant.
Extended Data Figure 8:
Extended Data Figure 8:. Glioma AMPAR function in vitro, in co-culture and in vivo.
a, Kaplan-Meier survival curves of second cohort of mice orthotopically xenografted with control GFP-only or GluA2-DN-GFP over-expressing cells (SU-DIPGXIII-P* xenograft model; n=5 mice per group). b, Representative coronal sections of mouse brains bearing SU-DIPGXIII-FL xenografts either expressing control GFP construct (left) or GluA2-DN-GFP construct; right). Gray, MBP; White, glioma-GFP. c, Proliferation indices of SU-DIPGXIII-FL cells at baseline in neuronal medium, in response to 10μM NBQX, in co-culture with neurons, or in co-culture with neurons in the presence of 10μM NBQX (n=3 biological replicates/group, except n=4 for baseline). d, Representative images of neuron-glioma co-cultures in the presence and absence of NBQX. Green = neurofilament (neuronal processes); Red = nestin (glioma cell processes); White = Ki67. Scale bar = 50μm. e, in vitro growth analysis of control GFP or GluA2-DN-GFP cells monitored over 3 days. f, in vitro apoptosis analysis of control GFP or GluA2-DN-GFP as measured by % of total cells co-stained with cleaved-caspase. g, 3D Matrigel invasion assay in WT (GFP) and GluA2-DN (GluA2-DN-GFP) expressing SU-DIPGXIII-FL cells 72 hours after seeding. h, Representative images of (g) at time 0 hr (left) and 72 hr (right) in control GFP-expressing (top) and GluA2-DN-GFP expressing cells (bottom). Scale bar = 1000μm. i, 3D migration assay in WT (GFP) and GluA2-DN (GluA2-DN-GFP) expressing SU-DIPGXIII-FL cells 72 hours after seeding. j, Representative images of (i) at time 0 hr (left) and 72 hr (right) in control GFP-expressing (top) and GluA2-DN-GFP expressing cells (bottom). Scale bar =1000μm. k, Representative confocal micrographs illustrating proliferating SU-DIPGVI cells in vehicle or perampanel-treated mice (n=8 mice/group). Red = human nuclei; white = Ki67. Scale bar = 50μm. l, IVIS bioluminescence analysis of overall tumor growth in SU-DIPGXIII-FL xenografts treated with vehicle or meclofenamate over a two-week period. Data represented as fold change in total flux; n=5 mice/group. Data shown as mean ± s.e.m. for (c,e,f,g,i,l). For analyses in (d-j), n=3 biological replicates. P-values determined by two-tailed log rank analyses (a), by one-way ANOVA with post-hoc analysis (c), by two-tailed unpaired Student’s t-test (f,g,i,l). *P<0.05, **P< 0.01,****P<0.0001. NS = not significant.
Extended Data Figure 9:
Extended Data Figure 9:. Hyperexcitability in the glioma microenvironment and working model of neuron-glioma interactions in the tumor microenvironment
a, Individual channel electrocorticography signals (mean high-gamma frequency-filtered power (μV2)) in each of healthy-appearing, tumor core, and tumor-infiltrated brain across three patients (n=23, n=29, n=51 total channels, respectively). b, Working model of glioma integration in neural circuity, with hyperexcitability of neurons (grey) exacerbating activity-dependent mechanisms of glioma (green) growth. 1, Neuron-to-glioma synapses, synaptic vesicles = red; AMPA receptors = grey. 2, Inward potassium (K+) current = blue, potassium channel = grey 3, Gap junction (white) coupling in glioma amplifies current.
Figure 1:
Figure 1:. Transcriptomic and structural evidence for glioma synapses
a, Primary human biopsy single cell transcriptomic data illustrating synapse-associated gene expression levels from H3K27M+ diffuse midline glioma (DMG; grey; n=2,259/6 cells/subjects), IDHwt adult high-grade glioma (red; n=599/3 cells/subjects), IDHmut adult high-grade glioma (purple; n=5,096/10 cells/subjects) malignant cells, and tumor-associated, non-malignant immune cells (green; n=96/5 cells/subjects) and oligodendrocytes (yellow; n=232 cells). For each individual violin plot, y-axis represents log2 TPM (transcripts per million), x-axis represents number of individual cells with indicated expression value, and thick and thin black lines represent interquartile and 1.5x interquartile range, respectively. b, Plot of the lineage (x-axis) and stemness (undifferentiated to differentiated, y-axis) scores for H3K27M+ DMG malignant single cells sorted from primary biopsies (n=2,259 cells). Overlay of grey-red enrichment score indicates relative score for OPC-like genes (left) and synapse-related genes (right; pearson correlation rho=0.47, P<0.0001). c, Immuno-electron microscopy of patient-derived glioma SU-DIPGVI (left) and SU-DIPGXIII-FL (right) xenografts in mouse hippocampus. Immuno-gold particles labeling GFP (white arrowheads). Post-synaptic density in GFP+ tumor cells (pseudo-colored green), synaptic cleft, and clustered synaptic vesicles in apposing presynaptic neuron (pseudo-colored magenta) identify synapses. Scale bar=200μm. g, Quantification of neuron:glioma synaptic structures in SU-DIPGVI and SU-DIPGXIII-FL xenografts expressed as percent of total identified glioma cell processes forming unambiguous synaptic structures (n=3 mice/group; mean±s.e.m). e, Representative confocal image of neurons co-cultured with PSD95-RFP-labeled glioma cells. White box and arrowhead highlight region of synaptic puncta colocalization, zoomed-in view (right). Green=neurofilament (axon); white=nestin (tumor cells); blue=synapsin (pre-synaptic puncta); red=PSD95-RFP (post-synaptic puncta). Scale bars=10μm (left), 2μm (right). f, Quantification of post-synaptic glioma-derived PSD95-RFP colocalized with neuronal pre-synaptic synapsin in co-cultures of glioma cells (SU-DIPGVI) with WT (n=22 cells/10 coverslips) or Nlgn3y/- (NL3KO; n=21 cells/10 coverslips) neurons. Data shown as % colocalization, mean±s.e.m. P-value determined by two-tailed Student’s t-test, ****P<0.0001.
Figure 2:
Figure 2:. Synaptic AMPAR-mediated EPSCs in glioma
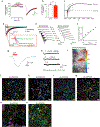
a, Electrophysiological model. GFP+ glioma cells (green) xenografted in mouse hippocampus CA1 region with Schaffer collateral afferent stimulation (left). Right, representative hippocampal slice micrograph, GFP+ glioma cells=green, MAP2=white, n=8 biological replicates. b, Representative micrograph of patched GFP+ glioma cell with whole-cell pipette containing biocytin (left). Right, biocytin (red)-filled glioma cell co-labeled with GFP (green). Scale bar=50μm; n=21 biological replicates. c, Representative traces of evoked EPSCs in patient-derived glioma xenografts. d, Representative glioma EPSP in current-clamp with Schaffer collateral stimulation. e, Representative evoked glioma EPSC before (black) and after (red) tetrodotoxin (TTX, 0.5μM). f, Current:voltage relationship of evoked EPSCs with representative traces shown as inset (−80mV, n=18/9 cells/mice; −40mV, n=5/2; 0mV, n=18/9; +20mV, n=7/2; +40mV, n=16/7). g, Paired-pulse facilitation of evoked glioma cell EPSC (black) with block by NBQX (red; 10 μM; 50 ms inter-stimulus interval: P2/P1=1.75 ± 0.12; n=8/8 cells/mice). h, Timecourse of evoked glioma cell EPSC block by NBQX (10 μM, duration=red bar; n=6/6 cells/mice; left); Representative trace before (black) and after (red) NBQX (right). i, Quantification of (h). j, Evoked miniature-EPSCs in the presence of strontium (4 mM; top) and block by NBQX (10 μM; bottom; n=4/2 cells/mice). Stimulation timepoint=arrowhead (downward deflection in NBQX is stim artifact). k, Two-photon in situ calcium imaging in SU-DIPGVI xenograft with Schaffer collateral stimulation. Representative frames shown pre- (left) and post-stimulation (right), glioma td-tomato nuclear tag=red, glioma GCaMP6s=green. Scale bar=50μm, n=12/4 slices/mice. l, GCaMP6s intensity trace in representative glioma cell with electrical stimulation (red bar) over time (s). Data plotted as ρF/Fo. Timepoint of stimulation=red mark; n=4 mice. m, Individual cell GCaMP6s response to electrical stimulation +/− TTX (0.5μM). Data plotted as ρFmax/Fo; n=26 cells/3 mice. Data shown as mean±s.e.m (h,i,m). P-values determined by one-tailed Wilcoxon matched-pairs signed rank test (i,m).*P<0.05, ****P<0.0001.
Figure 3:
Figure 3:. Neuronal activity-dependent potassium currents in glioma
a, Representative voltage-clamp traces of evoked prolonged current in multiple patient-derived glioma xenograft models. b, Timecourse of evoked current blocked by TTX (duration=red bar; n=6/6 cells/mice; left). Representative trace before (black) and after (red) TTX (right). c, Quantification of (b). d, Timecourse of glioma cell current induced by addition of extracellular potassium (K+, 15mM, duration=red bar; n=9/2 cells/mice) with concurrent neuronal activation blockade. e, As in (b), but with barium (200μM); n=10/3 cells/mice. f, Quantification of (e). g, Quantification of current amplitude decrease with carbenoxolone (CBX; 100μM; n=19/11 cells/mice; top), or meclofenamate (100μM; n=8/3 cells/mice; bottom). h, Two-photon in situ calcium imaging of hippocampal slice xenografted with GCaMP6s-expressing glioma (SU-DIPGXIII-FL); 30-min timecourse; Red=glioma td-Tomato nuclear tag, green=glioma GCaMP6s. Scale bar, 50μm; n=14 mice. i, Phase-locked traces of GCaMP6s intensity over time in four synchronous glioma cells with axonal stimulation (red line). Data plotted as ρF/Fo; n=40/4 cells/mice. Data shown as mean±s.e.m (b,c,d,e,f,g). P-values determined by two-tailed paired Student’s t-test (c,f), or one-tailed Wilcoxon matched-pairs signed rank test (g). **P<0.01, ****P<0.0001.
Figure 4:
Figure 4:. Glioma membrane depolarization promotes glioma progression
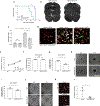
a, Optogenetic paradigm for glioma depolarization. ChR2-expressing glioma (blue), region of analysis (light blue). b, Proliferation index of SU-DIPGXIII-FL-ChR2 xenograft after mock stimulation (mock stim) or blue light stimulation (stim) measured as percent of GFP+/HNA+ cells expressing Ki67 (mock stim, n=8; stim, n=9 mice). c, As in (b), but SU-DIPGVI-ChR2 xenografts (n=6 mice/group). d, Representative confocal micrographs from (c), illustrating proliferating SU-DIPGVI-ChR2. Red=human nuclei; white=Ki67. Scale bar=50μm. e-f, Kaplan-Meier survival curves of SU-DIPGXIII-P* xenografts overexpressing e, GFP-only (green) or GluA2-WT-GFP (red) and f, GFP-only (in 80% of cells, green) or GluA2-DN-GFP (in 80% of cells, blue); n=5 mice/group. g, Competitive outgrowth of non-GluA2-DN-GFP-expressing cells in (f), determined by GFP/total human nuclei pixel intensity; (n=3 mice/group). h, Representative confocal micrographs of (f-g). White=human nuclei; green=GFP. Scale bar=50μm. i, Representative confocal images of SU-DIPGXIII-FL xenografts expressing GFP-only control (top) or GluA2-DN-GFP (bottom). Gray=MBP; White=glioma-GFP. Scale bar=500μm. j, Quantification of (i) (n=8 mice/group). k, Proliferation index of SU-DIPGVI xenografts treated with perampanel (AMPAR blocker) or vehicle control; (n=8 mice/group). l, Proliferation index of SU-DIPGXIII-FL in mice treated with meclofenamate (gap junction blocker) or vehicle control; (n=9 vehicle, n=8 treated mice). Data shown as mean±s.e.m (b,c,g,j,k,l). **P<0.01. ***P<0.001, ****P<0.0001. P-values determined by two-tailed unpaired Student’s t-test (b,c,g,k,l); two-tailed log rank analyses (e,f); two-sided Mann-Whitney test (j).
Figure 5:
Figure 5:. Increased neuronal excitability in glioma-infiltrated brain
a-b, Human neuronal hyperexcitability in glioma: a, top, sagittal brain MRI FLAIR sequences of adult IDH WT cortical glioblastoma in three individuals (human subject 1,2,3 outlined in red, blue, green, respectively). Bottom, intraoperative cortical electrode placement. b, Electrocorticography signals (mean high-gamma frequency-filtered power (μV2)) in each of healthy-appearing, tumor core, and tumor-infiltrated brain (n=3 patients with n=23, n=29, n=51 total channels, respectively). Data points colored by patient as in (a). c, Mouse neuronal hyperexcitability in pediatric glioma xenograft (SU-DIPG-XIIIFL): plot of presynaptic fiber volley vs. amplitude of field EPSP at varying axonal stimulation intensities (10,20,30,50,75,100,150,200 μA) in glioma-bearing or control hippocampus (n=17/3 control and n=18/3 glioma-bearing slices/mice at each datapoint). Data fit to a non-linear regression and compared using the extra-sum-of-squares F test; F=61.61, P<0.0001). Representative traces of field responses to varying intensities shown above. Data shown as mean±s.e.m (b,c). P-values determined by one-way ANOVA with Tukey’s post-hoc analysis. *P<0.05, ****P<0.0001.

Comment in

Similar articles

Cited by

References

    1. Venkatesh HS et al. Neuronal Activity Promotes Glioma Growth through Neuroligin-3 Secretion. Cell 161, 803–816, doi:10.1016/j.cell.2015.04.012 (2015). - DOI - PMC - PubMed
    1. Venkatesh HS et al. Targeting neuronal activity-regulated neuroligin-3 dependency in high-grade glioma. Nature 549, 533–537, doi:10.1038/nature24014 (2017). - DOI - PMC - PubMed
    1. Bergles DE, Roberts JD, Somogyi P & Jahr CE Glutamatergic synapses on oligodendrocyte precursor cells in the hippocampus. Nature 405, 187–191, doi:10.1038/35012083 (2000). - DOI - PubMed
    1. Karadottir R, Cavelier P, Bergersen L & Attwell D NMDA receptors are expressed in oligodendrocytes and activated in ischaemia. Nature 438, 1162–1166, doi:10.1038/nature04302 (2005). - DOI - PMC - PubMed
    1. LoTurco JJ, Owens DF, Heath MJ, Davis MB & Kriegstein AR GABA and glutamate depolarize cortical progenitor cells and inhibit DNA synthesis. Neuron 15, 1287–1298 (1995). - PubMed

Publication types

MeSH terms