

Long-term dynamics of measles in London: Titrating the impact of wars, the 1918 pandemic, and vaccination
- PMID: 31513578
- PMCID: PMC6742223
- DOI: 10.1371/journal.pcbi.1007305
Long-term dynamics of measles in London: Titrating the impact of wars, the 1918 pandemic, and vaccination
Abstract
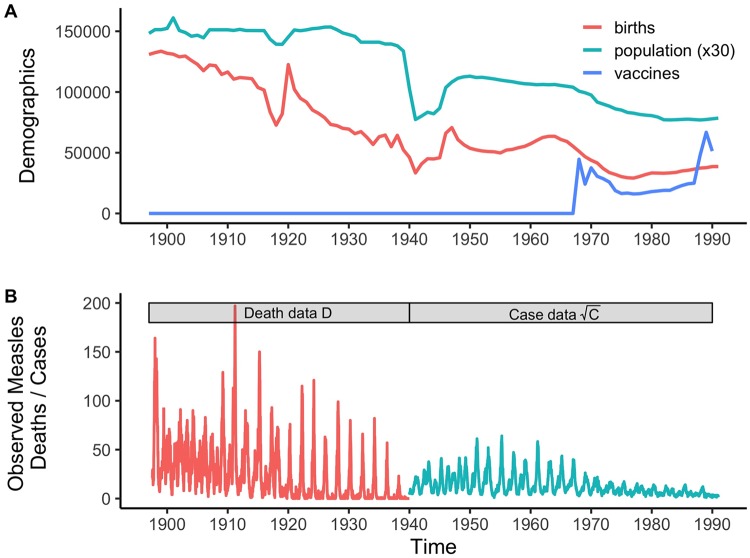
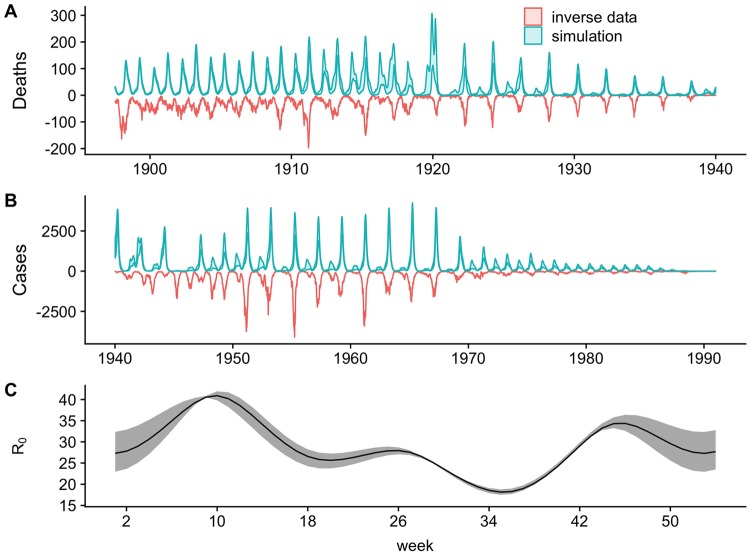
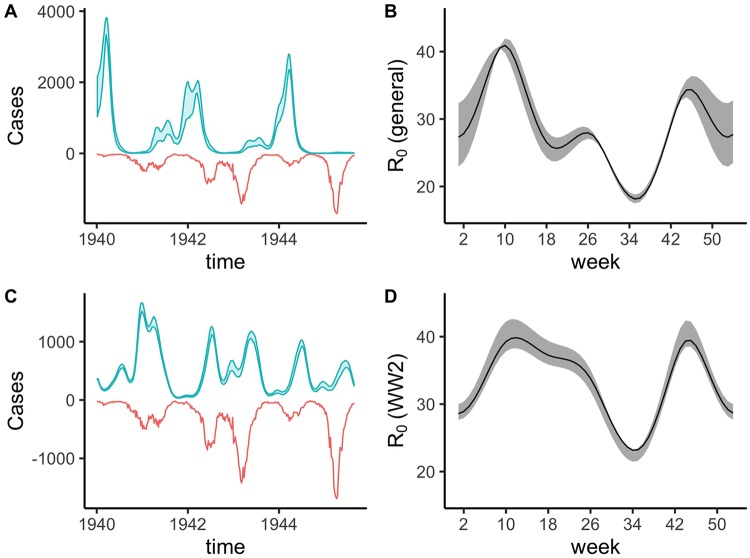
A key question in ecology is the relative impact of internal nonlinear dynamics and external perturbations on the long-term trajectories of natural systems. Measles has been analyzed extensively as a paradigm for consumer-resource dynamics due to the oscillatory nature of the host-pathogen life cycle, the abundance of rich data to test theory, and public health relevance. The dynamics of measles in London, in particular, has acted as a prototypical test bed for such analysis using incidence data from the pre-vaccination era (1944-1967). However, during this timeframe there were few external large-scale perturbations, limiting an assessment of the relative impact of internal and extra demographic perturbations to the host population. Here, we extended the previous London analyses to include nearly a century of data that also contains four major demographic changes: the First and Second World Wars, the 1918 influenza pandemic, and the start of a measles mass vaccination program. By combining mortality and incidence data using particle filtering methods, we show that a simple stochastic epidemic model, with minimal historical specifications, can capture the nearly 100 years of dynamics including changes caused by each of the major perturbations. We show that the majority of dynamic changes are explainable by the internal nonlinear dynamics of the system, tuned by demographic changes. In addition, the 1918 influenza pandemic and World War II acted as extra perturbations to this basic epidemic oscillator. Our analysis underlines that long-term ecological and epidemiological dynamics can follow very simple rules, even in a non-stationary population subject to significant perturbations and major secular changes.
Conflict of interest statement
The authors have declared that no competing interests exist.
Figures


Similar articles
-
Coexisting attractors in the context of cross-scale population dynamics: measles in London as a case study.Proc Biol Sci. 2020 Apr 29;287(1925):20191510. doi: 10.1098/rspb.2019.1510. Epub 2020 Apr 22. Proc Biol Sci. 2020. PMID: 32315586 Free PMC article.
-
Estimating enhanced prevaccination measles transmission hotspots in the context of cross-scale dynamics.Proc Natl Acad Sci U S A. 2016 Dec 20;113(51):14595-14600. doi: 10.1073/pnas.1604976113. Epub 2016 Nov 21. Proc Natl Acad Sci U S A. 2016. PMID: 27872300 Free PMC article.
-
Towards eradication of measles virus: global progress and strategy evaluation.Vet Microbiol. 1995 May;44(2-4):333-50. doi: 10.1016/0378-1135(95)00027-8. Vet Microbiol. 1995. PMID: 8588328
-
Historical and clinical aspects of the 1918 H1N1 pandemic in the United States.Virology. 2019 Jan 15;527:32-37. doi: 10.1016/j.virol.2018.10.019. Epub 2018 Nov 16. Virology. 2019. PMID: 30453209 Review.
-
Influenza epidemiology--past, present, and future.Crit Care Med. 2010 Apr;38(4 Suppl):e1-9. doi: 10.1097/CCM.0b013e3181cbaf34. Crit Care Med. 2010. PMID: 20029350 Review.
Cited by
-
Development and dissemination of infectious disease dynamic transmission models during the COVID-19 pandemic: what can we learn from other pathogens and how can we move forward?Lancet Digit Health. 2021 Jan;3(1):e41-e50. doi: 10.1016/S2589-7500(20)30268-5. Epub 2020 Dec 7. Lancet Digit Health. 2021. PMID: 33735068 Free PMC article. Review.
-
Coexisting attractors in the context of cross-scale population dynamics: measles in London as a case study.Proc Biol Sci. 2020 Apr 29;287(1925):20191510. doi: 10.1098/rspb.2019.1510. Epub 2020 Apr 22. Proc Biol Sci. 2020. PMID: 32315586 Free PMC article.
-
Patterns of smallpox mortality in London, England, over three centuries.PLoS Biol. 2020 Dec 21;18(12):e3000506. doi: 10.1371/journal.pbio.3000506. eCollection 2020 Dec. PLoS Biol. 2020. PMID: 33347440 Free PMC article.
-
Comparing and linking machine learning and semi-mechanistic models for the predictability of endemic measles dynamics.PLoS Comput Biol. 2022 Sep 8;18(9):e1010251. doi: 10.1371/journal.pcbi.1010251. eCollection 2022 Sep. PLoS Comput Biol. 2022. PMID: 36074763 Free PMC article.
-
Increasing intensity of enterovirus outbreaks projected with climate change.Nat Commun. 2024 Jul 31;15(1):6466. doi: 10.1038/s41467-024-50936-3. Nat Commun. 2024. PMID: 39085256 Free PMC article.
References
-
- Dalziel BD, Bjørnstad ON, van Panhuis WG, Burke DS, Metcalf CJE, Grenfell BT. Persistent Chaos of Measles Epidemics in the Prevaccination United States Caused by a Small Change in Seasonal Transmission Patterns. Ferguson NM, editor. PLOS Comput Biol. 2016;12: e1004655 10.1371/journal.pcbi.1004655 - DOI - PMC - PubMed
Publication types
MeSH terms
Grants and funding
LinkOut - more resources
Full Text Sources
Medical
