. 2019 Sep;573(7774):416-420.
doi: 10.1038/s41586-019-1549-9. Epub 2019 Sep 11.

Genome architecture and stability in the Saccharomyces cerevisiae knockout collection

Affiliations

Genome architecture and stability in the Saccharomyces cerevisiae knockout collection

Fabio Puddu et al. Nature. 2019 Sep.

Abstract

Despite major progress in defining the functional roles of genes, a complete understanding of their influences is far from being realized, even in relatively simple organisms. A major milestone in this direction arose via the completion of the yeast Saccharomyces cerevisiae gene-knockout collection (YKOC), which has enabled high-throughput reverse genetics, phenotypic screenings and analyses of synthetic-genetic interactions1-3. Ensuing experimental work has also highlighted some inconsistencies and mistakes in the YKOC, or genome instability events that rebalance the effects of specific knockouts4-6, but a complete overview of these is lacking. The identification and analysis of genes that are required for maintaining genomic stability have traditionally relied on reporter assays and on the study of deletions of individual genes, but whole-genome-sequencing technologies now enable-in principle-the direct observation of genome instability globally and at scale. To exploit this opportunity, we sequenced the whole genomes of nearly all of the 4,732 strains comprising the homozygous diploid YKOC. Here, by extracting information on copy-number variation of tandem and interspersed repetitive DNA elements, we describe-for almost every single non-essential gene-the genomic alterations that are induced by its loss. Analysis of this dataset reveals genes that affect the maintenance of various genomic elements, highlights cross-talks between nuclear and mitochondrial genome stability, and shows how strains have genetically adapted to life in the absence of individual non-essential genes.


Conflict of interest statement

The authors declare no competing financial or non-financial interests.

Figures
Extended Data Figure 1
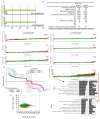
Extended Data Figure 1. Statistics of YKOC analyses and distribution of repetitive DNA estimates across the YKOC.
(a) Colonies that did not carry the expected deletion (red) were reassigned by reading the barcode inserted with the deletion marker; deletion of an alternative gene was then confirmed by loss of sequencing coverage. (b) Number of strains proceeding through the steps of the pipeline for data generation, and analysis used to create the dataset on which this work is based. (c) Distribution of copy-number estimates for the indicated repeats across the YKOC. Strains are sorted by the average across the colonies sequenced, and the estimate of each colony is shown; red zones represent values >3 standard deviations of the wild-type distribution (n=8 biological independent samples for wild-type strains; n=1 biological sample for 258 KO strains; n=2 biologically independent samples for 4093 KO strains; n=3 biologically independent samples for 30 KO strains; n=4 biologically independent samples for 72 KO strains; n=5 biologically independent samples for 1 KO strain). (d) Correlations between relative copy-number changes at rDNA and CUP1 tandem-repeat loci; average correlations in all colonies of each KO strain are shown.(n=8 biological independent samples for wild-type strains; n=1 biological sample for 258 KO strains; n=2 biologically independent samples for 4093 KO strains; n=3 biologically independent samples for 30 KO strains; n=4 biologically independent samples for 72 KO strains; n=5 biologically independent samples for 1 KO strain). (e) No overall correlation for rDNA and CUP1 copy-number estimates across all colonies sequenced. (f) Distribution of copy-number estimates for the 2μ plasmid across the YKOC and gene ontology analysis of the hits. 2μ copy numbers did not follow a normal distribution with the maximum standard deviation increasing linearly with the mean copy number; this is consistent with the mode of 2μ amplification, which is activated by expression of the in cis gene FLP1 when the copy number crosses a lower threshold (we estimate this at 20-25 copies); different durations of FLP1 expression will result in different copy number increases. Also in line with this amplification mechanism, we detected an enrichment in gene-knockouts connected to gene silencing is strains with high 2μ copy number.
Extended Data Figure 2
Extended Data Figure 2. Development of tools to study repetitive DNA instability.
(a) Left: schematic of yeast chromosome XII. The apparent increase in sequencing coverage maps to rDNA repeats. Right: similar apparent coverage increases mapped to CUP1 and Ty transposon loci. (b) Whole-genome sequencing (WGS) estimates of rDNA-repeat copy number linearly correlate with estimates obtained by pulsed-field gel electrophoresis (n=3-4 biologically independent samples per strain). (c) Percent deviation of two sequencing technical replicates from their average (n=2 technical replicates derived from n=89 biologically independent samples; median: yellow line; quartiles: blue line). measurements were within 5% of their average. Notable exceptions were Ty5 and CUP1, probably due to their relatively low repeat numbers. (d) Relative estimated content of telomeric repeats in indicated strains, normalized to estimated content of one wild-type colony, is plotted as a function of the minimum number of telomeric repeats in a sequencing read required to classify that read as telomeric (n=2 biologically independent samples per strain). (e) Telomere length estimations for wild-type, tel1Δ and rif1Δ strains obtained calculating the relative abundance of telomeric reads (mean from n=4-8 biologically independent samples per strain). (f) Estimations of rDNA, CUP1, Ty1, Ty2, and mtDNA copy numbers, and telomeric DNA content for MATa, MATα and diploid strains in W303 and BY4743 backgrounds (median from n=8 biologically independent samples per strain). (g) A long read spanning the CUP1 locus derived from ONT (Oxford nanopore) sequencing of a W303 (K699) genomic library. (h) Comparison of CUP1 copy number estimated by qPCR or WGS; the same DNA samples (as indicated in labels) were analyzed. Two estimates were extracted from WGS data: “from CUP1” indicates estimation using a large region of the CUP1 locus and the genome-wide median for reference (the same method used for the entire YKOC); “from qPCR amplicon” indicates a small region of CUP1 and a small region of GAL1 for reference (the same regions used for qPCR).
Extended Data Figure 3
Extended Data Figure 3. Southern blot analysis and functional connections between TLM genes.
(a) Gel electrophoresis and Southern blot analysis of telomeres for 14 novel predicted TLML strains (hits = strains with two or more colonies with measures >3 times the SD of the wild-type distribution) and 21 strains failing such stringent hit-selection criteria (non–hits) but still displaying relatively high or low telomere length estimates (representative images from two independent experiments).. Purple lines: location of molecular weight markers; orange line: average telomere length for wild-type samples; green dashes: average telomere lengths for strains predicted to have longer telomeres; white dashes: average telomere lengths for strains predicted to have shorter telomeres (b) Validation of KOs failing TLM selection criteria but still displaying high or low telomere counts. (c) Network-graph analysis of KOs affecting telomere length highlighting novel genes validated by Southern blotting.
Extended Data Figure 4
Extended Data Figure 4. Examples of aneuploidies and chromosomal rearrangements in the YKOC.
(a) Example of a strain with fractional aneuploidy of chromosome XII, likely reflecting clonal heterogeneity. (b) Distribution of fractional and non-fractional aneuploidies per chromosome (n=8843 biologically independent samples). (c) Knockout of genes encoding ribosomal protein subunits frequently leads to gain of the chromosome carrying the paralog gene. (d) Ploidy plots of chromosome II for two different colonies of the hta1Δ, swi4Δ, and spt10Δ KO strains: hta1Δ cells (deleted in one of the two genes encoding histone H2A) accumulate a specific amplification of a genome region containing the paralog HTA2, a centromere, and two origins of replication). This is most likely transmitted as a circular genetic element formed by recombination between two adjacent transposon sequences. Only two other YKOC strains were found to carry the same genetic element and these were spt10Δ and swi4Δ, encoding factors controlling the transcription of cell-cycle regulated genes, including histones.
Extended Data Figure 5
Extended Data Figure 5. Calculation of mtDNA copy number.
(a) Sequencing coverage across the mitochondrial genome of a wild-type haploid (BY4741; accession ERS616991). Shaded areas indicate regions (loosely corresponding to COX1 and COX3 genes) used to estimate total mtDNA content. (b) mtDNA regions of low sequence coverage correspond to regions with strongly reduced GC content. (c) Comparison of mtDNA content estimated by qPCR and by WGS. The same DNA samples (as indicated by labels) were analyzed by qPCR and WGS. Two estimates were extracted from WGS data: “from COX1” indicates estimation using a large region of the COX1 gene and the genome-wide median for reference (the same method used for the entire YKOC); “from qPCR amplicon” indicates a small region of COX1 and a small region of GAL1 for reference (the same regions used for qPCR). (d) Correlation between estimates of mtDNA content using COX1 or COX3 region on all sequenced strains belonging to the YKOC (Pearson R2=0.7596).
Extended Data Figure 6
Extended Data Figure 6. Connections between mtDNA and nuclear genome alterations.
(a) Venn diagram showing overlap between genes identified as rho0 by our sequencing, genes encoding mitochondria proteins (source), and gene knockouts for which respiratory growth was annotated as ‘absent’ (source SGD: http://www.yeastgenome.org). (b) Gene-ontology of rho0 strains (estimated mtDNA copy number <1) and rho++ strains (estimated mtDNA copy number >20.3; Bonferroni corrected p-values). (c) Sixteen gene-knockouts from the top end of the mtDNA distribution were assessed for spontaneous DDR activation by Rad53 and histone H2A phosphorylation (representative images from two technical replicates, source data in Supplementary Figure 1), and RNR expression (average from 3 technical replicates, one biological sample per strain). Strains with increased RNR expression (violet) or increased RNR expression and Rad53 hyperphosphorylation (yellow) are highlighted. Serial dilutions of the same cultures were also tested for hydroxyurea (HU) sensitivity. (d) Comparisons of mtDNA estimates with systematic analysis of HU sensitivity; HU-sensitive strains are highlighted in different colours depending on the study (Parsons: n=62 and Woolstencroft: n=33 biologically independent samples). (e) Comparison of predicted mtDNA copy-number and RNR3 expression levels: KOs with increased Rnr3 protein levels (blue, Z-score >2); KOs with increased mtDNA (yellow, mtDNA >22.2); KOs with both measures increased (green); n=4436 by KO averages of n=8843 biologically independent samples.
Extended Data Figure 7
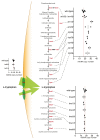
Extended Data Figure 7. mtDNA in KOs for genes encoding tryptophan metabolism enzymes.
Pathway for tryptophan biosynthesis from phosphoenolpyruvate, tryptophan import, and NAD biosynthesis from tryptophan are depicted along with mtDNA copy number estimates for strains lacking each of the enzymes in the pathways (mean from nwt = 8 or nKO = 2 biologically independent samples).
Extended Data Figure 8
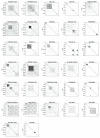
Extended Data Figure 8. Genes frequently carrying mutations contain repetitive regions.
Self dot-plots highlighting degenerate repetitive regions in the DNA sequence of genes found to be frequently mutated in the YKOC. Plots were obtained using FlexiDot.
Extended Data Figure 9
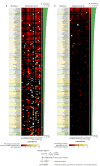
Extended Data Figure 9. Most frequent YKOC mutations and their distributions between different source laboratories.
Most frequent mutations, with predicted effects on genes, detected in the YKOC (top 200) and their distribution among different source laboratories. (a) Left: the mutation is indicated by its predicted effect, and the background indicates whether it is a mutation in a gene with degenerate repeats (grey), a mutation coming from founder effect (yellow), or a frequently mutated site (green); boldface indicates homozygous mutation. Centre: heatmap of the distribution of the most frequent mutations by laboratory in which the strain carrying that mutation was produced (100% indicates that all the strains with a certain mutation were generated in the same laboratory). Right: number of strains carrying the mutation. (b) Not all strains derived from each laboratory share founder mutations: as in (a), but a value of 100% in the heatmap indicates that all the strains generated by a certain laboratory have that mutation.
Extended Data Figure 10
Extended Data Figure 10. Overview of genomic instability caused by non-essential gene knockouts.
(a) Overview of results from our genome instability screens. Strains with an abnormal copy number for different genomic features, aneuploidies and chromosomal rearrangements (CR) are represented by coloured boxes. (b) Gene ontology analysis for 151 GI genes, defined as KOs showing three or more abnormal features. The number of genes in each GO category as well as Holm-Bonferroni corrected p-values are reported. (c) GI genes were manually sorted into classes based on their function, inferred from annotations in SGD.
Figure 1
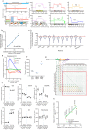
Figure 1. Assessment of repetitive-DNA alterations in the YKOC.
(a) Screen schematics. (b) rDNA copy-number distribution for YKOC strains (details in Extended Data Fig 1c legend). (c) Extract from (b) showing that gene-knockouts affecting functional rRNA synthesis display increased rDNA copy number (median from n=2-8 biologically independent samples). (d) Overlaps between genes affecting rDNA length identified in this study and the literature. Asterisks indicate that some genes, for which we have no data, were removed from the “hits” identified in that study. (e) rDNA copy-number estimates of strains carrying ts alleles of RRN3 or RPA190 grown at permissive or semi-permissive temperatures (the average of n=2 biologically independent samples taken on different days of growth is shown). (f) Telomere length distribution for YKOC strains (details in Extended Data Fig 1c legend). (g-h) Overlap between gene KOs associated with telomere lengthening or shortening identified in this work and the literature; EST KO strains were previously identified as having shorter telomeres. (i) Validation of 14 predicted novel TLM genes.
Figure 2
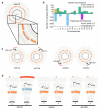
Figure 2. Identification of knockout strains with aberrant karyotypes.
(a) Distribution of total deviation from expected ploidy (2n) for YKOC strains in chromosome units (details in Extended Data Fig 1c legend). (b) CIN estimates for 106 fresh KO strains selected from those with highest deviation from diploidy (n=4 biologically independent samples for most strains; red dot: average; green band: wild-type sample SD; blue column: KO sample SD). (c) Distribution of chromosome rearrangements (CRs) detected in the YKOC (details in Extended Data Fig 1c legend). (d) Localisation of CR breakpoints in strains analysed.
Figure 3
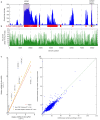
Figure 3. mtDNA copy number and its links to genome instability and elevated RNR expression.
(a) Distribution of mtDNA copy number for YKOC strains (details in Extended Data Fig 1c legend). (b) Correlation between pairs of abnormal genomic parameters measured in different colonies. Every circle is a comparison between two parameters; diameter = number of colonies found as abnormal in both parameters. Holm-Bonferroni corrected p-values and fold-change from the corresponding hyper-geometric distribution (n=8843 biologically independent samples). (c) Frequency of aneuploidy types in all YKOC and in rho0 strains; hyper-geometric p-values for under/over-enrichment in rho0 strains (nall=8843 or nrho0=303 biologically independent samples). (d) Distribution of mtDNA copy number in strains with increasing deviation from diploidy. (e) DNA-damage induction leads to increased mtDNA copy number (mean from n=2 biologically independent samples). (f) Strains lacking transcriptional repression of RNR genes have increased mtDNA (mean from nwt=8 or nKO=2 biologically independent samples; p = two-tailed unpaired t-test). (g) RNR1 or RNR3 overexpression increases mtDNA levels.
Figure 4
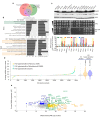
Figure 4. HR defects yield a SNV signature.
(a) Number of “independent” mutations in the YKOC by gene: grey = genes with short repetitive regions; yellow = genes carrying “founder” mutations; green = other frequently-mutated genes. (b) Enrichment of ATP1-3 and SIT4 mutations in rho0 strains. (c-d) Average number of SNVs/INDELs in YKOC strains versus the wild-type (BY4743) and between different colonies of the same KO strain. (e) Clustering of hypermutator KO strains based on their SNV and INDEL patterns and schematic of potential underlying mutagenic processes.

Similar articles

Cited by

References

    1. Tong AH, et al. Systematic genetic analysis with ordered arrays of yeast deletion mutants. Science (New York, N.Y.) 2001;294:2364–2368. - PubMed
    1. Giaever G, et al. Functional profiling of the Saccharomyces cerevisiae genome. Nature. 2002;418:387–391. - PubMed
    1. Giaever G, Nislow C. The yeast deletion collection: a decade of functional genomics. Genetics. 2014;197:451–465. - PMC - PubMed
    1. Hughes TR, et al. Widespread aneuploidy revealed by DNA microarray expression profiling. Nature genetics. 2000;25:333–337. - PubMed
    1. Lehner KR, Stone MM, Farber RA, Petes TD. Ninety-six haploid yeast strains with individual disruptions of open reading frames between YOR097C and YOR192C, constructed for the Saccharomyces genome deletion project, have an additional mutation in the mismatch repair gene MSH3. Genetics. 2007;177:1951–1953. - PMC - PubMed

Publication types

MeSH terms

LinkOut - more resources