SREBP-1 inhibitor Betulin enhances the antitumor effect of Sorafenib on hepatocellular carcinoma via restricting cellular glycolytic activity
- PMID: 31511501
- PMCID: PMC6739379
- DOI: 10.1038/s41419-019-1884-7
SREBP-1 inhibitor Betulin enhances the antitumor effect of Sorafenib on hepatocellular carcinoma via restricting cellular glycolytic activity
Abstract
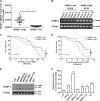
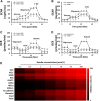
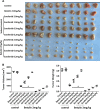
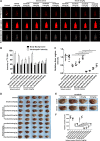
Lipid metabolism that correlates tightly to the glucose metabolic regulation in malignant cells includes hepatocellular carcinoma (HCC) cells. The transcription factor Sterol Regulatory Element Binding Protein 1 (SREBP-1), a regulator of fatty acid synthesis, has been shown to pivotally regulate the proliferation and metastasis of HCC cells. However, the intrinsic mechanism by which SREBP-1 regulates the survival of HCC cells remains unclear. In this study, among HCC patients who had dismal responses to Sorafenib, a high SREBP-1 level was found in the tumors and correlated to poor survival. This observation suggested the negative role of SREBP-1 in clinical HCC prognosis. Our mechanistical studies reveal that the inhibition of SREBP-1 via its inhibitor Betulin suppresses cellular glucose metabolism. In addition to the reduced glycolytic activity, a thwarted metastatic potential was observed in HCC cells upon Betulin administration. Moreover, our data show that SREBP-1 inhibition facilitated the antitumor effects of Sorafenib on HCC cells and xenograft tumors.
Conflict of interest statement
The authors declare that they have no conflict of interest.
Figures


Similar articles
-
Increased expression of SLC46A3 to oppose the progression of hepatocellular carcinoma and its effect on sorafenib therapy.Biomed Pharmacother. 2019 Jun;114:108864. doi: 10.1016/j.biopha.2019.108864. Epub 2019 Apr 10. Biomed Pharmacother. 2019. PMID: 30981107
-
Emodin Sensitizes Hepatocellular Carcinoma Cells to the Anti-Cancer Effect of Sorafenib through Suppression of Cholesterol Metabolism.Int J Mol Sci. 2018 Oct 12;19(10):3127. doi: 10.3390/ijms19103127. Int J Mol Sci. 2018. PMID: 30321984 Free PMC article.
-
Sorafenib and CuB exert synergistic antitumor effects against hepatocellular carcinoma cells via inhibition of STAT3 phosphorylation.FEBS Open Bio. 2021 Jan;11(1):133-145. doi: 10.1002/2211-5463.13035. Epub 2020 Nov 27. FEBS Open Bio. 2021. PMID: 33176070 Free PMC article.
-
Regulation and targeting of SREBP-1 in hepatocellular carcinoma.Cancer Metastasis Rev. 2024 Jun;43(2):673-708. doi: 10.1007/s10555-023-10156-5. Epub 2023 Dec 1. Cancer Metastasis Rev. 2024. PMID: 38036934 Free PMC article. Review.
-
Role of ferroptosis in hepatocellular carcinoma.J Cancer Res Clin Oncol. 2018 Dec;144(12):2329-2337. doi: 10.1007/s00432-018-2740-3. Epub 2018 Aug 22. J Cancer Res Clin Oncol. 2018. PMID: 30167889 Review.
Cited by
-
Metabolic Alteration in Hepatocellular Carcinoma: Mechanism of Lipid Accumulation in Well-Differentiated Hepatocellular Carcinoma.Can J Gastroenterol Hepatol. 2021 Feb 18;2021:8813410. doi: 10.1155/2021/8813410. eCollection 2021. Can J Gastroenterol Hepatol. 2021. PMID: 33681091 Free PMC article.
-
Lipoproteins and cancer: The role of HDL-C, LDL-C, and cholesterol-lowering drugs.Biochem Pharmacol. 2022 Feb;196:114654. doi: 10.1016/j.bcp.2021.114654. Epub 2021 Jun 12. Biochem Pharmacol. 2022. PMID: 34129857 Free PMC article. Review.
-
Broad Transcriptomic Impact of Sorafenib and Its Relation to the Antitumoral Properties in Liver Cancer Cells.Cancers (Basel). 2022 Feb 25;14(5):1204. doi: 10.3390/cancers14051204. Cancers (Basel). 2022. PMID: 35267509 Free PMC article.
-
Novel Microcrystal Formulations of Sorafenib Facilitate a Long-Acting Antitumor Effect and Relieve Treatment Side Effects as Observed With Fundus Microcirculation Imaging.Front Oncol. 2021 Aug 26;11:743055. doi: 10.3389/fonc.2021.743055. eCollection 2021. Front Oncol. 2021. PMID: 34513717 Free PMC article.
-
DNA methylation integratedly modulates the expression of Pit-Oct-Unt transcription factors in esophageal squamous cell carcinoma.J Cancer. 2021 Jan 15;12(6):1634-1643. doi: 10.7150/jca.49231. eCollection 2021. J Cancer. 2021. PMID: 33613750 Free PMC article.
References
Publication types
MeSH terms
Substances
LinkOut - more resources
Full Text Sources
Other Literature Sources
Medical
Research Materials

