. 2019 Oct 21;51(2):192-207.e6.
doi: 10.1016/j.devcel.2019.08.004. Epub 2019 Sep 5.

X Chromosome Domain Architecture Regulates Caenorhabditis elegans Lifespan but Not Dosage Compensation

Affiliations

X Chromosome Domain Architecture Regulates Caenorhabditis elegans Lifespan but Not Dosage Compensation

Erika C Anderson et al. Dev Cell. .

Abstract

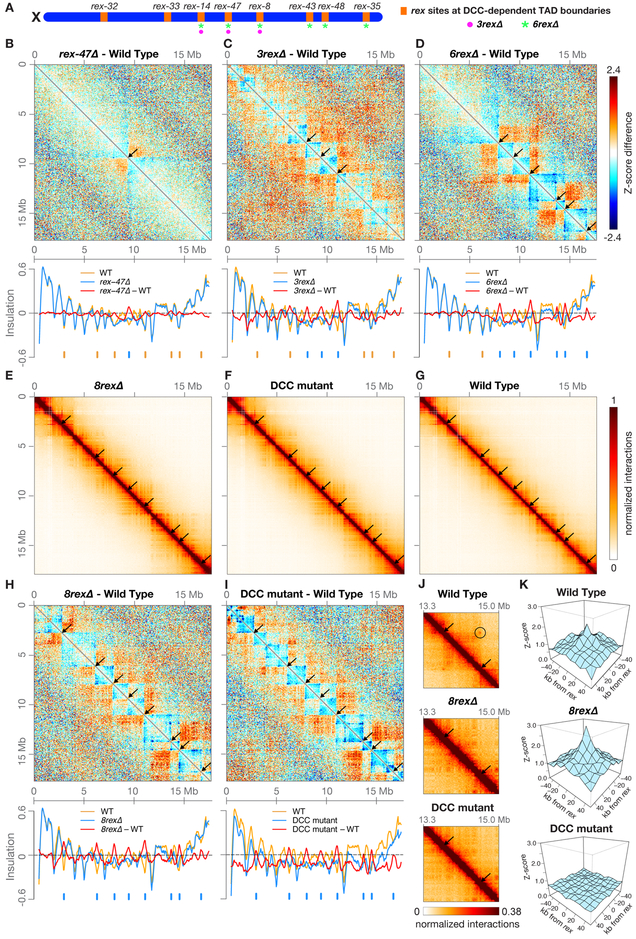
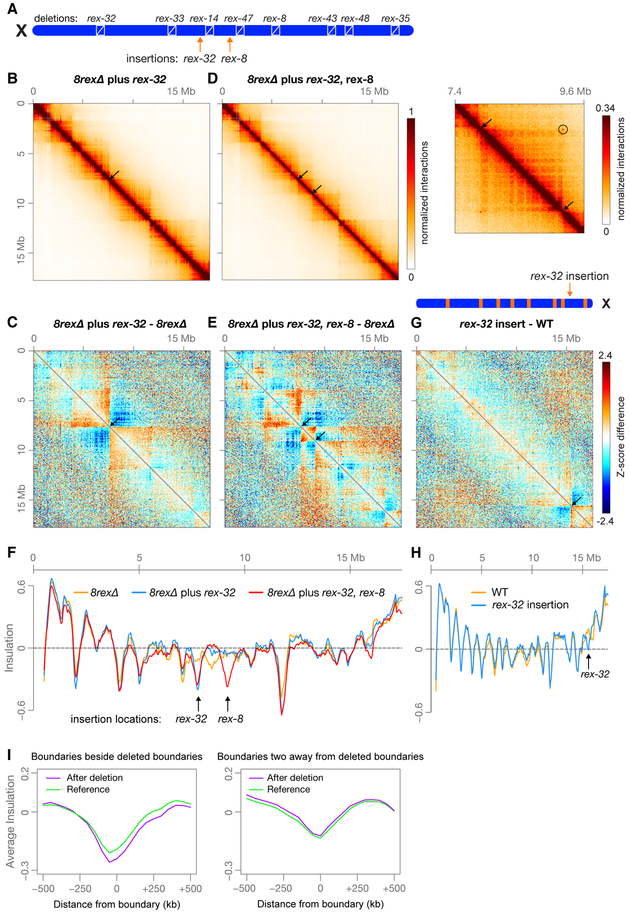
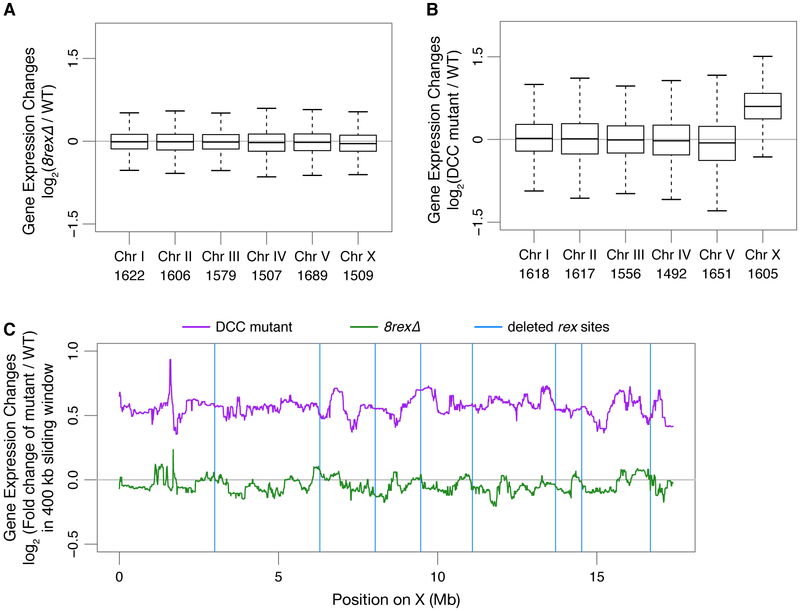
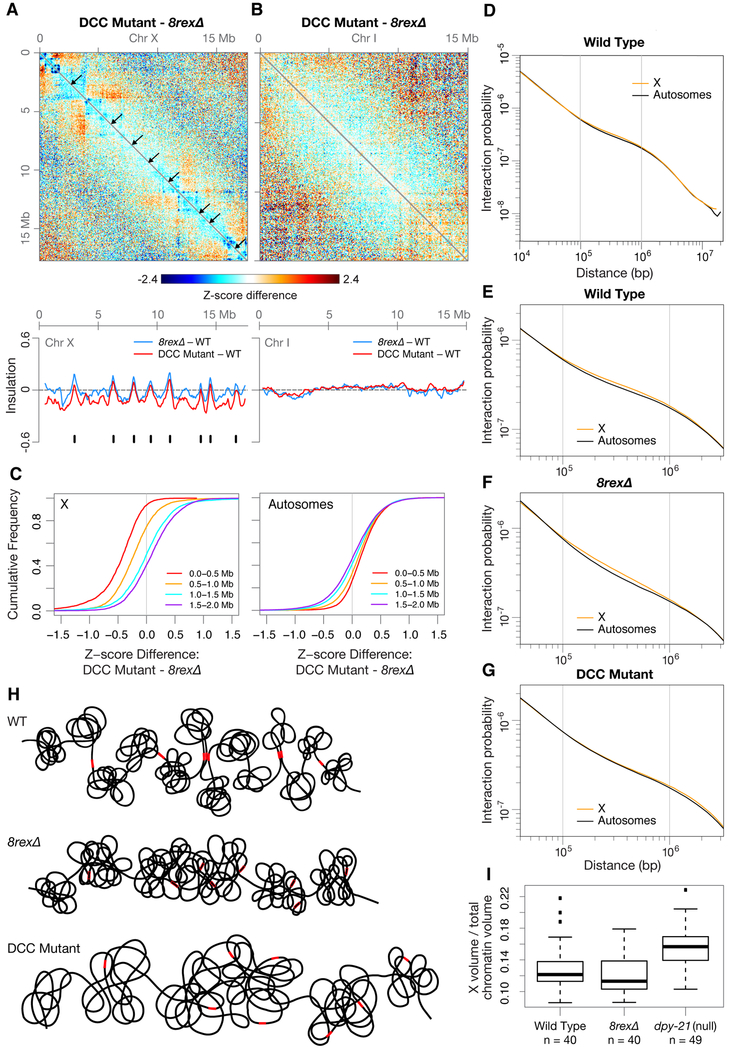
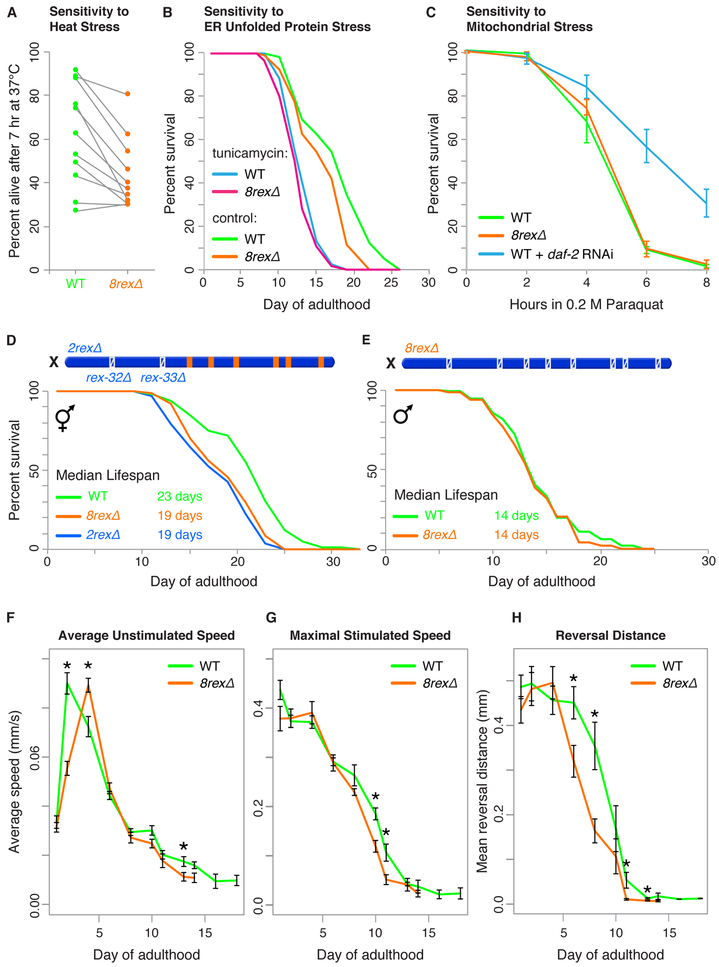
Mechanisms establishing higher-order chromosome structures and their roles in gene regulation are elusive. We analyzed chromosome architecture during nematode X chromosome dosage compensation, which represses transcription via a dosage-compensation condensin complex (DCC) that binds hermaphrodite Xs and establishes megabase-sized topologically associating domains (TADs). We show that DCC binding at high-occupancy sites (rex sites) defines eight TAD boundaries. Single rex deletions disrupted boundaries, and single insertions created new boundaries, demonstrating that a rex site is necessary and sufficient to define DCC-dependent boundary locations. Deleting eight rex sites (8rexΔ) recapitulated TAD structure of DCC mutants, permitting analysis when chromosome-wide domain architecture was disrupted but most DCC binding remained. 8rexΔ animals exhibited no changes in X expression and lacked dosage-compensation mutant phenotypes. Hence, TAD boundaries are neither the cause nor the consequence of DCC-mediated gene repression. Abrogating TAD structure did, however, reduce thermotolerance, accelerate aging, and shorten lifespan, implicating chromosome architecture in stress responses and aging.

Keywords: X chromosome dosage compensation; aging; condensin; gene expression; higher-order chromosome structure; lifespan; proteotoxic stress; topologically associating domains.


Conflict of interest statement

DECLARATION OF INTERESTS

The authors declare no competing interests.

Figures

Figure 1.
Figure 1.. A Single rex Site Is Necessary for Formation of Each DCC-Dependent TAD Boundary
(A) Locations on X of the eight rex sites (orange) at DCC-dependent TAD boundaries. All eight sites are deleted on 8rexΔ chromosomes, but only a subset are deleted on rex-47Δ, 3rexΔ (magenta circles), and 6rexΔ (green asterisks) chromosomes. (B, C, and D) X chromosome heatmaps binned at 50 kb show wild-type Hi-C Z-scores subtracted from rex-47Δ, 3rexΔ, or 6rexΔ Hi-C Z-scores. Red, higher interactions in rex mutant. Blue, higher interactions in wild type. Arrows, positions of deleted rex sites where TAD boundaries are lost. Plots (below) show insulation scores across X in rex deletion mutants (blue) and wild-type embryos (orange) and the insulation score difference between genotypes (red). Blue ticks, positions of deleted rex sites. Orange ticks, DCC-dependent boundaries that persist in the mutant. (E, F, and G) X heatmaps binned at 20 kb show Hi-C interactions in 8rexΔ, DCC mutant [sdc-2(y93, RNAi)], and wild-type embryos. Arrows mark positions of DCC-dependent boundaries found in wild-type embryos, which are lost in both mutants. Other DCC-independent boundaries remain. (H and I) Heatmaps binned at 50 kb compare Hi-C Z-scores in 8rexΔ or DCC mutants to those in wild-type embryos. Plots (below) show X chromosome insulation profiles. Black arrows (top) and blue ticks (bottom) show locations of DCC-dependent boundaries. (J) Heatmaps binned at 10 kb show enlargement of the X region surrounding rex-43 and rex-48 (arrows) in wild-type and mutant embryos and the interaction between the two rex sites in wild-type embryos (circle). (K) 3D plots show that average Z-scores increase in 8rexΔ versus wild-type embryos for interactions among the 22 non-boundary rex sites with highest SDC-3 binding. Shown are interactions between sites within 4 Mb. DCC-mediated rex interactions occur regardless of the orientation of known X-enriched motifs (Jans et al., 2009) that are important in rex sites for DCC binding (Figure S3A). Insulation scores were calculated by summing interactions in a 500 kb sliding window. See also Figures S1–S3, Tables S1 and S2.
Figure 2.
Figure 2.. A High-Occupancy rex Site is Sufficient to Create a TAD Boundary at a New Location on X
(A) Locations on X of eight rex deletions and two rex insertions at new locations (arrows). rex-32 was inserted 224 kb from wild-type rex-14; rex-8 was inserted 267 kb from wild-type rex-47. (B and D) Heatmaps binned at 20 kb show Hi-C interactions on X in embryos with either a rex-32 insertion or rex-32 and rex-8 insertions. Arrows mark locations of inserted rex sites where new TAD boundaries are created. (D, right) Heatmap binned at 10 kb shows enlargement of the X region surrounding the inserted rex sites (arrows) and the interaction between the inserted sites (circle). (C and E) Z-score subtraction heatmaps binned at 50 kb show increased (red) and decreased (blue) interactions on 8rexΔ chromosomes with rex insertions compared to 8rexΔ chromosomes. Arrows, locations of inserted rex sites. (F) Plot comparing X insulation scores of 8rexΔ chromosomes (orange) to those of 8rexΔ chromosomes with one (blue) or two (red) inserted rex sites (G) Diagram shows the location of rex-32 inserted 1.05 Mb from rex-48 on the wild-type X chromosome (arrow). Z-score subtraction heatmap binned at 50 kb shows the difference in Z-scores between rex-32 insertion and wild-type chromosomes. (H) Plot comparing X chromosome insulation scores for wild-type (orange) and rex-32 insertion (blue) embryos (I) Boundaries adjacent to deleted boundaries became stronger (p = 0.02, paired t test), while boundaries two away were unchanged (p = 0.60). Using Hi-C data from rex-47Δ, 3rexΔ, 6rexΔ, and 8rexΔ X chromosomes, we calculated the average insulation profile around all boundaries adjacent to a deleted boundary and compared it to the profile at the same boundaries in the strain with the next fewer deletions (see STAR Methods). See also Figures S3 and S4, Tables S1 and S2.
Figure 3.
Figure 3.. Expression of X-Linked Genes Is Not Significantly Changed by Loss of TAD Boundaries
(A and B) Box plots show gene expression changes for each chromosome in 8rexΔ or sdc-2(y93, RNAi) versus wild-type embryos. Numbers of genes per chromosome are listed. (C) Median gene expression changes in DCC mutant or 8rexΔ versus wild-type embryos in a 400 kb sliding window on X. Blue vertical lines, locations of rex sites deleted in 8rexΔ See also Figure S5, Table S3.
Figure 4.
Figure 4.. The DCC Promotes Interactions on X at the Scale of 0.1–1 Mb Independently of TAD Formation
(A and B) Z-score subtraction heatmaps show increased (red) and decreased (blue) interactions for chromosomes X and I in sdc-2(y93, RNAi) versus 8rexΔ embryos. Arrows mark locations of DCC-dependent TAD boundaries, which are in wild-type embryos but not in either mutant. Plots (below) show changes in insulation profiles of 8rexΔ and DCC mutant versus wild-type embryos. Black ticks, DCC-dependent boundaries on X. (C) Cumulative plots show Z-score differences between DCC mutant and 8rexΔ chromosomes at different length scales. More interactions within 1 Mb occur on X in 8rexΔ versus DCC mutant embryos. (D) Scaling plot shows the average interactions between loci at increasing distances (10 kb – 20 Mb) on X and autosomes in wild-type embryos. (E-G) Scaling plots zoom in on the average interactions between loci within 40 kb to 3.2 Mb on X and autosomes in wild-type and mutant embryos. (H) Cartoons of X chromosome structure in three genotypes. Red rectangles, rex sites; open rectangles, rex deletions. On 8rexΔ chromosomes, the eight DCC-dependent boundaries found on wild-type chromosomes are lost, while other DCC-mediated interactions and DCC-independent boundaries remain. In DCC mutants, the eight DCC-dependent boundaries are lost as are the DCC-mediated interactions at the 0.1–1 Mb length scale. X volume expands in DCC mutant but not in 8rexΔ embryos. (I) Boxplots show the fraction of total chromatin (measured by DAPI staining) occupied by X (measured by DPY-27 immunofluorescence) for intestinal nuclei of wild-type, 8rexΔ, and dpy-21(null) adults. X compaction does not require DCC-dependent TAD formation. n, number of nuclei
Figure 5.
Figure 5.. 8rexΔ Hermaphrodites Exhibit Reduced Thermotolerance, Shortened Lifespan, and Accelerated Aging
(A) Percent survival of 50 wild-type or 8rexΔ day 1 adult worms after 7 hr at 37°C in each of ni ne trials shows reduced thermotolerance in 8rexΔ adults. A gray line links the measurements of the two genotypes in the same trial. (B) Lifespans were scored for wild-type and 8rexΔ hermaphrodites transferred on day 1 of adulthood to plates with either 1% DMSO (control) or 20 ng/μL tunicamycin to induce ER unfolded protein stress. Replicate experiments and statistics are in Table S5. (C) Percent survival of day 1 adult wild-type and 8rexΔ hermaphrodites in 0.2 M paraquat to induce reactive oxygen species in mitochondria. Wild-type worms subjected to daf-2 RNAi were used as a control for increased oxidative stress tolerance. For each genotype, the average of at least three replicates is plotted. Error bars, standard error of the mean (SEM). (D) Comparison of lifespans for wild-type versus 8rexΔ (p < 0.0001, logrank test) and 2rexΔ (p < 0.0001) hermaphrodites shows lifespan shortening in mutants. See replicate experiments and statistics in Table S6. (E) Comparison of lifespans for wild-type versus 8rexΔ males (p = 0.2485, logrank test). (F) Average unstimulated speed of wild-type and 8rexΔ hermaphrodites during aging. For each genotype, the speed of 50 worms on each of eight replicate plates was measured throughout adulthood. Measurements included only moving worms. We calculated the mean speed of worms on each plate and plotted the mean ± SEM of all eight plates. Asterisks, significant differences (p < 0.05, t test). mm/s, millimeters per second. (G and H) Maximal speed and reversal distance during aging of wild-type and 8rexΔ hermaphrodites in response to a mechanical stimulus (plate tap). Mean ± SEM are plotted as in F. See also Figure S6, Tables S4, S5, and S6.
Figure 6.
Figure 6.. Model for TAD Formation by the DCC
(A) DCC condensin (blue) loads onto chromatin with SDC proteins (magenta) and extrudes loops of increasing size until the extrusion is halted by binding to a high-occupancy rex site with multiple X-enriched motifs (pink). Because DCC-mediated loops do not cross high-occupancy rex sites, the rex sites define the locations of TAD boundaries. The SDC loading factors could travel with condensin subunits from loading sites on X to the highest-affinity rex sites where they bind stably and block extrusion. Alternatively, condensin alone could bind at low levels to X and extrude loops until encountering SDC proteins bound independently at a rex site. Both possibilities could occur. Only the boundary rex sites are shown, even though rex sites with a range of DCC binding affinities act as loading sites and confer X specificity. (B) When high-occupancy rex sites are deleted (orange), TAD boundaries are lost, but other DCC-mediated interactions remain, most notably those at the 0.1–1 Mb length scale. The 8rexΔ X maintains the same level of compaction as the wild-type X.

Comment in

Similar articles

Cited by

References

    1. Albritton SE, Kranz A-L, Winterkorn LH, Street LA, and Ercan S (2017). Cooperation between a hierarchical set of recruitment sites targets the X chromosome for dosage compensation. ELife 6, e23645. - PMC - PubMed
    1. Bian Q, Anderson EC, Brejc K, and Meyer BJ (2018). Dynamic Control of Chromosome Topology and Gene Expression by a Chromatin Modification. Cold Spring Harb Symp Quant Biol 82, 034439. - PMC - PubMed
    1. Brejc K, Bian Q, Uzawa S, Wheeler BS, Anderson EC, King DS, Kranzusch PJ, Preston CG, and Meyer BJ (2017). Dynamic Control of X Chromosome Conformation and Repression by a Histone H4K20 Demethylase. Cell 171, 85–102.e23. - PMC - PubMed
    1. Brunquell J, Morris S, Lu Y, Cheng F, and Westerheide SD (2016). The genome-wide role of HSF-1 in the regulation of gene expression in Caenorhabditis elegans. BMC Genomics 17, 559. - PMC - PubMed
    1. Calo E, Gu B, Bowen ME, Aryan F, Zalc A, Liang J, Flynn RA, Swigut T, Chang HY, Attardi LD, et al. (2018). Tissue-selective effects of nucleolar stress and rDNA damage in developmental disorders. Nature 554, 112–117. - PMC - PubMed

Publication types

MeSH terms