. 2019 Nov 7;76(3):485-499.e8.
doi: 10.1016/j.molcel.2019.07.034. Epub 2019 Sep 5.

Transcriptional Responses to IFN-γ Require Mediator Kinase-Dependent Pause Release and Mechanistically Distinct CDK8 and CDK19 Functions

Affiliations

Transcriptional Responses to IFN-γ Require Mediator Kinase-Dependent Pause Release and Mechanistically Distinct CDK8 and CDK19 Functions

Iris Steinparzer et al. Mol Cell. .

Abstract

Transcriptional responses to external stimuli remain poorly understood. Using global nuclear run-on followed by sequencing (GRO-seq) and precision nuclear run-on sequencing (PRO-seq), we show that CDK8 kinase activity promotes RNA polymerase II pause release in response to interferon-γ (IFN-γ), a universal cytokine involved in immunity and tumor surveillance. The Mediator kinase module contains CDK8 or CDK19, which are presumed to be functionally redundant. We implemented cortistatin A, chemical genetics, transcriptomics, and other methods to decouple their function while assessing enzymatic versus structural roles. Unexpectedly, CDK8 and CDK19 regulated different gene sets via distinct mechanisms. CDK8-dependent regulation required its kinase activity, whereas CDK19 governed IFN-γ responses through its scaffolding function (i.e., it was kinase independent). Accordingly, CDK8, not CDK19, phosphorylates the STAT1 transcription factor (TF) during IFN-γ stimulation, and CDK8 kinase inhibition blocked activation of JAK-STAT pathway TFs. Cytokines such as IFN-γ rapidly mobilize TFs to "reprogram" cellular transcription; our results implicate CDK8 and CDK19 as essential for this transcriptional reprogramming.

Keywords: CDK19; CDK8; Mediator kinase; RNA polymerase II; STAT1; cortistatin A; eRNA; interferon; promoter-proximal pausing; transcription.


Conflict of interest statement

DECLARATION OF INTERESTS

The authors declare no competing financial interests

Figures
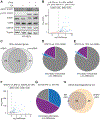
Figure 1.
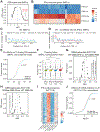
Figure 1.. Mediator kinase inhibition impairs IFN-γ-stimulated transcription in gene-selective ways
(A) CA inhibits IFN-γ-induced STAT1 AD phosphorylation at S727. WT MEFs (± 100 nM CA, 1 h pre-treatment) were subjected to 45 min IFN-γ stimulation followed by Western blot against phosphorylated STAT1 at S727 (pS727) or Y701 (pY701) and total STAT1, CDK8, CDK19 or tubulin. STAT1 bands correspond to STAT1 α or STAT1 β isoforms. (B) Gene expression changes (mRNA) in WT MEFs upon 6 h IFN-γ treatment (blue, padj < 0.05; red, padj > 0.05). Genes with padj < 0.05, log2FoldChange (lfc) ≥ 1, FPKM stimulated ≥ 1 were regarded as IFN-γ-induced (221 genes). (C) Overlap of genes induced after 6 h IFN-γ at mRNA vs. pre-mRNA levels. (D and E) Effects of CA on expression of IFN-γ-induced genes. WT MEFs (± 100 nM CA, 1 h pre-treatment) were stimulated with IFN-γ (6 h) followed by RNA-Seq. The numbers of differentially expressed (upregulated: lfc > 0, padj < 0.05; downregulated: lfc < 0, padj < 0.05) IFN-γ-induced genes (defined in B) at mRNA (D) and pre-mRNA (E) level are shown. (F, G and H) Mediator kinases act in part through STAT1 S727 phosphorylation. (F) Gene expression (mRNA) changes in S727A MEFs upon 3 h IFN-γ treatment. (G) Effects of STAT1 S727A mutation on IFN-γ-induced genes: genes induced by IFN-γ in WT MEFs are upregulated (55 genes, lfc > 0, padj < 0.05), down-regulated (78 genes, lfc < 0, padj < 0.05) or unaffected (32 genes) in S727A MEFs. (H) Overlap of IFN-γ-induced genes downregulated (lfc < 0, padj < 0.05) by CA (100 nM CA, 1 h pre-treatment) in WT MEFs vs. S727A MEFs.
Figure 2.
Figure 2.. Mediator kinase inhibition increases RNAPII pausing
(AF) MEFs pre-treated with CA (100 nM, 1 h) or DMSO (Ctrl) were stimulated with IFN-γ (30 min; IFN30) or unstimulated (IFN0), and subjected to GRO-Seq. (A) Moustache plot of false discovery rate (FDR) vs. normalized enrichment score (NES) based upon GSEA of GRO-Seq data for IFN30 vs. IFN0. Dashed line: 0.05 FDR. Only positively enriched gene sets are found at FDR<0.05. Gene sets for IFN-γ and JAK-STAT pathways are highlighted. (B) Effects of CA on induction of IFN-γ target genes (lfc ≥ 1, padj < 0.05). (C and D) Plot of GRO-Seq reads (pooled replicates) at Irf1 locus for IFN0.Ctrl and IFN30.Ctrl (C) as well as IFN30.Ctrl and IFN30.CA (D). Pausing indices (PI) and transcripts per million reads (TPM; nt 501 to transcript end) are indicated. (E) ECDF plot of PI distribution (transcriptome-wide) under IFN30.Ctrl (red) and IFN30.CA (blue) conditions. Kolmogorov-Smirnov Test p-value < 2.2e-16. (F) Median PI and statistical assessment of PI changes for all expressed genes (RefSeq). Median PI value shown for each condition (red = highest). Mann-Whitney U test, p-value ns ≥ 0.05; * < 0.05; ** < 0.01; *** < 0.001. (G - J) HCT116 WT and CDK8as cells were stimulated with IFN-γ (IFN) for 45 min (or unstimulated, PBS) and simultaneously treated with 10 μM 3MB-PP1 (3MB) or DMSO, and subsequently subjected to PRO-Seq. (G) GSEA for IFN-γ response of WT HCT116 cells (DMSO.IFN vs. DMSO.PBS). (H) GSEA for CDK8 inhibition in IFN-γ-stimulated HCT116 cells (CDK8as 3MB.IFN vs. WT.3MB.IFN). (I) Effects of CDK8 inhibition (CDK8as, 3MB) on expression of IFN-γ-induced genes compared to WT cells. Both IFN-γ-stimulated (IFN) and -unstimulated (PBS) as well as 3MB-and control (DMSO)-treated cells were analyzed. IFN-γ-induced genes (N=83): padj < 0.1, lfc > 1 for WT DMSO.IFN vs. WT DMSO.PBS using gene body (+301 to end) counts. (J) PI distribution during IFN-γ response upon CDK8 inhibition (CDK8as 3MB.IFN, blue) vs. uninhibited control (WT 3MB.IFN, red). Distribution shown for genes downregulated by CDK8 inhibition (N=956, padj < 0.1, log2FoldChange < 1 for CDK8as 3MB.IFN vs. WT 3MB.IFN).
Figure 3.
Figure 3.. eRNA transcription predicts activation of specific TFs and role of Mediator kinases in the IFN-γ response
(AD) Motif displacement (MD) score during IFN-γ (30 min) response in MEFs (A and B) and HCT116 cells (C and D), derived from GRO-Seq (MEFs) and PRO-Seq (HCT116) data. (A) MD score difference for TFs in IFN-γ-stimulated (IFN30) vs. unstimulated (IFN0) MEFs (IFN30 vs. IFN0). STAT1 and STAT5b motifs are significantly enriched upon IFN-γ stimulation. (B) Effect of CA treatment on MD score during IFN-γ response (IFN30.CA vs. IFN0). STAT1 and STAT5b motifs enriched in (A) are not enriched upon CA treatment. (C) MD score difference for TFs in IFN-γ-stimulated (IFN) vs. unstimulated (PBS) WT HCT116 cells with 3MB-PP1 treatment (3MB.IFN vs. 3MB.PBS). TF motifs for IFN and JAK-STAT pathways (IRF1, IRF2, IRF3, STAT2) are significantly enriched upon IFN-γ stimulation. (D) Effect of CDK8 inhibition on MD score during IFN-γ response (CDK8as 3MB.IFN vs. 3MB.PBS). TF motifs for IFN and JAK-STAT pathways (IRF1, IRF2, IRF3, STAT2) enriched in (C) are not enriched upon CDK8 inhibition.
Figure 4.
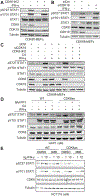
Figure 4.. CDK8, not CDK19, is the major STAT1 AD kinase in the IFN-γ response
(A) Inducible CDK8 knockout (CDK8-iKO) in CDK8fl-MEFs using 4-hydroxytamoxifen (4OHT) treatment. Cells were 4OHT-treated to activate CreERT2 or control-treated, followed by IFN-γ stimulation (45 min) and subsequent Western analysis using antibodies against phosphorylated STAT1 (pS727 or pY701 STAT1) and total STAT1, CDK8, CDK19 and tubulin. (B) siRNA knockdown of CDK19 (siCDK19). CDK8fl-MEFs were treated with siCDK19 or non-targeting siCtrl followed by IFN-γ stimulation and immunoblotting as in (A). Quantitative evaluation of blot is shown in Figure S4C. (C) Effects of inducible CDK8 knockout (CDK8-iKO), CDK19 knockdown (siCDK19), and Mediator kinase inhibition (CA) on IFN-γ-induced STAT1 S727 phosphorylation. Treatments and immunoblotting as in (A, B). Note siCDK19 had no effect on IFN-γ-induced STAT1 S727 phosphorylation (lane 6 vs. lane 3). (D and E) Effects of CDK8 inhibition (analog-sensitive mutant CDK8as) on IFN-γ-induced STAT1 S727 phosphorylation. (D) HAP1 cells expressing WT or CDK8as from the endogenous locus were treated with NM-PP1 (10 μM, 4 h), CA (100 nM, 1 h) or control-treated before stimulation with IFN-γ (45 min). Extracts analyzed as in (A). Note inhibition of IFN-γ-induced STAT1 S727 phosphorylation by NM-PP1 was comparable to that by CA. (E) HCT116 cells expressing WT or CDK8as from the endogenous locus were simultaneously treated with 3MB-PP1 (or DMSO control) and IFN-γ for 45 min. Extracts were analyzed as in (A).
Figure 5.
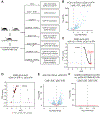
Figure 5.. CA has no effects on IFN-γ-regulated transcription in the absence of CDK8 and CDK19
(A) Experimental overview. RNA-Seq experiments were completed using 3 replicates for each condition (8 conditions total; siCtrl: control condition). (B) IFN-γ-induced gene expression changes (mRNA) in siCtrl cells (siCtrl 3 h IFN vs. siCtrl 0 h IFN). (C) GSEA of IFN-γ-induced changes in siCtrl cells (siCtrl 3 h IFN vs. siCtrl 0 h IFN). Gene sets representing IFN and JAK-STAT pathways are highlighted. (D) GSEA of CA effects on IFN-γ-induced (3 h) changes in siCtrl cells (siCtrl CA IFN vs. siCtrl IFN). (E) CA effects on gene expression changes (mRNA) upon IFN-γ stimulation (3 h) in siCtrl cells (siCtrl CA IFN vs. siCtrl IFN). (F) CA effects on gene expression changes (mRNA) in absence of CDK8 and CDK19 during IFN-γ stimulation (3 h) (siCDK19 CDK8-iKO CA IFN vs. siCDK19 CDK8-iKO IFN). Note that no genes significantly (blue) up- or down-regulated by CA.
Figure 6.
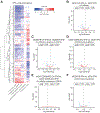
Figure 6.. Transcriptional response to IFN-γ is predominantly executed by kinase-dependent effects of CDK8 and kinase-independent effects of CDK19
(A - F) CDK8fl-MEFs were treated as described in Figure 5A and assessed by differential mRNA expression (3 biological RNA-Seq replicates each). (A) Heat map summarizing mRNA expression changes caused by CA, CDK8 knockout and CDK19 knockdown in group of IFN-γ-induced genes. Genes induced by IFN-γ (lfc ≥ 1, padj < 0.05, FPKM stimulated ≥ 1) in siCtrl-treated CDK8fl-MEFs (siCtrl) were analyzed under the following conditions: CA treatment (CDK8+CDK19 inhibition), lane 1; CA treatment in absence of CDK19 (i.e., CDK8 inhibition), lane 2; inducible CDK8 knockout (CDK8-iKO), lane 3; CA treatment in absence of CDK8 (i.e., CDK19 inhibition) lane 4; CDK19 knockdown, lane 5. Only genes that changed (padj < 0.05) in at least one of the 5 conditions are shown. (B - F) Volcano plots corresponding to treatments shown in (A). Panel order (B - F) corresponds to lane order in (A). No significant (padj < 0.05) gene expression changes upon CA treatment of CDK8 knockout cells (CDK19 inhibition: siCtrl CDK8-iKO CA vs. siCtrl CDK8-iKO) (E).
Figure 7.
Figure 7.. CDK19 drives the IFN-γ anti-viral response in kinase-independent ways
(A) IFN-γ-dependent antiviral response in the absence of CDK19. siCDK19 and siCtrl cells were pre-treated with various concentrations of IFN-γ followed by infection with vesicular stomatitis virus (VSV). Percentages of surviving cells and EC50 values (IFN-γ concentration needed to prevent 50% cell death) are shown (as means of duplicate experiments). (B) Assessment of IFN-γ-dependent antiviral response of CDK19-KO cells rescued with CDK19-WT or CDK19-KDead. CDK19-KO, CDK19-WT and CDK19-KDead cells were IFN-γ-treated and VSV-infected and analyzed as in (A). (C and D) Overlap of IFN-γ-induced genes upregulated (C) or downregulated (D) upon rescue of CDK19-KO cells with CDK19-WT or CDK19-KDead. Data derived from RNA-Seq of CDK19-KO, CDK19-WT and CDK19-KDead stimulated with IFN-γ for 3 h. (E) Heat map summarizing expression changes of IFN-γ-induced genes (lfc ≥ 1, padj < 0.05, FPKM stimulated ≥ 1) upon rescue of CDK19-KO cells with CDK19-WT or CDK19-KDead.

Similar articles

Cited by

References

    1. Allen BL, and Taatjes DJ (2015). The Mediator complex: a central integrator of transcription. Nat Rev Mol Cell Biol 16, 155–166. - PMC - PubMed
    1. Allen MA, Andrysik Z, Dengler VL, Mellert HS, Guarnieri A, Freeman JA, Sullivan KD, Galbraith MD, Luo X, Kraus WL, et al. (2014). Global analysis of p53-regulated transcription identifies its direct targets and unexpected regulatory mechanisms. eLife 3, e02200. - PMC - PubMed
    1. Anders S, Pyl PT, and Huber W (2015). HTSeq--a Python framework to work with high-throughput sequencing data. Bioinformatics (Oxford, England) 31, 166–169. - PMC - PubMed
    1. Arner E, Daub CO, Vitting-Seerup K, Andersson R, Lilje B, Drablos F, Lennartsson A, Ronnerblad M, Hrydziuszko O, Vitezic M, et al. (2015). Transcribed enhancers lead waves of coordinated transcription in transitioning mammalian cells. Science 347, 1010–1014. - PMC - PubMed
    1. Audetat KA, Galbraith MD, Odell AT, Lee T, Pandey A, Espinosa JM, Dowell RD, and Taatjes DJ (2017). A Kinase-Independent Role for Cyclin-Dependent Kinase 19 in p53 Response. Mol Cell Biol 37. - PMC - PubMed

Publication types

MeSH terms