. 2019 Sep 6:8:e42951.
doi: 10.7554/eLife.42951.

Regulator of G protein signaling 12 enhances osteoclastogenesis by suppressing Nrf2-dependent antioxidant proteins to promote the generation of reactive oxygen species

Affiliations

Regulator of G protein signaling 12 enhances osteoclastogenesis by suppressing Nrf2-dependent antioxidant proteins to promote the generation of reactive oxygen species

Andrew Ying Hui Ng et al. Elife. .

Abstract

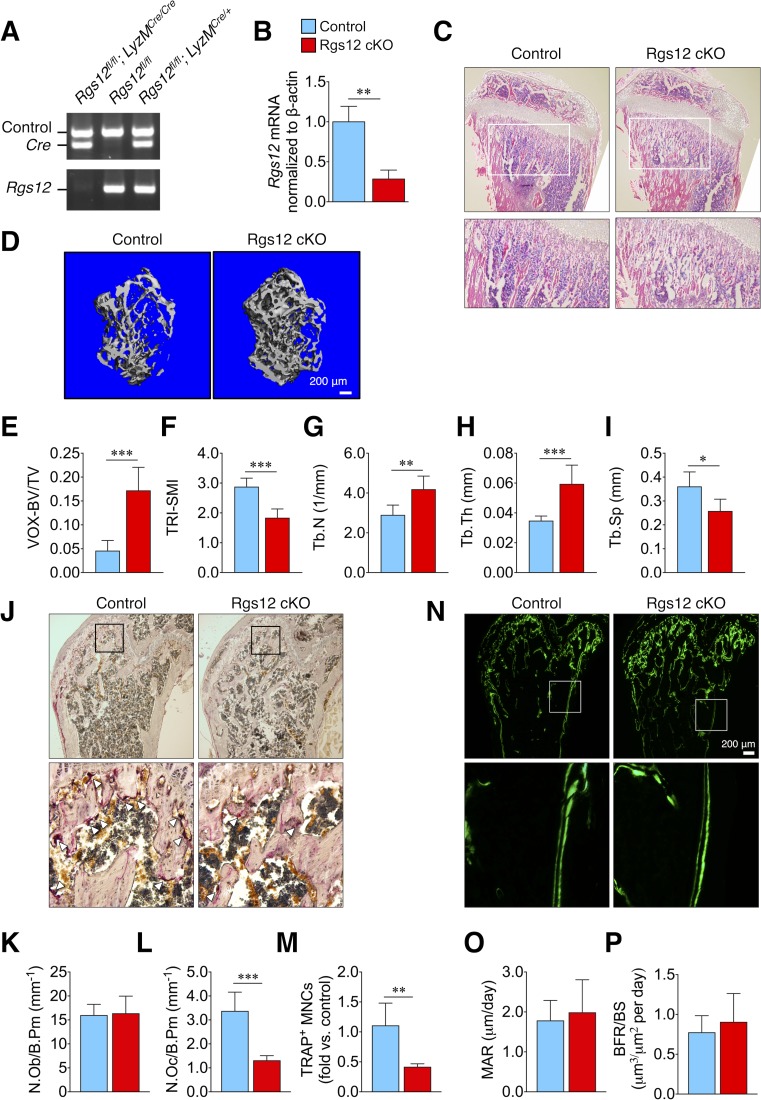
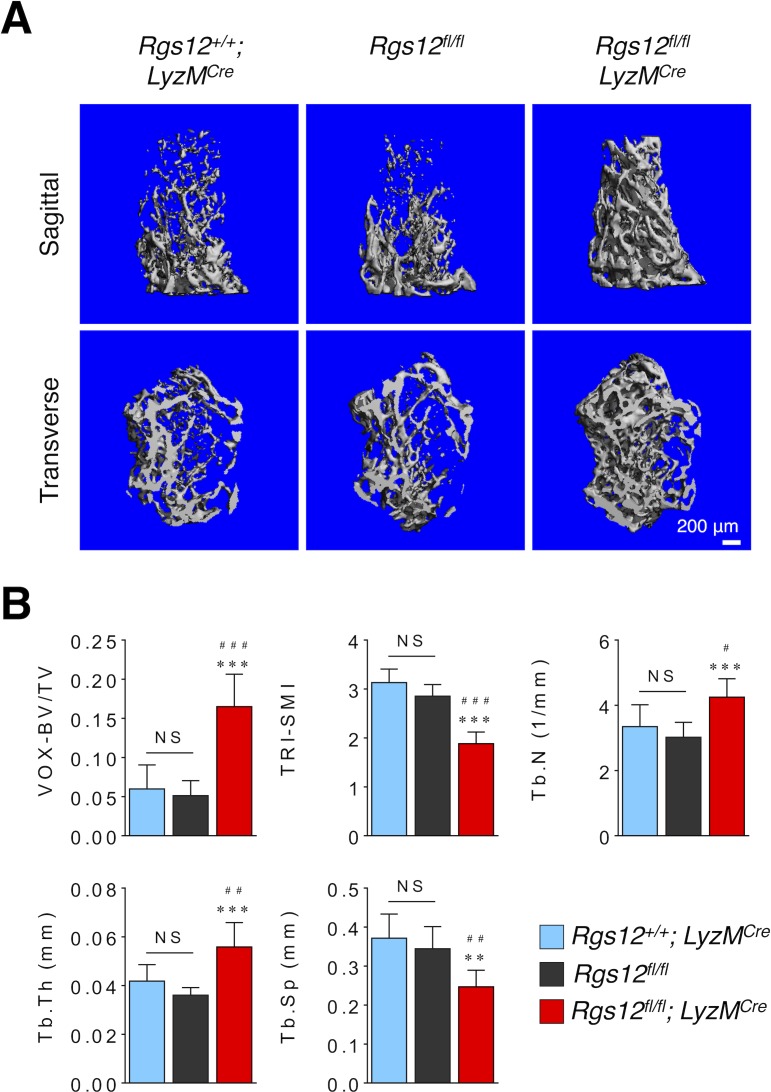
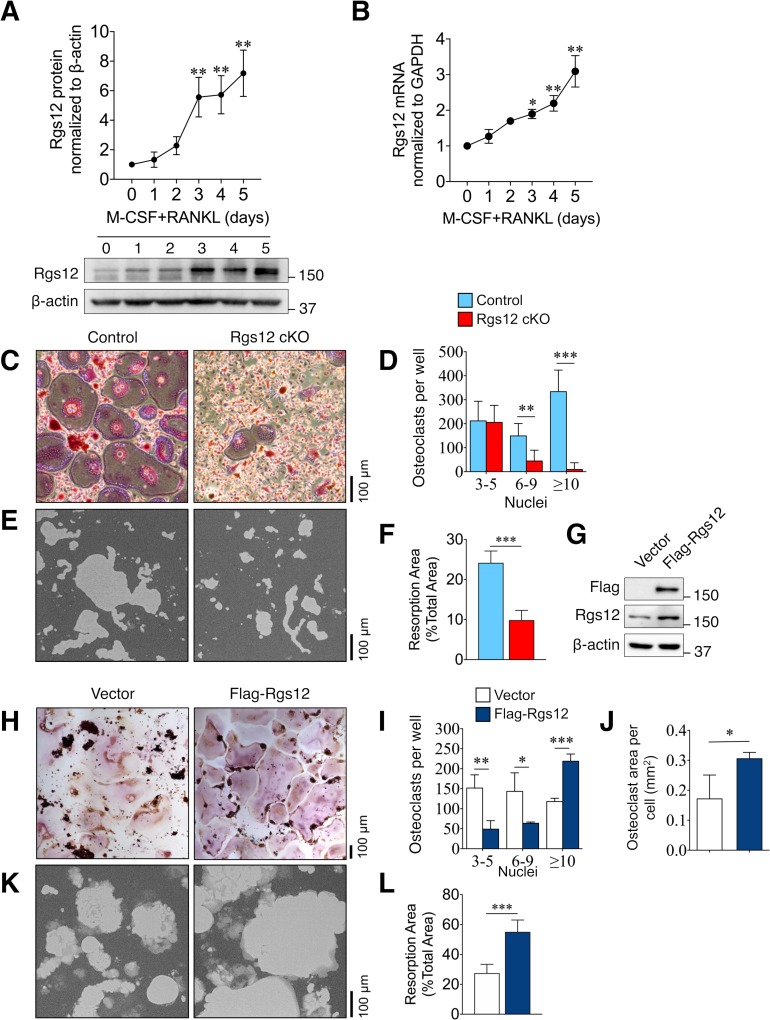
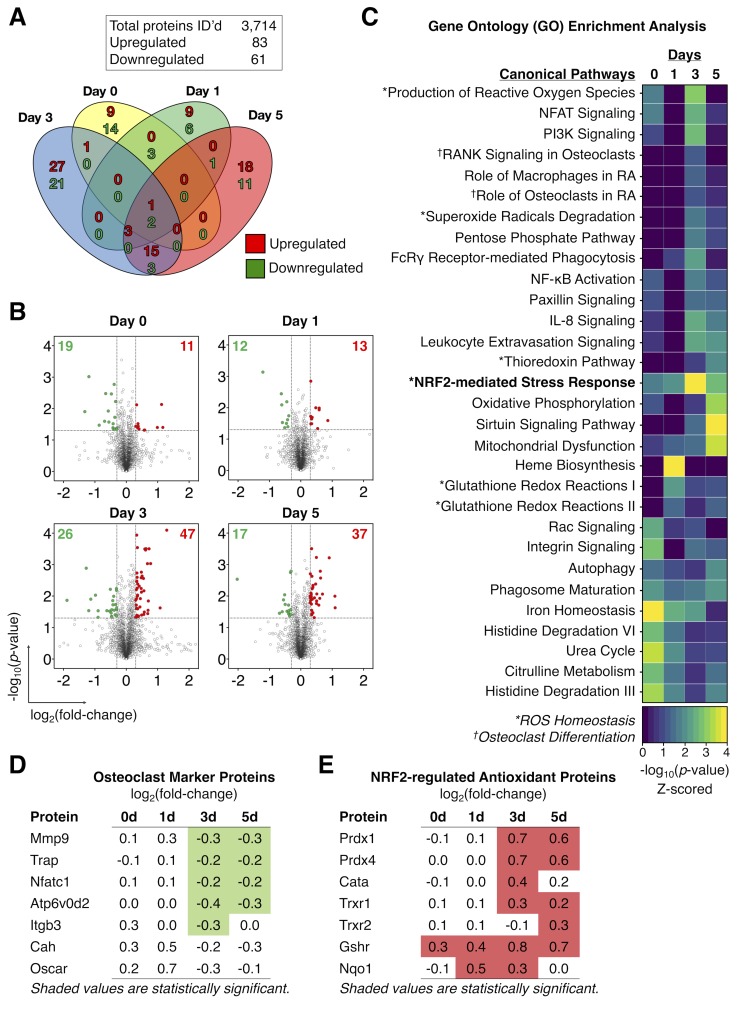
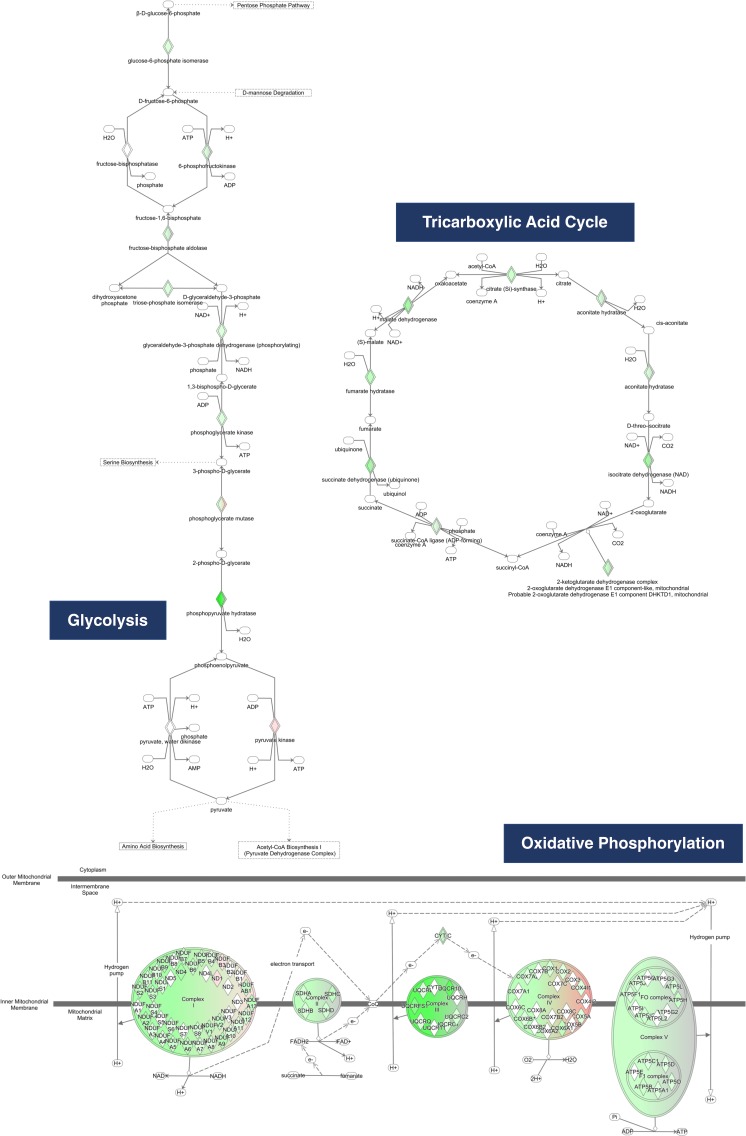
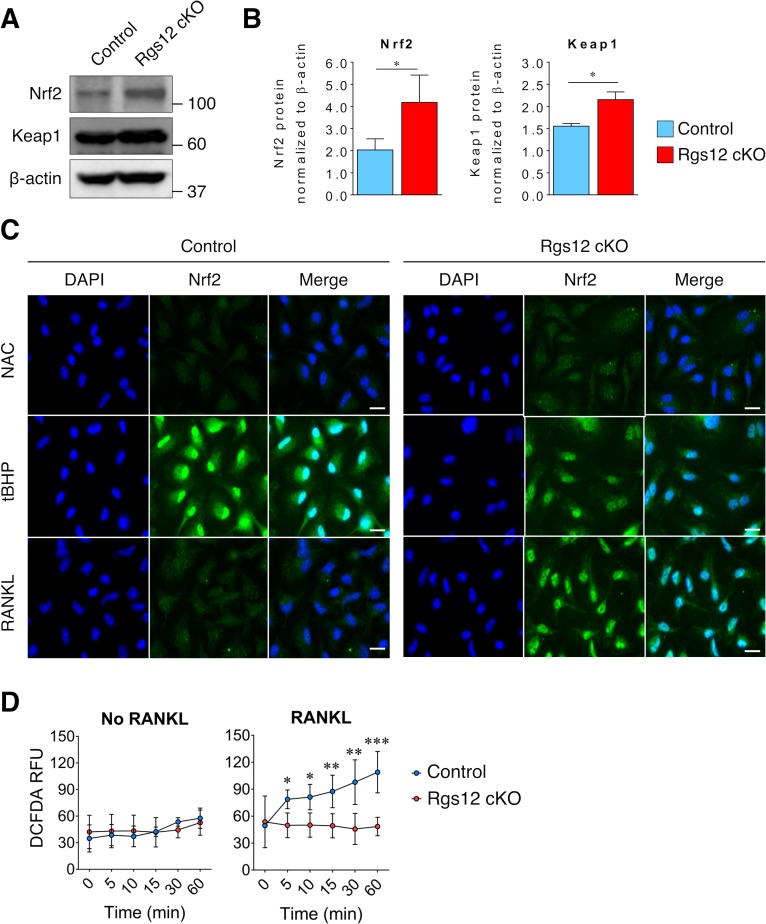
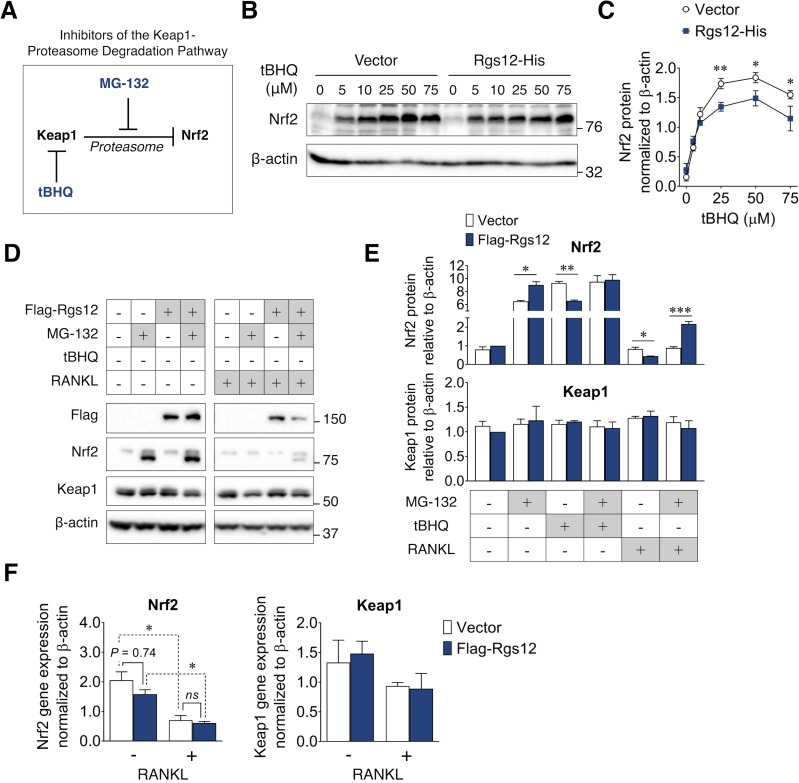
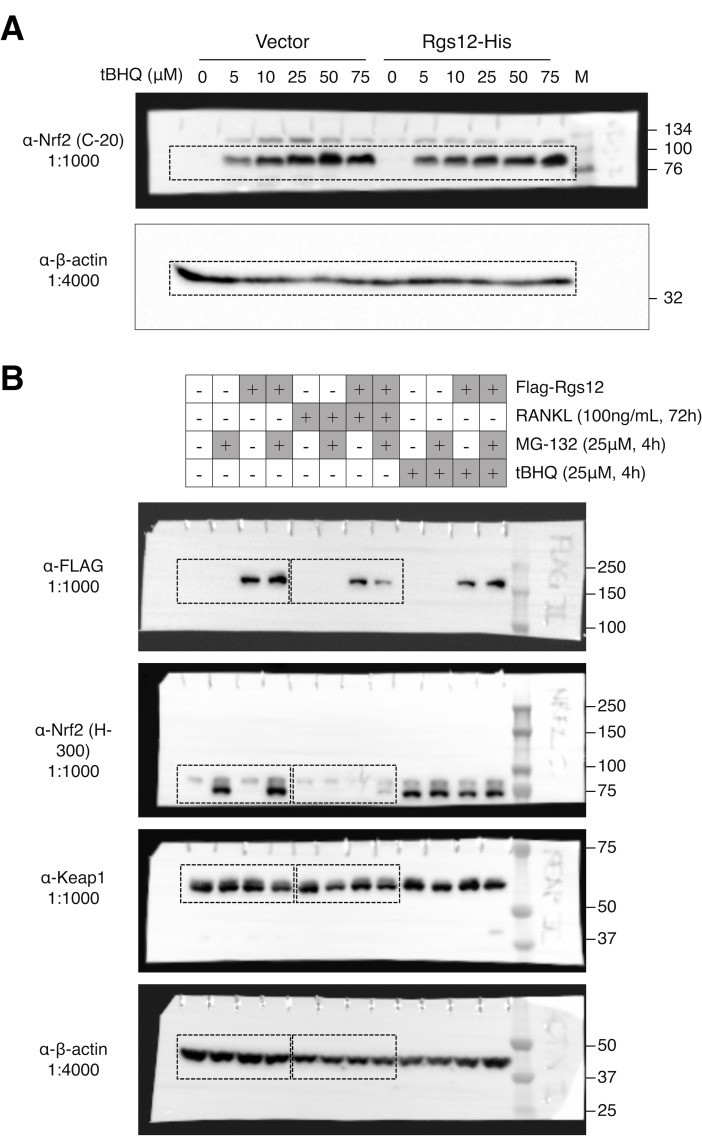
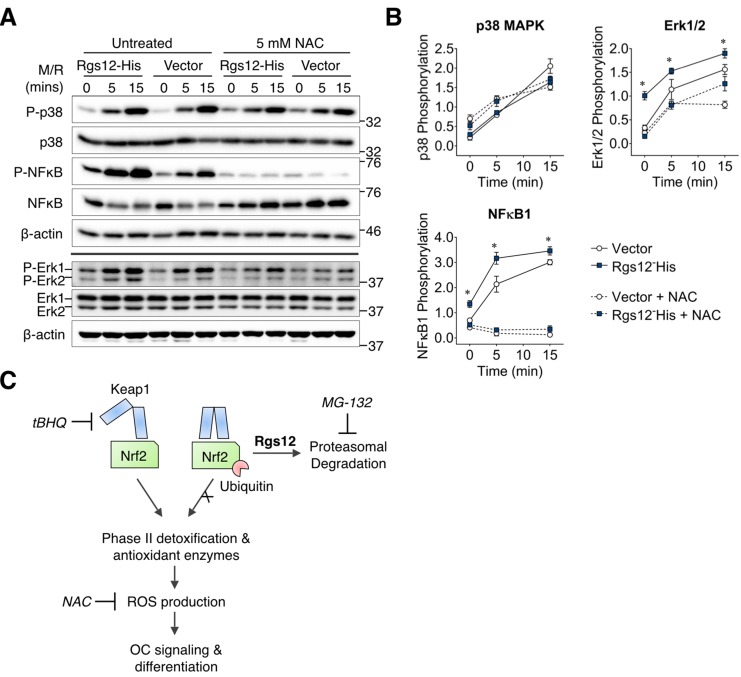
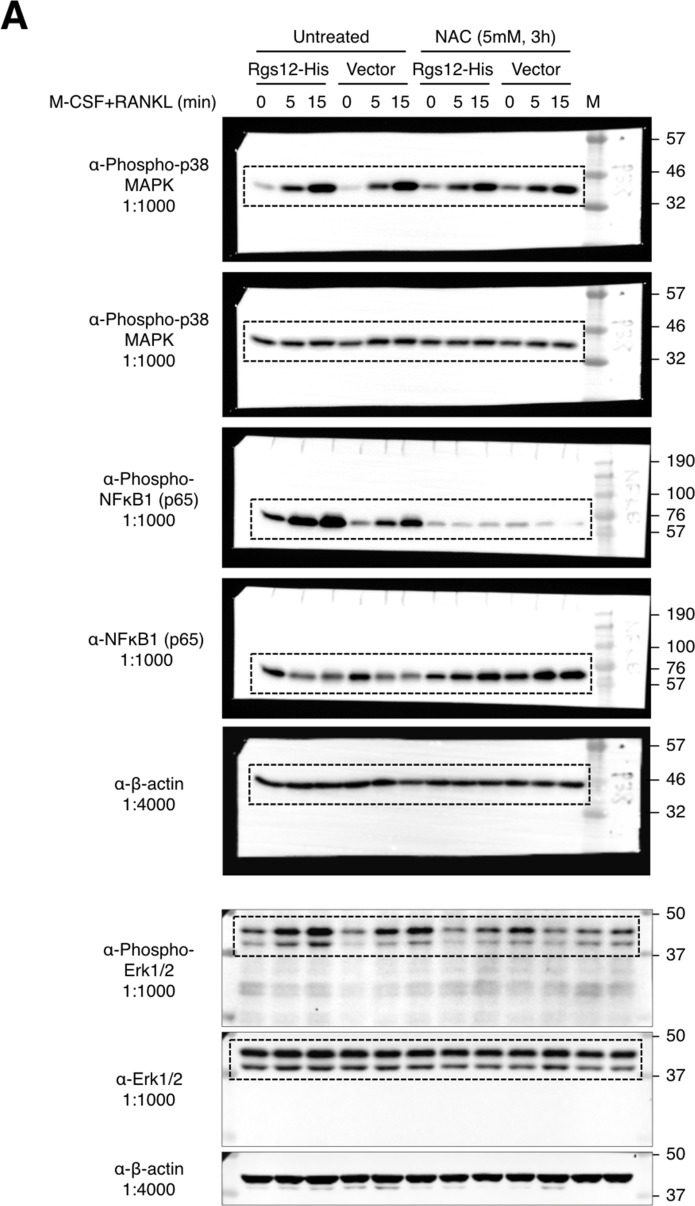
Regulators of G-protein Signaling are a conserved family of proteins required in various biological processes including cell differentiation. We previously demonstrated that Rgs12 is essential for osteoclast differentiation and its deletion in vivo protected mice against pathological bone loss. To characterize its mechanism in osteoclastogenesis, we selectively deleted Rgs12 in C57BL/6J mice targeting osteoclast precursors using LyzM-driven Cre mice or overexpressed Rgs12 in RAW264.7 cells. Rgs12 deletion in vivo led to an osteopetrotic phenotype evidenced by increased trabecular bone, decreased osteoclast number and activity but no change in osteoblast number and bone formation. Rgs12 overexpression increased osteoclast number and size, and bone resorption activity. Proteomics analysis of Rgs12-depleted osteoclasts identified an upregulation of antioxidant enzymes under the transcriptional regulation of Nrf2, the master regulator of oxidative stress. We confirmed an increase of Nrf2 activity and impaired reactive oxygen species production in Rgs12-deficient cells. Conversely, Rgs12 overexpression suppressed Nrf2 through a mechanism dependent on the 26S proteasome, and promoted RANKL-induced phosphorylation of ERK1/2 and NFκB, which was abrogated by antioxidant treatment. Our study therefore identified a novel role of Rgs12 in regulating Nrf2, thereby controlling cellular redox state and osteoclast differentiation.

Keywords: cell biology; mouse; osteoclasts; proteomics; reactive oxygen species.


Conflict of interest statement

AN, ZL, MJ, SY, CL, CF, CT, MO, JQ, SY No competing interests declared

Figures

Figure 1.
Figure 1.. Rgs12-deficient mice exhibit increased trabecular bone mass attributed to impaired osteoclastogenesis.
(A) PCR of splenic genomic DNA amplifying the deletion allele in Rgs12 cKO and control mice. (B) qPCR analysis of Rgs12 mRNA levels normalized to β-actin in BMMs obtained from Rgs12 cKO and control mice. Histological assessment of bone morphology and microarchitecture of Rgs12 cKO and control mice include: (C) H and E staining of proximal tibiae (N = 4), (D) 3D micro-computed tomography (micro-CT) imaging and (E–I) quantitative measurement of femoral trabecular bone (NControl = 11, NRgs12cKO=7), (J) TRAP staining and quantitation of (K) OBs and (L–M) OCs in distal femurs (N = 5), and (N) dynamic histomorphometry analysis by double-calcein labeling and (O–P) quantitative measurements of bone formation in distal femurs (N = 5). All results are means ± SD (*p<0.05, **p<0.01, ***p<0.001). VOX-BV/TV, bone volume to tissue volume (voxel count); TRI-SMI, structure model index; Tb.Th, trabecular thickness; Tb.N, trabecular number; Tb.Sp, trabecular separation; N.Ob/B.Pm, osteoblast number per bone perimeter; N.Oc/B.Pm, osteoclast number per bone perimeter; TRAP, tartrate-resistant acid phosphatase; MNC, multinucleated cell; MAR, mineral apposition rate; BFR/BS, bone formation rate per bone surface.
Figure 1—figure supplement 1.
Figure 1—figure supplement 1.. Bone histomorphometry is not significantly different between Rgs12+/+;LyzMCre (N = 5) and Rgs12flox/flox mice (N = 11), but significantly different between Rgs12+/+;LyzMCre (N = 5) and Rgs12flox/flox;LyzMCre mice (N = 7).
(A) Micro-CT imaging and (B) quantitative measurements of trabecular bone of distal femurs. All results are means ± SD (*p<0.05, **p<0.01, ***p<0.001 vs Rgs12flox/flox mice; #p<0.05, ##p<0.01, ###p<0.001 vs Rgs12+/+;LyzMCre; NS, not statistically significant).
Figure 2.
Figure 2.. Rgs12 is essential for osteoclast differentiation and bone resorption.
(A) Rgs12 protein and (B) mRNA expression in wild-type BMMs stimulated with M-CSF and RANKL for the indicated times. (C) TRAP-stained osteoclasts differentiated from BMMs isolated from Rgs12 cKO and control mice and the (D) number of TRAP-positive and multinucleated (≥3 nuclei) OCs were counted (N = 4). (E–F) Bone resorption activity of OCs derived from Rgs12 cKO and control BMMs cultured on calcium phosphate-coated plastic (N = 5). The light-colored areas correspond to areas resorbed by OCs was quantified and presented as values relative to the total area measured. (G) Immunoblot to verify Rgs12 overexpression in RAW264.7 cells transfected with a vector carrying a recombinant N-terminus FLAG-tagged Rgs12 gene (Flag-Rgs12). RAW264.7 cells transfected with the empty vector was used as a negative control. (H) TRAP-stained osteoclasts derived from RAW264.7 cells transfected with an empty vector or Flag-Rgs12 and the (I) number of TRAP-positive and multinucleated (≥3 nuclei) osteoclasts from vector- and Flag-Rgs12-transfected RAW264.7 cells (N = 3). (J) OC size was estimated by quantifying the surface area of OCs containing 10+ nuclei normalized to the number of OCs with 10+ nuclei (N = 3). (K–L) Bone resorption activity of OCs derived from RAW264.7 cells transfected with empty vector or Flag-Rgs12 (N = 5). All results are means ± SD. Student’s t test was used in all cases except for Figure 1A and B wherein one-way ANOVA was used (*p<0.05, **p<0.01, ***p<0.001). TRAP, tartrate-resistant acid phosphatase.
Figure 2—figure supplement 1.
Figure 2—figure supplement 1.. Complete western blots used for Figure 2C.
Figure 3.
Figure 3.. Proteomics analysis identified an increased expression of Nrf2-dependent antioxidant proteins in Rgs12-deficient osteoclast precursors.
(A) Venn diagram summarizing the distribution of proteins that were significantly altered in Rgs12 cKO BMMs as compared to control at 0, 1, 3, and 5 days of OC differentiation. (B) Volcano plots depicting protein expression changes in Rgs12 cKO BMMs as compared to control cells. Optimized cutoff thresholds for significantly altered proteins was set at 1.3 log2-transformed ratios and p-value<0.05. Data are means ± SD. Student’s t test was performed to compare Rgs12 cKO and control BMMs at each time point (N = 3). (C) Gene ontology (GO) enrichment analysis to identify canonical pathways corresponding to the significantly altered proteins. For visualization purposes, the color intensity in the heat map diagram indicates the significance of GO term enrichment, presented as –log10(P-value). Hierarchical clustering analysis was used to group GO terms based on the p-value of enrichment. (D–E) The expression of OC marker proteins and Nrf2-regulated antioxidant proteins in Rgs12 cKO versus control BMMs. Mmp9, metalloproteinase-9; Trap, tartrate-resistant acid phosphatase; Nfatc1, nuclear factor of activated T cells, cytoplasmic 1; Atp6v0d2, ATPase H+ transporting V0 subunit D2; Itgb3, integrin β3; Prdx, peroxiredoxin; Cata, catalase; Trxr, thioredoxin; Gshr, glutathione reductase; Nqo1, NAD(P)H dehydrogenase quinone 1.
Figure 3—figure supplement 1.
Figure 3—figure supplement 1.. Proteins in the glycolysis, tricarboxylic acid, and oxidative phosphorylation pathways examined by the Ingenuity Pathway Analysis software.
Green- and red-shaded nodes indicate downregulated and upregulated protein expression, respectively, but no log2-ratio or P-value constraints were used.
Figure 4.
Figure 4.. Increased Nrf2 activation and expression of antioxidant proteins in Rgs12-deficient osteoclast precursors.
(A–B) Immunoblot of Nrf2 and Keap1 protein levels in Rgs12 cKO and control BMMs treated with RANKL for 72 hr. Densitometry analysis was performed on bands and normalized to β-actin (N = 3, *p<0.05). (C) Nrf2 immunofluorescence staining in Rgs12 cKO and control BMMs differentiated with M-CSF and RANKL for 72 hr. As a negative control for Nrf2 nuclear translocation, cells were treated with the antioxidant compound NAC (5 mM, 16 hr) to suppress cellular ROS. Conversely, as a positive control for Nrf2 nuclear translocation, cells were treated with the peroxidase tBHP (50 μM, 16 hr) to induce oxidative stress. (D) Induction of ROS levels in Rgs12 cKO and control BMMs differentiated for 72 hr, kept in serum-free medium for 6 hr, and stimulated with RANKL for the indicated times. ROS levels were measured using the DCFDA fluorescence method. Data are means ± SD (N = 5, *p<0.05, **p<0.01, ***p<0.001). DAPI, 4,6-diamidino-2-phenylindole; NAC, N acetylcysteine; tBHP, tert-butylhydroxyperoxide. ROS, reactive oxygen species. DCFDA, 2’,7’-dichlorofluorescin diacetate. RFU, relative fluorescence units..
Figure 5.
Figure 5.. Suppression of Nrf2 protein levels by Rgs12 is dependent on the proteasome degradation pathway.
(A) Diagram summarizing the inhibitors of the Keap1-proteasome axis to modulate Nrf2 protein levels. (B) RAW264.7 cells stably-transfected with Rgs12-His or empty vector treated with increasing doses of tBHQ. (C) Nrf2 and Keap1 protein levels were quantified by densitometry analysis and normalized to β-actin (N = 3, *p<0.05, **p<0.01). (D) Western blot to detect Nrf2 and Keap1 in RAW264.7 cells stably-transfected with empty vector or Flag-Rgs12. RAW264.7 cells were treated with a combination of RANKL (100 ng/mL, 72 hr) and the proteasome inhibitor MG-132 (25 μM, 4 hr). (E) Nrf2 and Keap1 protein levels were quantified by densitometry analysis and normalized to β-actin (N = 3, *p<0.05, **p<0.01, ***p<0.001). (F) qPCR analysis of Nrf2 and Keap1 transcript levels in RAW264.7 cells transfected with Rgs12-His or empty vector. Data are means ± SD. Two-tailed t test was performed (N = 3, *p<0.05). tBHQ, tert-butylhydroquinone.
Figure 5—figure supplement 1.
Figure 5—figure supplement 1.. Complete western blots shown in Figure 5.
(A) Complete western blots used in Figure 5B. Sections shown in Figure 5B are highlighted with dashed boxes. Transfected RAW264.7 cells were induced with the indicated dosages of tBHQ for 4 hr. (B) Complete western blots used in Figure 5D. Sections shown in Figure 5D are highlighted with dashed boxes. RAW264.7 cells stably-transfected with empty vector or Flag-Rgs12 were treated with the following: RANKL (100 ng/mL, 72 hr), MG-132 (25 μM, 4 hr), and/or tBHQ (25 μM, 4 hr). tBHQ, tert-butylhydroquinone.
Figure 6.
Figure 6.. Rgs12-dependent activation of ERK1/2 and NFκB was suppressed by antioxidants.
(A) Western blot detected phosphorylated or total p38, NFκB, and Erk1/2 in transfected RAW264.7 cells induced with RANKL (200 ng/mL) and M-CSF (100 ng/mL) for the indicated times. Cells were pretreated with NAC (5 mM, 4 hr) to suppress intracellular ROS. (B) Band density was quantified by ImageJ and phosphorylated and unphosphorylation/total protein levels were normalized to β-actin. Relative phosphorylation is presented as the ratio between the phosphorylated normalized to the nonphosphorylated/total protein. Two-tailed t tests were used to compare vector and Rgs12-His groups (N = 3, *p<0.05). (C) Model of the role of Rgs12 in suppressing Nrf2 to promote ROS and OC differentiation. M/R, M-CSF and RANKL. NAC, N-acetylcysteine.
Figure 6—figure supplement 1.
Figure 6—figure supplement 1.. Complete western blots shown in Figure 6.

Similar articles

Cited by

References

    1. Abiko Y, Miura T, Phuc BH, Shinkai Y, Kumagai Y. Participation of covalent modification of Keap1 in the activation of Nrf2 by tert-butylbenzoquinone, an electrophilic metabolite of butylated hydroxyanisole. Toxicology and Applied Pharmacology. 2011;255:32–39. doi: 10.1016/j.taap.2011.05.013. - DOI - PubMed
    1. Abram CL, Roberge GL, Hu Y, Lowell CA. Comparative analysis of the efficiency and specificity of myeloid-Cre deleting strains using ROSA-EYFP reporter mice. Journal of Immunological Methods. 2014;408:89–100. doi: 10.1016/j.jim.2014.05.009. - DOI - PMC - PubMed
    1. Amin S, Achenbach SJ, Atkinson EJ, Khosla S, Melton LJ. Trends in fracture incidence: a population-based study over 20 years. Journal of Bone and Mineral Research. 2014;29:581–589. doi: 10.1002/jbmr.2072. - DOI - PMC - PubMed
    1. An E, Narayanan M, Manes NP, Nita-Lazar A. Characterization of functional reprogramming during osteoclast development using quantitative proteomics and mRNA profiling. Molecular & Cellular Proteomics. 2014;13:2687–2704. doi: 10.1074/mcp.M113.034371. - DOI - PMC - PubMed
    1. Bartell SM, Kim H-N, Ambrogini E, Han L, Iyer S, Serra Ucer S, Rabinovitch P, Jilka RL, Weinstein RS, Zhao H, O’Brien CA, Manolagas SC, Almeida M. FoxO proteins restrain osteoclastogenesis and bone resorption by attenuating H2O2 accumulation. Nature Communications. 2014;5:e3773. doi: 10.1038/ncomms4773. - DOI - PMC - PubMed

Publication types