. 2019 Aug 27;20(17):4203.
doi: 10.3390/ijms20174203.

Physiologically Relevant Oxygen Concentration (6% O2) as an Important Component of the Microenvironment Impacting Melanoma Phenotype and Melanoma Response to Targeted Therapeutics In Vitro

Affiliations

Physiologically Relevant Oxygen Concentration (6% O2) as an Important Component of the Microenvironment Impacting Melanoma Phenotype and Melanoma Response to Targeted Therapeutics In Vitro

Marta Osrodek et al. Int J Mol Sci. .

Abstract

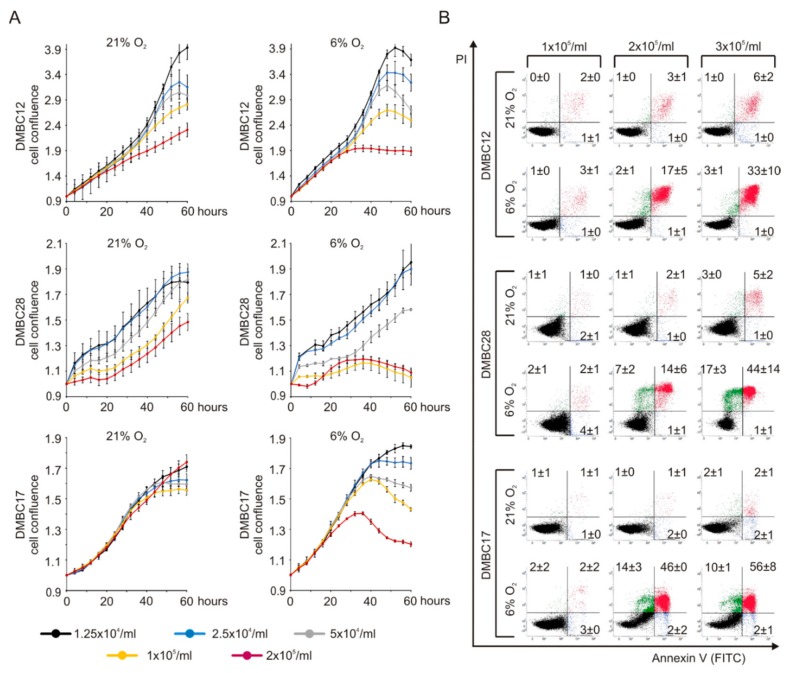
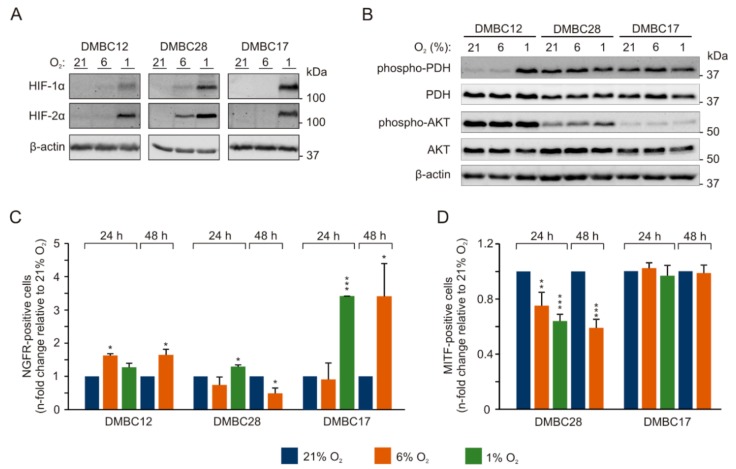
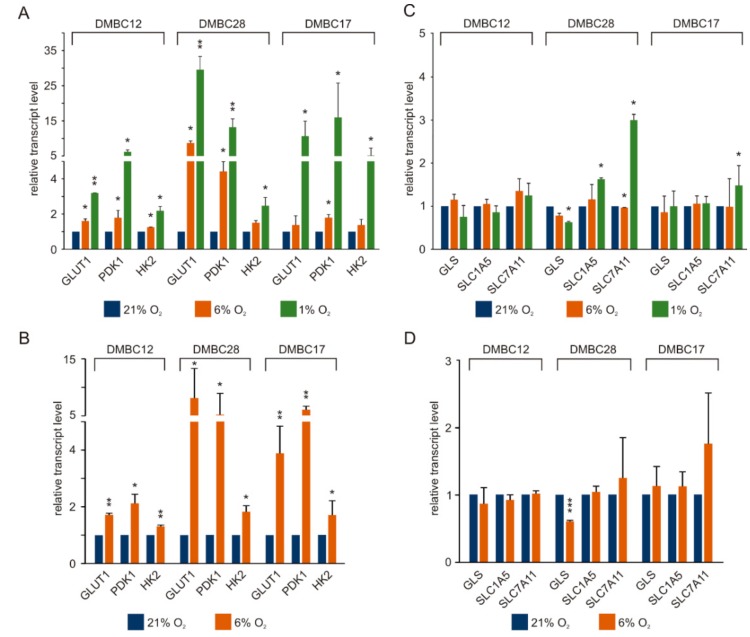
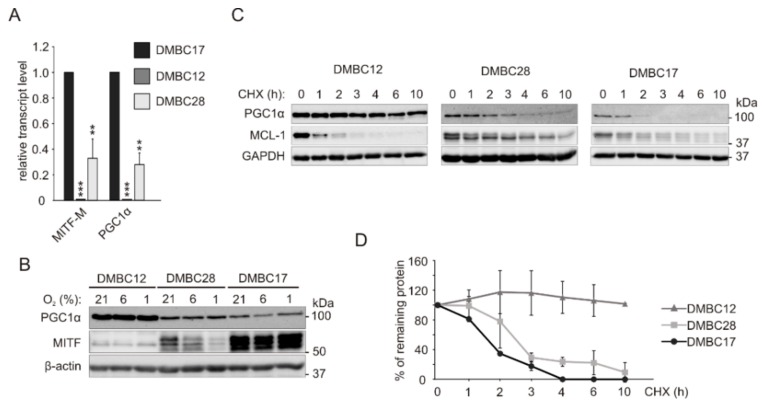
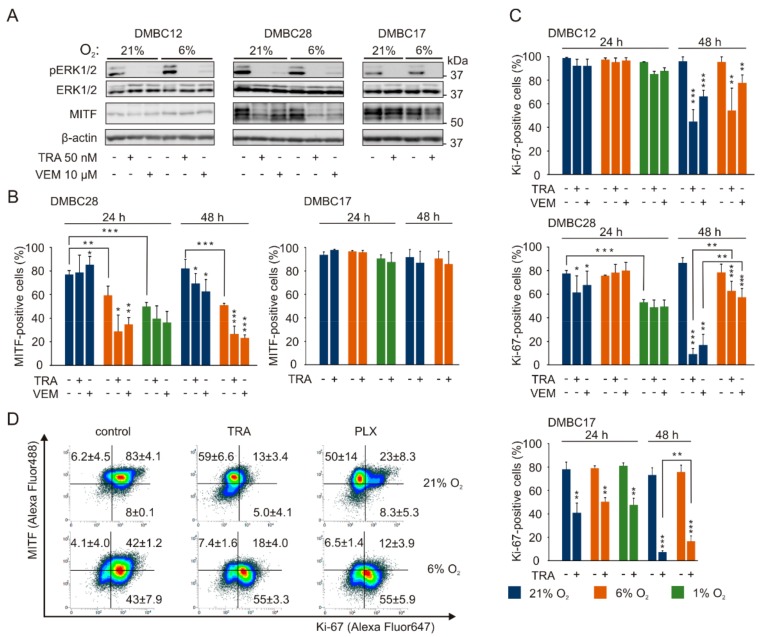
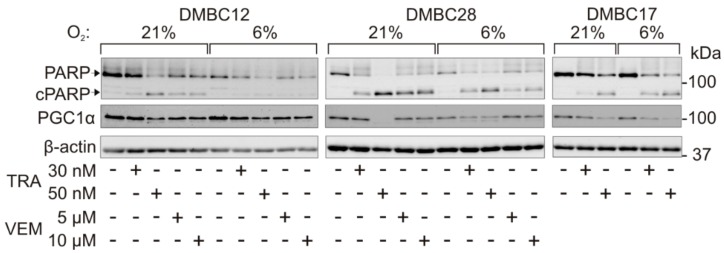
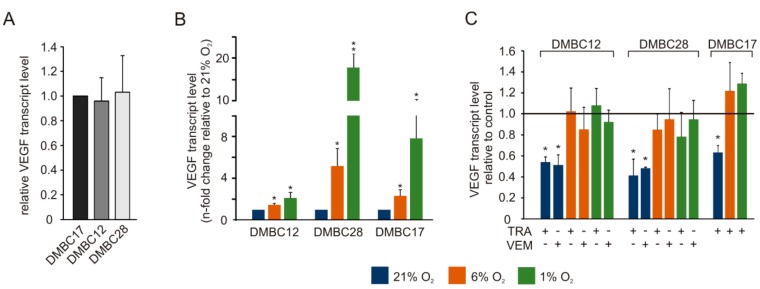
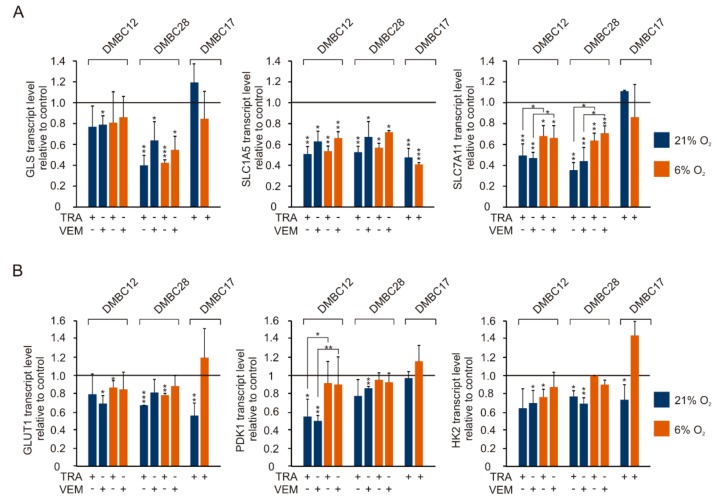
Cancer cell phenotype largely depends on oxygen availability. The atmospheric oxygen concentration (21%) used in in vitro studies is much higher than in any human tissue. Using well-characterized patient-derived melanoma cell lines, we compared: (i) activities of several signaling pathways, and (ii) the effects of vemurafenib and trametinib in hyperoxia (21% O2), normoxia (6% O2) and hypoxia (1% O2). A high plasticity of melanoma cells in response to changes in oxygen supplementation and drug treatment was observed, and the transcriptional reprograming and phenotypic changes varied between cell lines. Normoxia enhanced the expression of vascular endothelial growth factor (VEGF), glucose metabolism/transport-related genes, and changed percentages of NGFR- and MITF-positive cells in cell line-dependent manner. Increased protein stability might be responsible for high PGC1α level in MITFlow melanoma cells. Vemurafenib and trametinib while targeting the activity of MAPK/ERK pathway irrespective of oxygen concentration, were less effective in normoxia than hyperoxia in reducing levels of VEGF, PGC1α, SLC7A11 and Ki-67-positive cells in cell line-dependent manner. In conclusion, in vitro studies performed in atmospheric oxygen concentration provide different information on melanoma cell phenotype and response to drugs than performed in normoxia, which might partially explain the discrepancies between results obtained in vitro and in clinical settings.

Keywords: MITF; PGC1α; cancer heterogeneity; cellular metabolism; hypoxia; melanoma; normoxia; trametinib; vemurafenib.


Conflict of interest statement

The authors declare no conflict of interest.

Figures

Figure 1
Figure 1
Proliferation and survival of melanoma cells cultured in 6% O2 greatly depend on melanoma cell density. (A) Proliferation time-courses of melanoma cells of varying seeding densities in 21% O2 and 6% O2. Cell proliferation was measured as changes in the occupied area over time using IncuCyte, and shown as fold-change relative to the confluence at time T0. (B) Representative dot plots of Annexin V/propidium iodine (PI) stained cells after 72 h in culture, showing early apoptotic (blue), late apoptotic (red), and necrotic (green) cells. Numbers in each quadrant are percentages of cells (mean values of three biological replicates ± SD). DMBC, melanoma cell populations obtained at the Department of Molecular Biology of Cancer from surgical specimens.
Figure 2
Figure 2
Phenotypic alterations in melanoma cells in different oxygen concentrations depend on initial phenotype of melanoma cells. Melanoma cells were incubated at different oxygen concentrations, 21% O2 (hyperoxia) 6% O2 (normoxia) and 1% O2 (hypoxia). Protein levels of (A) HIF (hypoxia-inducible factor)-1α and HIF-2α and (B) p-PDH (phosphorylated pyruvate dehydrogenase, inactive form), PDH (total), p-AKT (phosphorylated protein kinase B) and total AKT were assessed by immunoblotting with representative images shown. β-actin was used as a loading control. The percentages of (C) NGFR (nerve growth factor receptor)-positive cells and (D) MITF (microphthalmia-associated transcription factor)-positive cells in normoxia and hypoxia relative to the standard culture conditions (21% O2). MITF-positive cells were almost undetectable in DMBC12 cell population (see Figure S1). n = 3, except for hypoxia (n = 2). Differences are considered significant at * p < 0.05, ** p < 0.01, *** p < 0.001.
Figure 3
Figure 3
Normoxia stimulates the expression of genes associated with glucose metabolism and to the lower extent with glutamine metabolism in cell line-dependent manner. (A) Transcript levels of GLUT1 (glucose transporter 1), PDK1 (pyruvate dehydrogenase kinase 1) and HK2 (hexokinase 2) in melanoma cells incubated in the presence of 21% O2, 6% O2 or 1% O2 for 24 h were determined by qRT-PCR and normalized to the expression of a reference gene RPS17. Gene expression in 6% O2 and 1% O2 is presented relative to the expression in 21% O2. (B) Transcript levels of GLUT1, PDK1 and HK2 in melanoma cells cultured in the presence of 6% O2 for at least 3 weeks (established 6% O2 culture) relative to their levels in cells cultured in 21% O2. (C) Transcript levels of GLS (glutaminase), SLC1A5 (solute carrier family 1 member 5) and SLC7A11 (solute carrier family 7 member 11 transporter) in melanoma cells after 24 h incubation in 21% O2, 6% O2 and 1% O2, or (D) in the established 6% O2 culture, relative to their levels in 21% O2. Bars represent mean values of 3-4 biological replicates ± SD. Differences are considered significant at * p < 0.05, ** p < 0.01 or *** p < 0.001.
Figure 4
Figure 4
PGC1α (peroxisome proliferator-activated receptor γ coactivator 1 alpha) protein accumulates in MITFlow melanoma cells. (A) Transcript levels of MITF-M and PGC1α were determined by qRT-PCR and normalized to the expression of a reference gene RPS17. Gene expression in DMBC12 and DMBC28 cells is shown relative to the expression in DMBC17 cells. Bars represent mean values of 3 biological replicates ± SD. Differences are considered significant at ** p < 0.01, *** p < 0.001. (B) Protein levels of MITF and PGC1α in different oxygen concentrations were assessed by western blot with representative images shown (n = 3). β-actin was used as a loading control. (C) For protein decay assay, melanoma cells were treated with 100 μg/mL cycloheximide (CHX) and protein levels of PGC1α and MCL-1 (myeloid cell leukemia 1) were determined at indicated time points. MCL-1, having short half-life, served as control of protein stability. GAPDH was used as a loading control. (D) Quantification of average protein levels of PGC1α calculated from two independent experiments.
Figure 5
Figure 5
Vemurafenib and trametinib while targeting the MAPK/ERK pathway irrespective of oxygen concentration, affect MITF-positive and Ki-67-positive melanoma cells in oxygen- and cell line-dependent manner. (A) The effects of trametinib (TRA) and vemurafenib (VEM) on ERK1/2 activity and MITF level in 21% and 6% O2 were determined by Western blotting with representative images shown (n = 3). β-actin was used as a loading control. (B) The percentage of MITF-positive cells in control cultures and after treatment with either 50 nM trametinib (TRA) or 10 µM vemurafenib (VEM) are shown as mean values ± SD (n = 3). Results for DMBC12 were not quantified due to almost undetectable MITF level in control and lack of changes in drug-treated cells. Differences are considered significant at * p < 0.05 ** p < 0.01 *** p < 0.001. See Figure S1 for representative dot plots. (C) The percentage of Ki-67-positive cells in control cultures and after treatment with 50 nM trametinib or 10 µM vemurafenib are shown as mean values of 3 biological replicates ± SD. Differences are considered significant at * p < 0.05 ** p < 0.01 *** p < 0.001. See Figure S1 for representative dot plots. (D) Representative density plots of dual-stained DMBC28 cells with anti-MITF and anti-Ki-67 antibodies after 48 h of drug treatment. Average percentages of cells positive for one or both markers are shown (n = 2).
Figure 6
Figure 6
Changes in the protein level of PGC1α during drug-induced apoptosis. Protein levels of PARP and PGC1α after 44 h of treatment with vemurafenib (VEM) and trametinib (TRA) at indicated concentrations in normoxia (6% O2) and hyperoxia (21% O2) were assessed by western blotting with representative images shown (n = 3). Upper and lower arrows indicate full-length and cleaved PARP (cPARP), respectively. β-actin was used as a loading control.
Figure 7
Figure 7
Effects of trametinib (TRA) and vemurafenib (VEM) on VEGF transcript level assessed at different oxygen concentrations. VEGF transcript levels were determined by qRT-PCR and normalized to the expression of a reference gene RPS17. (A) Transcript levels of VEGF were determined in cell cultures grown in hyperoxia by qRT-PCR and their expression is compared between cell lines with transcript levels in DMBC17 cells set as one. (B) Transcript level of VEGF in 6% O2 and 1% O2 is presented relative to its level in 21% O2. (C) Changes in VEGF transcript level after drug treatment is presented relative to its expression in control. Bars represent mean values of 3-4 independent experiments ± SD. Differences are considered significant at * p < 0.05, ** p < 0.01.
Figure 8
Figure 8
Effects of trametinib (TRA) and vemurafenib (VEM) on the expression of genes related to glutamine and glucose metabolism assessed at different oxygen concentrations. Drug-induced changes in transcript levels of glutamine (A) and glucose (B) metabolism-related genes after 24 h of treatment with either vemurafenib or trametinib. qRT-PCR data were normalized to the expression of a reference gene RPS17. Bars represent mean values of 3-4 biological replicates ± SD. Statistically significant differences are indicated: * p < 0.05, ** p < 0.01 or *** p < 0.001.

Similar articles

Cited by

References

    1. Smalley K.S., Lioni M., Noma K., Haass N.K., Herlyn M. In vitro three-dimensional tumor microenvironment models for anticancer drug discovery. Expert Opin. Drug Discov. 2008;3:1–10. doi: 10.1517/17460441.3.1.1. - DOI - PubMed
    1. Vörsmann H., Groeber F., Walles H., Busch S., Beissert S., Walczak H., Kulms D. Development of a human three-dimensional organotypic skin-melanoma spheroid model for in vitro drug testing. Cell Death Dis. 2013;4:e719. doi: 10.1038/cddis.2013.249. - DOI - PMC - PubMed
    1. Flach E.H., Rebecca V.W., Herlyn M., Smalley K.S., Anderson A.R. Fibroblasts contribute to melanoma tumour growth and drug resistance. Mol. Pharm. 2011;8:2039–2049. doi: 10.1021/mp200421k. - DOI - PMC - PubMed
    1. Somasundaram R., Zhang G., Fukunaga-Kalabis M., Perego M., Krepler C., Xu X., Wagner C., Hristova D., Zhang J., Tian T., et al. Tumor-associated B-cells induce tumor heterogeneity and therapy resistance. Nat. Commun. 2017;8:607. doi: 10.1038/s41467-017-00452-4. - DOI - PMC - PubMed
    1. Sztiller-Sikorska M., Hartman M.L., Talar B., Jakubowska J., Zalesna I., Czyz M. Phenotypic diversity of patient-derived melanoma populations in stem cell medium. Lab. Invest. 2015;95:672–683. doi: 10.1038/labinvest.2015.48. - DOI - PubMed

MeSH terms