. 2019 Sep 5;25(3):342-356.e7.
doi: 10.1016/j.stem.2019.07.008. Epub 2019 Aug 15.

Defining the Identity and Dynamics of Adult Gastric Isthmus Stem Cells

Affiliations

Defining the Identity and Dynamics of Adult Gastric Isthmus Stem Cells

Seungmin Han et al. Cell Stem Cell. .

Abstract

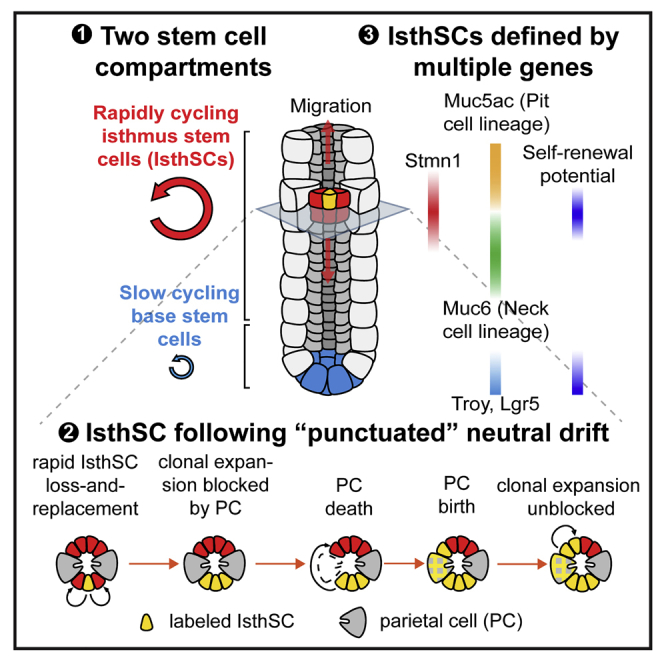
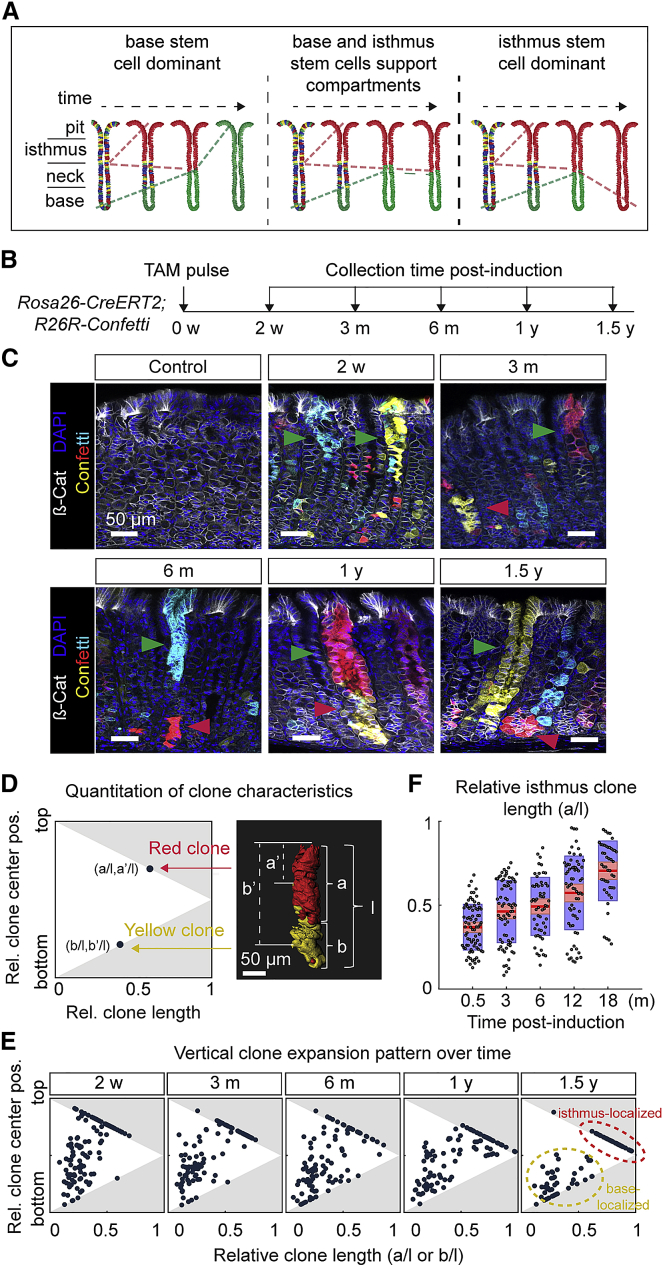
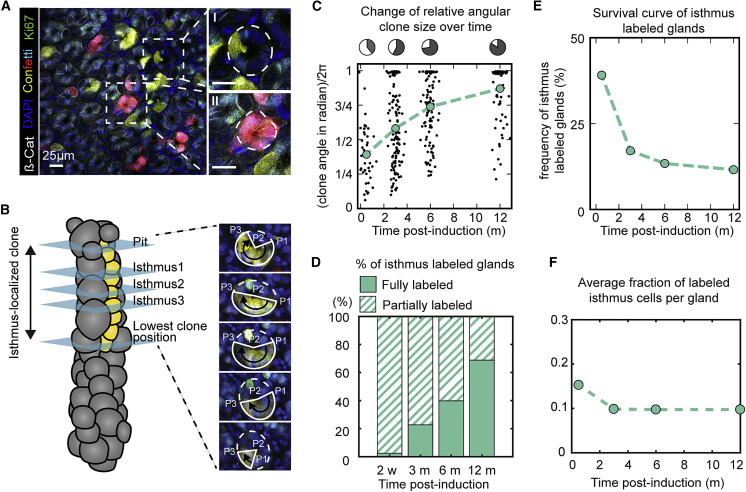
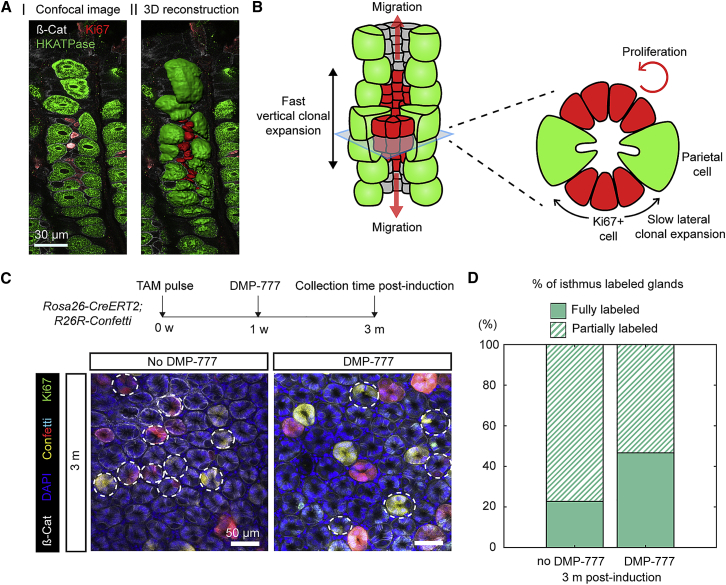
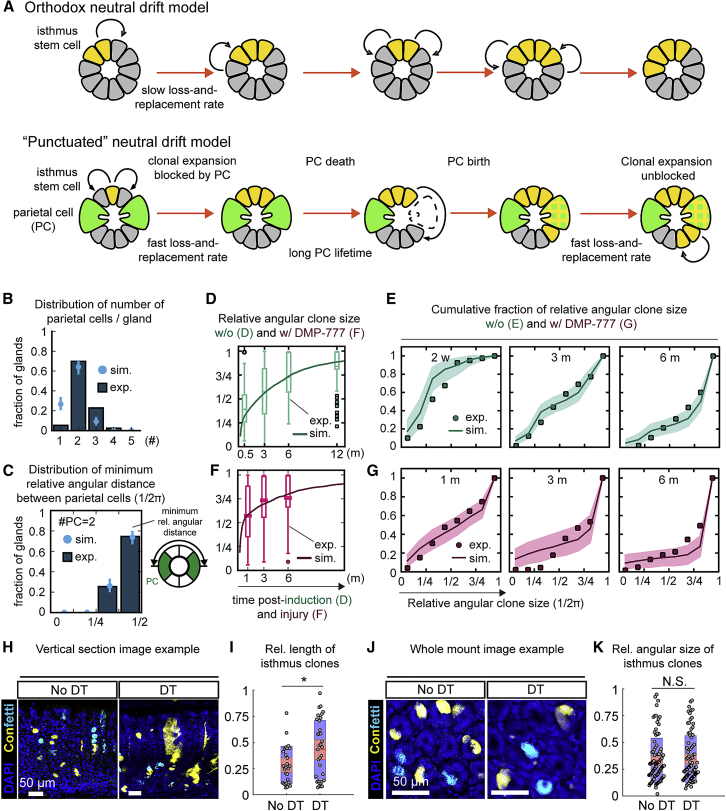
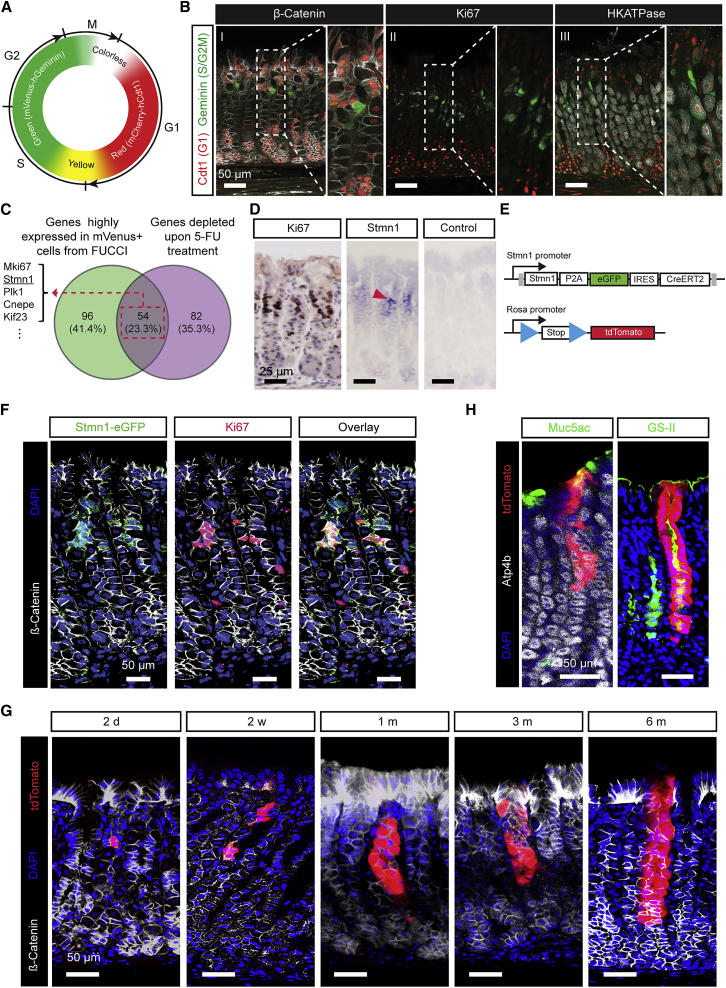
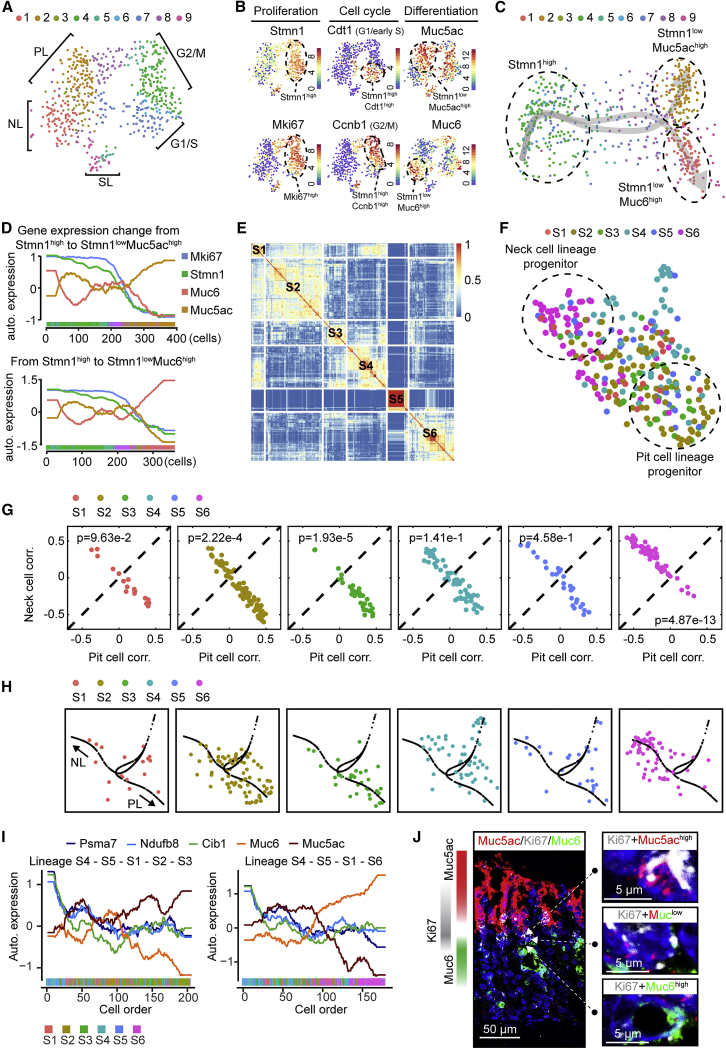
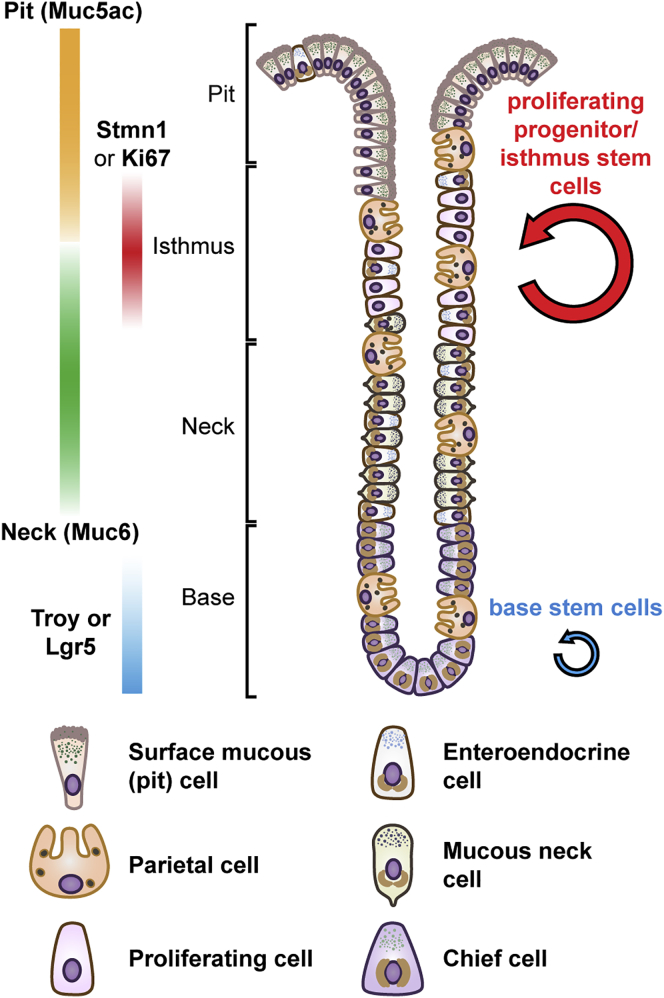
The gastric corpus epithelium is the thickest part of the gastrointestinal tract and is rapidly turned over. Several markers have been proposed for gastric corpus stem cells in both isthmus and base regions. However, the identity of isthmus stem cells (IsthSCs) and the interaction between distinct stem cell populations is still under debate. Here, based on unbiased genetic labeling and biophysical modeling, we show that corpus glands are compartmentalized into two independent zones, with slow-cycling stem cells maintaining the base and actively cycling stem cells maintaining the pit-isthmus-neck region through a process of "punctuated" neutral drift dynamics. Independent lineage tracing based on Stmn1 and Ki67 expression confirmed that rapidly cycling IsthSCs maintain the pit-isthmus-neck region. Finally, single-cell RNA sequencing (RNA-seq) analysis is used to define the molecular identity and lineage relationship of a single, cycling, IsthSC population. These observations define the identity and functional behavior of IsthSCs.

Keywords: Lgr5; Troy; biophysical modeling; deep tissue imaging; gastric corpus isthmus stem cell; intestine; punctuated neutral drift; single-cell RNA-seq; two stem cell compartments; unbiased genetic labeling.


Conflict of interest statement

The authors declare no competing interests.

Figures

None
Graphical abstract
Figure 1
Figure 1
Stomach Corpus Glands Are Maintained by Two Independent Stem Cell Populations (A) Schematic illustrating potential outcome of clonal expansion in stomach corpus glands based on the long-term contribution of isthmus and base stem cells. Left panel: slowly cycling base stem cells replace isthmus progenitors over time. Middle panel: isthmus and base stem cells maintain their respective compartments over time. Right panel: IsthSCs replace base stem cells over time. (B) Experimental schedule for tracing. (C) Representative images from 150-μm-thick z stack confocal images of stomach corpus of Rosa26-CreERT2;R26R-Confetti mice at 2 weeks, 3 months, 6 months, 1 year, and 1.5 years following TAM injection. Isthmus- and base-localized clones are indicated by green and red arrowheads, respectively. Yellow, EYFP; red, tdimer2; cyan, mCerulean; grey, β-catenin; blue, DAPI. Scale bars: 50 μm. (D) Schematic illustrating the quantification of clone characteristics based on the midpoint and length. Scale bar: 50 μm. (E) Scatterplot of relative (vertical) clone length and center position in Rosa26-CreERT2;R26R-Confetti mice. Clone characteristics illustrate a separation over time into larger clones (inside red dotted ellipse) located in the isthmus-pit region and smaller clones (inside yellow dotted ellipse) located in the base region of glands. N = 114 clones (2 weeks), 109 clones (3 months), 104 clones (6 months), 99 clones (1 year), and 82 clones (1.5 years) were pooled from 2 mice per time point. (F) Distribution of the relative length of labeled clones in the isthmus region to gland length over time based on Rosa26-CreERT2;R26R-Confetti tracing. Dots denote lengths of individual clones (N = 77 clones [2 weeks], 71 clones [3 months], 56 clones [6 months], 67 clones [1 year], and 48 clones [1.5 years]) pooled from 2 mice per time point. Red line, mean; red-shaded box, 95% confidence interval (CI); blue-shaded box, SD. See Figures S1 and S2.
Figure 2
Figure 2
The Isthmus-Pit Region of the Stomach Corpus Gland Is Maintained by Stochastic Loss and Replacement of IsthSCs (A) Representative whole-mount image of stomach corpus from Rosa26-CreERT2;R26R-Confetti mice at 3 months post-induction. Ki67 antibody staining of proliferative cells (green) identifies the isthmus zone. Magnified panels to the right show examples of partially (I) and fully (II) labeled glands. Green: Ki67. Scale bars: 25 μm. (B) Scoring strategy to quantify lateral clone expansion by measuring the relative angular size of clones around the gland circumference. Relative angular size was measured in pit, isthmus, and neck regions at 3 months post-induction. Left panel: schematic shows the contribution of a yellow isthmus clone. The 3 sections depict the top (isthmus 1), center (isthmus 2), and lowest (isthmus 3) position of the isthmus zone, as defined by Ki67 labeling. Right panel: in each optical section, the clone dimensions are defined by 3 points (P1, P2, P3, and connecting white lines), which determine the angular clone size. (C) The relative angular isthmus clone size. Black dots represent individual clones and green dots the average. N = 40 clones (2 weeks), 132 clones (3 months), 103 clones (6 months), and 90 clones (12 months) were pooled from 1–3 mice per time point. (D) Percentage of fully and partially labeled glands at indicated time points. (E) Clone survival curve for isthmus-labeled glands. Green dots denote the frequency calculated from the number of glands labeled in the isthmus region relative to the total number of glands for 1–3 mice at each time point. (F) Average fraction of labeled isthmus cells (green dots) obtained as the product of the average clone size (C) and frequency (E). The dotted lines linking green dots in (C), (E), and (F) show the trend over time. See Video S1 and Figure S3.
Figure 3
Figure 3
Parietal Cells Act as Physical Barriers against Lateral Clone Expansion (A) Representative confocal (63×) image of the pit-isthmus-neck region from 150-μm-thick section of mouse stomach corpus illustrating cellular organization (I). 3D reconstruction of the confocal z stack images was performed using IMARIS (Bitplane; II). Small, Ki67+ cells are tightly packed between columns of large HKATPase+ parietal cells, suggesting that the lateral expansion of Ki67+ cells may be inhibited. Red, Ki67; Green, HKATPase. (B) Schematic depicting potential role of parietal cells as barriers to lateral expansion in the isthmus region. From the gland architecture, progeny of Ki67+ proliferating cells may move vertically (parallel to the gland axis) through the “valley” formed between parietal cells, resulting in rapid vertical expansion (left diagram). By contrast, the lateral expansion of Ki67+ cell progeny is blocked by long-lived parietal cells (green) acting as physical barriers, resulting in slow lateral expansion (right diagram). (C) Experimental timeline and representative images of whole-mount tissue from Rosa26-CreERT2;R26R-Confetti mouse corpus with (right) and without (left) administration of DMP-777. The white dotted lines indicate partially labeled glands. The relative number of partially labeled glands was reduced in the DMP-777-treated sample. Red, tdimer2; green, Ki67. Scale bars: 50 μm. (D) The percentage of partially labeled glands in untreated (N = 132 glands) and DMP-777-treated (N = 45 glands) samples quantified at 3 months post-induction. The glands were pooled from 2 or 3 mice per condition. See Video S2 and Figure S3.
Figure 4
Figure 4
Parietal Cells Establish a Barrier Function Inhibiting the Lateral Expansion of Isthmus Clones (A) Schematic of two possible models: orthodox neutral drift model (top panel) and the “punctuated” neutral drift (PND) model (bottom panel). In the orthodox model, loss and replacement of neighboring stem cells leads to a slow drift of clones around the gland circumference. In the PND model, stem cell loss and replacement occurs rapidly in the region between parietal cells (PCs), leading to an expanded clone that persists in the region between the parietal cells. However, the loss and replacement of stem cells between neighboring regions is blocked by long-lived parietal cells. If the barrier is removed through the death of a parietal cell, clonal expansion can occur again, leading to a burst of expansion in the manner of a punctuated drift. (B) Distribution of PCs per gland section in the isthmus region. Sky blue dots and lines indicate means and SD, respectively, derived from model simulations, and dark blue bars indicate experimental data in (B) and (C). N = 175 glands. (C) Distribution of minimum relative angular distance between PCs for a value of 2 PCs per gland isthmus region. The minimum angular distance is the smallest angle between a pair of PCs. N = 122 glands. (D–G) Relative angular clone size for control (D) and DMP-777-treated (F) samples at indicated time points. Boxplots with medians in the centers represent experimental data for each condition. Solid lines represent the fit of simulated results using the PND model with and without incorporation of PCs as physical barriers, with the same model parameters but different initial conditions. Cumulative fraction of the relative angular clone size at indicated time points for control (E) and DMP-777-treated samples (G). Dots indicate the frequency as determined from experimental data. Lines indicate the fit of simulated results from the PND model with and without incorporation of PCs as physical barriers, with the same model parameters but different initial conditions. Shading displays the 95% CI around the fit of simulated data. The number of clones used for control is the same as in Figure 2. N = 99 clones (1 month), 45 clones (3 months), and 61 clones (6 months), pooled from 2 or 3 mice per time point in DMP-777-treated condition. (H and J) Representative images of vertical sections (H) and whole mounts (J) of mouse stomach corpus glands in the Mu6-DTR;Rosa26-CreERT2;R26R-Confetti line with or without DT at 1 month post-labeling. Cyan: mCerulean. Scale bars: 50 μm. (I and K) The relative length (I) and angular size (K) of the isthmus-anchored clones in the same samples as (H) and (J). Red line, mean; red-shaded box, 95% CI; blue-shaded box, SD. p < 0.05. N.S.: statistically not significant (p > 0.1). Two-sample Kolmogorov-Smirnov test. N = 27 clones (no DT) and 34 clones (DT), pooled from 2 mice per condition, were analyzed in (I), and N = 98 clones (no DT) and 88 clones (DT), pooled from 2 mice per condition in (K). Note that, in the vertical sections, the red clones were not counted to avoid confusion with the dsRed signal from the Muc6-IRES-DTR-T2A-dsRed allele. See Figures S3, S4, and S5; Table S1; and Methods S1.
Figure 5
Figure 5
Rapidly Cycling Isthmus Progenitors Can Maintain Long-Term Self-Renewal Potential (A) Schematic showing the fluorescence signal associated with each phase of the cell cycle in the Rosa26-Fucci2a mouse. (B) Representative confocal images of stomach corpus gland sections (150 μm) of Rosa26-Fucci2a mice. Red, hCdt1-mCherry(30/120-G1); green, hGem(1/110-S/G2/M); grey, β-catenin (I), Ki67 (II), HKATPase (III). Scale bars: 50 μm. (C) Venn diagram showing the overlap between genes more highly expressed in isolated proliferative isthmus cells and genes downregulated following 5-FU treatment, taken to be prospective candidate markers for proliferating isthmus cells. (D) Immunohistochemical staining for Ki67, counterstained with Mayer’s hematoxylin (leftmost panel). In situ hybridization with Stmn1 anti-sense (middle panel) and Stmn1 sense negative control (rightmost panel) probes in mouse stomach corpus sections are shown. Stmn1 mRNA was restricted to the isthmus region delineated by Ki67 staining. Scale bars: 25 μm. (E) Schematic of the genetic strategy to trace Stmn1+ cell-derived progeny in the corpus gland. (F) Representative confocal images of the stomach corpus of Stmn1-CreERT2 mice. Red, Ki67; green, EGFP. Scale bars: 50 μm. (G) Representative confocal images of 150-μm-thick sections of the stomach corpus of Stmn1-CreERT2;R26R-tdTomato mice at 2 days, 2 weeks, 1 month, 3 months, and 6 months post-injection of 0.5–1 mg tamoxifen/20 g mouse body weight. Labeling of clones in the isthmus region with tdTomato can be detected as early as 2 days post-injection. Red, tdTomato. Scale bars: 50 μm. (H) Representative confocal images of the mouse stomach corpus glands of Stmn1-CreERT2;R26R-tdTomato mice at 5 months post-labeling. Red, tdTomato for labeled cells; grey, Atp4b for parietal cells; green, Muc5ac for pit cells and GS-II for neck cells. Scale bars: 50 μm. See Figure S6 and Tables S2 and S3.
Figure 6
Figure 6
scRNA-Seq Analysis Defines the Molecular Signature and Lineage Relationships of Actively Cycling IsthSCs (A) t-SNE map showing the result of the consensus clustering (Kiselev et al., 2017) applied to scRNA-seq data from Stmn1+ cells. Based on marker gene expression, 9 clusters were classified into 5 states or lineages: G1/S phase; G2/M phase; pit cell lineage (PL); neck cell lineage (NL); and secretory cell lineage (SL). (B) t-SNE maps of Stmn1+ cells showing expression of representative genes for cell proliferation (Stmn1 and Mki67), cell cycle (Cdt1 and Ccnb1), and differentiation (Muc5ac and Muc6). The color bar indicates log2-transformed normalized read counts. (C) Pseudotime trajectory of Stmn1+ cells inferred by Slingshot (Street et al., 2018). This algorithm suggests that Stmn1high cells differentiate toward two sublineages, pit (Stmn1low Muc5achigh) and neck (Stmn1low Muc6high) cells. (D) Expression of marker genes along the pseudotime trajectory in (C). Proliferation marker (Mki67 and Stmn1) expression decreases along the trajectory from Stmn1high subpopulations toward Stmn1low Muc5achigh and Stmn1low Muc6high subpopulations. Muc5ac expression increases and Muc6 expression decreases along the path toward pit cell identity (top panel) and vice versa toward neck cell identity (bottom panel), reflecting bipotential differentiation of progeny derived from IsthSCs. Gene expression is represented as auto-scaled, log2-transformed normalized read counts. (E) Consensus matrix from SC3 clustering that justifies the identification of 6 subclusters (S1–S6) from the Stmn1high cluster (top left in B). Similarity 0 (blue) in the color bar means that the two cells are always assigned to distinct clusters, whereas similarity 1 (red) means that the two cells are always assigned to the same cluster. (F) UMAP map showing the 6 subclusters (S1–S6) of the Stmn1high cluster. Based on marker gene expression, S2 and S3 are primed toward the PL, whereas S6 are primed toward the NL. (G) Scatterplots of the correlation with the representative pit cell (pit cell correlation) and neck cell (neck cell correlation) for the 6 subclusters S1–S6. The p values (p) from the binomial test indicate the statistical significance of the bias of the correlations of a cluster between pit cell and neck cell lineages. N = 18 cells (S1), 82 cells (S2), 32 cells (S3), 56 cells (S4), 29 cells (S5), and 65 cells (S6) were used for the binomial test. (H) The subclusters S1–S6 in the pseudotime trajectory inferred by Slingshot where undifferentiated IsthSCs are primed toward early sublineage-restricted progenitors. (I) Gene expression trajectories along the pseudotime trajectory for two lineages. The lineages S4-S5-S1-S2-S3 and S4-S5-S1-S6 are pit cell and neck cell lineages, respectively. The represented expression values are log2-transformed normalized read counts followed by the z transform. The subcluster ID of cells is denoted by colors along the pseudotime orders in the bar on the x axis. Muc5ac and Muc6 show opposite behaviors in the two lineages. The expression of Cib1, Ndufb8, and Psma7 is highest at the start of pseudotime and decreases along the trajectory leading to early sublineage restriction. (J) Examples of undifferentiated IsthSCs and early sublineage-restricted progenitors in the isthmus region of the mouse stomach corpus glands based on mRNA expression detected by RNAscope. Red, Muc5ac; green, Muc6; grey, Ki67. “Ki67+Muc5achigh,” “Ki67+Muclow,” and “Ki67+Muc6high” indicate (1) Ki67+ cells expressing Muc5ac at high levels (PL progenitor); (2) Ki67+ cells expressing both Muc5ac and Muc6 at low levels, but not zero (IsthSC); and (3) Ki67+ cells expressing Muc6 at high levels (NL progenitor). See Figure S7 and Table S4.
Figure 7
Figure 7
The Gastric Corpus Is Maintained by Two Stem Cell Populations Schematic of the mouse gastric corpus gland. The gastric corpus is compartmentalized into base and isthmus regions maintained by two discrete stem cell populations. IsthSCs are multipotent and actively cycling, maintaining the pit-isthmus-neck regions through a process of stochastic self-renewal. IsthSCs reside in a narrow zone between the pit and neck regions and are characterized by co-expression at low levels of the differentiation markers Muc5ac and Muc6, as well as high expression of the cell cycle markers Stmn1 and Ki67. As IsthSCs become displaced upward or downward from the stem cell zone, they become sublineage restricted, upregulating expression of Muc5ac or Muc6, before terminal differentiation into the respective cell types. The gland base is maintained by Troy+ or Lgr5+ (chief) stem cells, which are mostly quiescent during homeostasis and persist long-term. See Figure S7.

Similar articles

Cited by

References

    1. Anders S., Huber W. Differential expression analysis for sequence count data. Genome Biol. 2010;11:R106. - PMC - PubMed
    1. Anders S., Pyl P.T., Huber W. HTSeq--a Python framework to work with high-throughput sequencing data. Bioinformatics. 2015;31:166–169. - PMC - PubMed
    1. Arnold K., Sarkar A., Yram M.A., Polo J.M., Bronson R., Sengupta S., Seandel M., Geijsen N., Hochedlinger K. Sox2(+) adult stem and progenitor cells are important for tissue regeneration and survival of mice. Cell Stem Cell. 2011;9:317–329. - PMC - PubMed
    1. Bartfeld S., Koo B.K. Adult gastric stem cells and their niches. Wiley Interdisc. Rev. Dev. Biol. 2017;6:e261. - PubMed
    1. Basak O., Krieger T.G., Muraro M.J., Wiebrands K., Stange D.E., Frias-Aldeguer J., Rivron N.C., van de Wetering M., van Es J.H., van Oudenaarden A. Troy+ brain stem cells cycle through quiescence and regulate their number by sensing niche occupancy. Proc. Natl. Acad. Sci. USA. 2018;115:E610–E619. - PMC - PubMed

Publication types

LinkOut - more resources