. 2019 Sep;573(7772):130-134.
doi: 10.1038/s41586-019-1484-9. Epub 2019 Aug 15.

Niche stiffness underlies the ageing of central nervous system progenitor cells

Affiliations

Niche stiffness underlies the ageing of central nervous system progenitor cells

Michael Segel et al. Nature. 2019 Sep.

Erratum in

Abstract

Ageing causes a decline in tissue regeneration owing to a loss of function of adult stem cell and progenitor cell populations1. One example is the deterioration of the regenerative capacity of the widespread and abundant population of central nervous system (CNS) multipotent stem cells known as oligodendrocyte progenitor cells (OPCs)2. A relatively overlooked potential source of this loss of function is the stem cell 'niche'-a set of cell-extrinsic cues that include chemical and mechanical signals3,4. Here we show that the OPC microenvironment stiffens with age, and that this mechanical change is sufficient to cause age-related loss of function of OPCs. Using biological and synthetic scaffolds to mimic the stiffness of young brains, we find that isolated aged OPCs cultured on these scaffolds are molecularly and functionally rejuvenated. When we disrupt mechanical signalling, the proliferation and differentiation rates of OPCs are increased. We identify the mechanoresponsive ion channel PIEZO1 as a key mediator of OPC mechanical signalling. Inhibiting PIEZO1 overrides mechanical signals in vivo and allows OPCs to maintain activity in the ageing CNS. We also show that PIEZO1 is important in regulating cell number during CNS development. Thus we show that tissue stiffness is a crucial regulator of ageing in OPCs, and provide insights into how the function of adult stem and progenitor cells changes with age. Our findings could be important not only for the development of regenerative therapies, but also for understanding the ageing process itself.


Conflict of interest statement

Competing interests The authors declare no competing interests.

Figures

Extended data Fig. 1
Extended data Fig. 1. Dynamics of OPC activation, in vitro and in vivo.
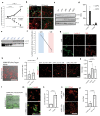
a, Representative flow cytometry analysis on MACs purified OPCs confirm that we are able to isolate a pure population of Olig2+/Ng2+ OPCs from both neonate and aged brains. b, EdU labelling of OPCs after 1 and 2 weeks in vitro. Scale bar represents 25μM. c, Quantifications of N=3 replicates of neonatal and aOPCs in proliferation conditions on PDL coated tissue culture plastic after 5 days, showing that aOPCs proliferate poorly even in the presence of growth factors. d, Representative image of 16-month old female white matter and gray matter with triple labelling of Olig2, EdU, and CC1, showing that aOPCs also proliferate poorly in vivo. Scale bar represents 50μM. e, Schematic overview of the decellularization protocol. f, A DAPI staining following the decellularization protocol shows no remaining nuclear DNA, indicating complete cell removal. Scale bar represents 200μM. g, Rat brains of different ages were decellularized, fixed, and stained for chondroitin sulfate proteoglycans (CSPGs), showing that ECM remains intact following the decellularization protocol. Scale bar represents 20μM. h, A schematic of the re-cellularization protocol. OPCs are MACs-purified using the OPC surface marker A2B5, cultured for 5 days in proliferation conditions. A subset of these brain ECM cultures are fixed with PFA and the remaining brain ECM cultures are placed into differentiation conditions for 5 days. i-j, Representative images and a quantification of nOPCs seeded on neonatal and aged matrix, showing that nOPCs on aged ECM proliferate poorly. a, d, f, and g portray representative quantifications/images from ≥N=3 biological replicates. Averages represent the mean of biological replicates, error bars represent standard deviation, and p-value is calculated by one-way ANOVA.
Extended data Fig. 2
Extended data Fig. 2. OPCs grown in progressively stiff environments lose their proliferation and differentiation capacity.
a, Mean shear moduli determined by AFM of our fabricated ‘soft’ and ‘stiff’ hydrogels. b-c, MACs purified nOPCs cultured on stiff hydrogels lose their ability to proliferate following 5 days in proliferation conditions. nOPCs cultured on soft hydrogels, however, continue to proliferate. Scale bar represents 40μm. d-e, Similarly, nOPCs cultured on stiff hydrogels differentiate into oligodendrocytes very inefficiently following 5 days in differentiation conditions. Conversely, nOPCs differentiated on soft hydrogels efficiently differentiate into oligodendrocytes. Scale bar represents 100μm. f-g, Representative images and quantifications of N=3 replicates of EdU labelled OPCs seeded at 0.5x, 1x, and 2x cell seeding densities on increasingly stiff hydrogels after 120 hours in culture show cell-density independent, stiffness-dependent OPC activation. Scale bar represents 100μM. h-i, Labelling and quantifications of N=3 assays of OPC viability of both neonatal and aged progenitor cells on soft and stiff hydrogels after 48 hours in culture with propidium iodide (PI), showing that the stiffness effect is not dependent on proliferation. Averages represent the mean of biological replicates, error bars represent standard deviation, and p-value is calculated by one-way ANOVA.
Extended data Fig. 3
Extended data Fig. 3. Gene expression profiling show stiffness-driven changes in OPCs.
a-c, GSEA analysis reveal a number of aging-related pathways differentially regulated between aged and neonatal freshly harvested OPCs and between cultured OPCs grown on soft hydrogels versus those grown on stiff hydrogels. d, Volcano plot of differential expressed genes between aOPCs cultured on soft versus stiff hydrogels. Red dots show the 1300 significantly upregulated expressed genes as determined from N=3 biological replicates per condition (p < .05). e, Heatmaps showing the log2 FPKM expression of the 25 genes with highest fold increase in expression between N=3 biological replicates of aOPCs cultured on soft versus stiff hydrogels and of the 25 genes with highest fold increase in expression between aOPCs cultured on soft versus stiff hydrogels. ECM related genes such as Dab1, Acan, and Plxnd1 were upregulated in aOPCs cultured on stiff hydrogels while cell-cycle and DNA repair genes such as Cdk1na and Sirt7, OPC activation genes such as Etv1, and hippo pathway genes such as Rassf2 were amongst the most upregulated genes in aOPCs cultured on soft hydrogels. All genes shown are significantly differentially expressed with a p-value of ≤ 0.05. f, Venn diagram shows that similar gene sets to those enriched in neonates are also enriched in nOPCs grown on soft hydrogels. g, Specific genes involved in genomic and epigenomic stability and in the activation of OPCs are upregulated both in nOPCs and in aOPCs grown on soft hydrogels.
Extended data Fig. 4
Extended data Fig. 4. Small molecules modulating cell cytoskeleton promote proliferation of aOPCs.
a, Using the 96 well plate format, the GE Incell, and cell profiler for quantification, we optimized the dosing and timing for the small molecules Y27632 and blebbistatin. Averages represent mean proportion of Edu+/Olig2+ cells in N=3 technical replicates for N = 3 biological replicates. b-c, Representative images and quantifications from N=3 biological replicates of the rates of proliferation of nOPCs cultured on soft and stiff hydrogels in the presence of 5μm Blebbistatin, showing that treatment with blebbistatin promotes proliferation in OPCs similarly to soft hydrogels. Scale bar represents 50μm. d-e, Representative images and quantifications of N=3 adult OPCs on soft hydrogels treated with blebbistatin or DMSO show no change in rates of proliferation, indicating that there is no stiffness-independent effect of blebbistatin. Scale bar represents 50μM. f, Box and whisker plots of AFM data from N=3 aged vibratomed cortex treated with DMSO or 5μM blebbistatin, indicating that the cortex softens significantly with treatment of blebbistatin. P-value was calculated using a two-way Mann-Whitney test for two independent samples. g-h, Representative images and quantifications of EdU labelled Olig2+CC1- OPCs 7 days following the injection of 5μM blebbistatin into the grey matter of N=3 14 month-old females.i-k, Schematic and quantifications of the differentiation rates of aOPCs following the injection of 5μM of blebbistatin at 14 days post lesion in in vivo-toxin-induced lesions. The data represents N=3 15 month-old age male rats. Differentiated oligodendrocytes are quantified as the proportion of CC1+ Olig2+ co-positive cells per mm2 of lesioned area. Scale bars represent 50μM. Averages represent the mean of biological replicates, error bars represent standard deviation, and, unless otherwise stated, p-value is calculated by one-way ANOVA.
Extended data Fig. 5
Extended data Fig. 5. The nuclear lamina composition of OPCs changes both with aging and in response to niche stiffness.
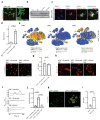
a, qPCR on OPCs reveal a loss of Lmnb1 and gain of Lmna with aging. Values represent averages of OPCs from N=3 animals for each time point and are the Log2 ΔΔCT values normalized to Tbp. b, Representative images of in vivo cerebellar grey matter cryo-sections from N=3 biological replicates confirm nuclear lamina changes that occur with aging. Scale bar represents 50μm. White arrows highlight c, Representative Western blot of Lamin B1 and Lamin C from freshly isolated OPCs of different ages confirms qPCR data. Similar results were obtained for N=3 biological replicates for each age group. d, RNA-sequencing data of nuclear Lmnb2 in neonatal and aged OPCs show low levels of expression in both age groups. e-f, Western blot quantifications of aged OPCs grown on soft and stiff hydrogels. g, Representative images from N=3 biological replicates of nuclear lamina changes in OPCs on different stiffness hydrogels. Scale bar represents 50μM. h, Representative image from N=3 biological replicates of RFP-conjugated non-targeting siRNA shows high efficiency siRNA transfection. Scale bar represents 100μM. i, qPCR on adult OPCs 48 hours following transfection with siRNAs showing efficient knockdown of Lmna and Fak1. Values represent averages of OPCs from N=3 animals and are the Log2 ΔΔCT values normalized to Tbp. j-k, Representative images and quantifications of the proliferation of N=3 aOPCs in growth factors on stiff hydrogels following transfection with siRNAs for Lmna and Fak1. Scale bars represent 50μM. l, Representative image from N=3 biological replicates of GFP encoding mRNA in neonatal OPCs shows high efficiency transfection. Scale bar represents 100μM. m, Representative image from N=3 biological replicates showing efficient transfection, high translation, and proper protein localization of Lamin C in aOPCS. Scale bar represents 25μM. n, qPCR data 5 days post-transfection from RNA isolated from transfected OPCs. Means represent log2 ΔΔCT means across from N=2 biological replicates. o-p, Representative images and quantifications of N=3 replicates in nOPCs on soft hydrogels show loss of proliferative capacity 120 hours following Lmnc mRNA overexpression. Scale bar represents 100μM.
Extended data Fig. 6
Extended data Fig. 6. Piezo1, which mediates calcium flux, is highly expressed in OPCs but not other cells of oligodendrocyte lineage.
a, Representative images of aOPCs on soft and stiff hydrogels showing that Piezo1 is expressed in rat OPCs in vitro. Scale bar represents 100μm. b, Western blot for Piezo1 in acutely isolated OPCs show modest increase in protein expression from neonates to adults. c-d, Representative images and quantifications of in situ hybridizations in aged mouse cortex for Piezo1 and Pdgfra using RNA-scope, showing expression of Piezo1 in aged mouse OPCs. Negative control is included. Scale bar represents 10μm. e, t-SNE plots from human single cell-sequencing study (Jäkel et al., 2019) show that Pdgfra/Olig2 co-expressing OPCs of the adult CNS also highly express Piezo1 in adult white matter. f-g, Representative images and quantifications of aOPCs transfected with a control siRNA or with a Piezo1 siRNA and placed in proliferation conditions for 5 days, indicating no stiffness-independent effect of Piezo1. Scale bar represents 100μm. h, Representative Rhod-2 AM-stained live cell images from N=3 biological replicates of aOPCs on soft and stiff hydrogels transfected with siScramble or siPiezo1. i, Representative traces from N=3 biological replicates of individual cells fluxing with calcium (ΔF) over 270 seconds. Fluorescence was normalized to the maximum fluorescence intensity per cell over the acquisition time. j, Quantifications of the proportion of cells that fluxed calcium ≥1 time throughout the 540 second image acquisition period, showing that either seeding OPCs on soft hydrogels or overexpressing Piezo1 inhibits the calcium flux. k-l, Representative images and proliferation quantifications from N=3 biological replicates of aOPCs cultured in proliferation conditions for 5 days on a stiff hydrogel in the presence of 5μM BAPTA, showing a boost in proliferation with calcium chelation. Scale bar represents 100μm. Averages represent the mean of biological replicates, error bars represent standard deviation, and p-value is calculated by one-way ANOVA.
Extended data Fig. 7
Extended data Fig. 7. In vivo Piezo1 knockdown strategies.
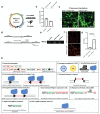
a, Schematic for Cas9-mediated genomic manipulation using in vitro transcribed (IVT) gRNA, Cas9 mRNA, and in-house-made minicircle vectors overexpressing Piezo1-targeting shRNAs. This Cas9-mediated knock-in of shRNA-GFP has the benefit of having a characterizable monotonic knock-down across the pool of cells expressing the GFP. b, qPCR data 48 hours post-transfection of adult OPCs with Piezo1 siRNA and Piezo1 shRNA construct from RNA isolated from transfected OPCs show 80% transcript knockdown of Piezo1 mRNA. Means represent log2 ΔΔCT means from N=3 biological replicates. c, Representative images from N=3 biological replicates show high rates of co-transfection of minicircle with Cas9 mRNA and IVT gRNA. Scale bar represents 25μM. d-e, PCR design and appropriate fragment length of correctly knocked-in Minicircle fragment construct, representative of results from N=3 replicates. f-g, Representative images and quantifications show Cas9 knock-in of shPiezo1 fragments in aOPCs on stiff hydrogels phenocopies the effect of the siRNA Piezo1 in aOPCs. Scale bars represent 100μM. Averages represent the mean of biological replicates, error bars represent standard deviation, and p-value is calculated by one-way ANOVA. h, In order to knock down Piezo1 in endogenous OPCs in the aged mouse, we developed a strategy outlined in the schematic. A non-homologous end-joining mediated knock-in of a construct is inserted into a gene specific to a given cell type. This construct contains a ribozyme flanked second gRNA, targeting Cas9-mediated gene knockdown to a second locus. HH is an abbreviation for Hammerhead ribozyme, HDV for hepatitis delta virus ribozyme, PA for poly-adenylation sequence, and ITR for an internal terminal repeat sequence. Square and triangle represent gRNA target sequence.
Extended data Fig. 8
Extended data Fig. 8. Nested CRISPR system efficiently labels OPCs with GFP and subsequently mutates Piezo1 locus.
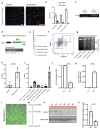
a-b, Representative images and quantifications of GFP and Olig2 co-expressing cells across multiple regions of the CNS. <5% of GFP expressing cells expressing a marker other than Olig2 Data taken from N=3 control knock-down animals. Scale bars represent 50μm. c, RT-PCR shows Cas9 and GFP mRNA expression from whole brain homogenate in N=3 animals. d, A schematic and a DNA gel of N=2 biological replicates of the Pdgfra locus following CRISPR/Cas9-mediated knock-in confirms construct knock-in in the correct position. P1 signifies forward primer while P2 represents the reverse primer used for the PCR. e, Outline of experimental strategy to confirm efficacy of in vivo nested CRISPR approach. In brief, 5 x 10¹¹ of each viral vector was tail vein-injected into 18 month old animals. At 5 weeks, brains were dissociated, and cells were sorted by flow cytometry based on their expression of Pdgfra and Olig2. f, Representative FACs plot from N=3 biological replicates shows gating of sorted Pdgfra+/Olig2+ OPC population from whole mouse brain. g-h, Representative agarose gel of surveyor assay using T7 endonuclease I assay and quantifications from N=4 18 month old animals show ~35% INDEL rate specific to FACs sorted oligodendrocyte-lineage cells. i, Quantification of the off-target INDELs from N=3 FACs sorted OPCs from brains 3 weeks following AAV infection. N.D. signifies ‘non-detected’. j-k qPCR results showing ΔΔCT from N=3 biological replicates of Pdgfra/Olig2 sorted cells from the in vivo infected aged CNS shows a 75% reduction of Piezo1 INDEL-spanning mRNA and high expression of Piezo1 gRNA. l, Representative image from n=3 biological replicates of GFP plasmid electroporation in mouse embryonic fibroblasts (MEFs) demonstrating high efficiency of transfection. Scale bar represents 50μm. m-o, Schematic Western Blot, and quantifications of Piezo1 protein levels in MEFs 5 days following electroporation of both the Pdgfra-knock-in Piezo1 gRNA construct. Quantifications represent average from N=3 replicate transfections for each of the 4 in vivo CRISPR constructs. N.T. demarcates the control constructs containing a non-targeting gRNA. Averages represent the mean of biological replicates, error bars represent standard deviation, and p-value is calculated by one-way ANOVA.
Extended data Fig. 9
Extended data Fig. 9. In vivo knock-down of Piezo1 in an aged lesion enhances OPC regeneration.
a-b, Representative images and box whisker plot quantification of white matter lesion stained only for Olig2 show increased OPC infiltration into the lesion site following Piezo1 knock-down. Lesion site indicated by white line. c-d, Fluoromyelin staining and quantifications of ratio of lesion area with positive fluoromyelin staining from N=3 biological replicates show increased myelin deposition in Piezo1 knock-down animals. e, In order to show the role of Piezo1 in development, we generated an additional in vivo CRISPR system. The diagram depicts GFP and a ribozyme flanked Piezo1 gRNA under the OPC specific Cspg4 promoter. HH is an abbreviation for Hammerhead ribozyme, HDV for hepatitis delta virus ribozyme, PA for poly-adenylation sequence, and ITR for an internal terminal repeat sequence. Square and triangle represent gRNA target sequence. Throughout figure, scale bars represent 100μm. Averages represent the mean of biological replicates, error bars represent standard deviation, and p-value is calculated by one-way ANOVA.
Extended data 10
Extended data 10. A cell-type specific CRISPR knockout of Piezo1 in OPCs in development increases both OPC proliferation and total cell number.
a, Outline of experimental strategy to confirm efficacy of in vivo CRISPR approach. In brief, 5 x 10¹⁰ of each viral vector was tail vein-injected into p1 pups. At 5 weeks, brains were dissociated, and cells were sorted by flow cytometry based on their expression of Pdgfra and Olig2. b, Representative FACs plot shows gating of sorted Pdgfra+/Olig2+ OPC population from whole mouse brain. c-d, Agarose gel of surveyor assay using T7 endonuclease I assay and quantifications from N=3 p35 neonatal pups show ~30% INDEL rate specific to oligodendrocyte-lineage cells. e, Representative images from N=3 biological replicates showing transgene specificity for Olig2 expressing OPCs. f, qPCR results showing ΔΔCT from N=3 biological replicates of Pdgfra/Olig2 sorted cells from the in vivo infected neonatal CNS shows a ~55% reduction of Piezo1 INDEL-spanning mRNA. Representative lower power images of EdU labelling of corpus callosum of Pdgfra/Olig2 expressing cells. Scale bar represents 100μm. g, Quantifications of Piezo1 protein levels in MEFs 5 days following electroporation of the Piezo1-gRNA construct under control of the Cspg4 promoter sequence. Quantifications are from N=3 biological replicates. h-j, Representative images and quantifications from N=3 animals of total density of oligodendrocyte lineage cells, as labelled by Olig2/Pdgfra or Olig2/CC1 co-expression in p35 mouse corpus callosum. Scale bars represent 100μm. Averages represent the mean of biological replicates, error bars represent standard deviation, and p-value is calculated by one-way ANOVA.
Figure 1
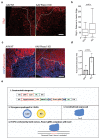
Figure 1. The CNS niche stiffens with aging and the neonate niche restores the function of aOPCs.
a-b, Representative images and quantifications of the proliferation and differentiation rates of transplanted nOPCs and aOPCs in N=3 neonate prefrontal cortex 14 days following transplantation. Blue arrows highlight example positive cells. c-d, Representative images and quantifications of the proliferation and differentiation rates of aOPCs seeded onto both nECM and aECM. e-f, Representative images of proliferating and differentiating cells per mm2 of CCP lesion cores 14 days post lesion and 7 days post direct injection of penicillinase/chABC into N=4 aged females. g-h, Global stiffness K (Pa) of brains at different ages determined by AFM indentation measurements. Means of 3 sections from 3 animals each are shown. Regional mean stiffness values calculated by mapping AFM measurements to brain slice. Averages represent the mean of biological replicates, error bars represent standard deviation, and p-value is calculated by one-way ANOVA. Throughout figure, scale bars represent 50μM.
Figure 2
Figure 2. A soft environment mimicking the stiffness of neonatal CNS tissue alone can restore the function of aOPCs.
a-b, Schematic represents OPCs cultured on stiffness-tuned hydrogels, along with representative images and quantifications of the proliferation and differentiation rates of aOPCs seeded on the substrates. Scale bar represents 40μm. c, Principal component analysis (PCA) for RNA sequencing differential gene expression analysis. The PCA was performed on the FPKM values for N=3 each of the six biological conditions, which are indicated in sidebar of panel. d, Analysis for genes involved in OPC and stem cell activation, proteostasis, and genetic and epigenetic stability as shown by mean FKPM of individual genes. e-f, Representative images and quantifications of N=3 biological replicates of the effects of blebbistatin on the proliferation and differentiation rates of aOPCs in vitro. Scale bar represents 50μm. Averages represent the mean of biological replicates, error bars represent standard deviation, and p-value is calculated by one-way ANOVA.
Figure 3
Figure 3. Piezo1 mitigates response of OPC activity to the stiffening CNS niche.
a, FPKM values of Piezo1 from neonatal and aged acutely isolated OPCs. b-c, Representative images and quantifications of the proportion of Piezo1 expressing OPCs (Olig2+CC1-) and oligodendrocytes (Olig2+CC1+) in the CNS grey matter in the rat of N=3 P7, N=3 3 month-olds, and N=3 14-month old animals. Scale bar represents 25μm. White arrows highlight example of Piezo1 expressing OPC. d-e, Representative images and quantifications of N=3 biological replicates of the proliferation and differentiation rates of aOPCs cultured on stiff hydrogels transfected with siScramble or siPiezo1. Scale bar represents 25μm. f-g, nOPCs were transfected with Cas9-mediated knock-in shRNA construct 24 hours following MACs sorting. Representative images and quantifications of GFP-expressing, EdU labelled cells in the grey matter of N=4 female rats. Arrows represent example quantified cells. Scale bar represents 50μM. Averages represent the mean of biological replicates, error bars represent standard deviation, and p-value is calculated by one-way ANOVA.
Figure 4
Figure 4. Piezo1 regulates OPC activity in an aged CNS lesion and in the developing CNS.
a, Schematic of a CRISPR system designed to both knock down Piezo1 and label the modified OPCs in a wild-type 18 month-old aged animal. A non-homologous end-joining mediated knock-in of a construct is inserted into a gene specific to a given cell type. This construct contains a ribozyme flanked second gRNA, targeting Cas9-mediated gene knockdown to a second locus. Animals were infected with both AAVs, lesioned 14 days later, and perfusion fixed 14 days after the lesion. b-c, Representative images and quantifications of EdU incorporation into Olig2/GFP expressing cells in the lesion core of N=3 mice. Representative images and quantifications of the number of CC1+/Olig2+ per mm2 of lesion area in N=3 control (non-targeting, NT) or Piezo1 knockdown animals. d, A schematic outlining the CRISPR-based method for knocking down Piezo1 activity in vivo. Both a Cas9 and a Piezo1-targetting gRNA under the Cspg4 promoter were packaged separately into the PHP-EB AAV. HH is an abbreviation for Hammerhead ribozyme, HDV for hepatitis delta virus ribozyme. e-f, Representative images of the corpus callosum and quantifications of N=3 biological replicates of mice 35 days after being infected at birth with both the Cas9 and OPC-specific Piezo1 or NT gRNA construct. Throughout figure, scale bars represent 100μm. Averages represent the mean of biological replicates, error bars represent standard deviation, and p-value is calculated by one-way ANOVA.

Similar articles

Cited by

References

    1. Goodell MA, Rando TA. Stem cells and healthy aging. Science. 2015;350:1199–1204. - PubMed
    1. Sim FJ, Zhao C, Penderis J, Franklin RJM. The age-related decrease in CNS remyelination efficiency is attributable to an impairment of both oligodendrocyte progenitor recruitment and differentiation. J Neurosci. 2002;22:2451–2459. - PMC - PubMed
    1. Gopinath SD, Rando TA. Stem Cell Review Series: Aging of the skeletal muscle stem cell niche. Aging Cell. 2008;7:590–598. - PubMed
    1. Swift J, et al. Nuclear Lamin-A Scales with Tissue Stiffness and Enhances Matrix-Directed Differentiation. Science. 2013;341:1240104–1240104. - PMC - PubMed
    1. Hinks GL, Franklin RJ. Delayed changes in growth factor gene expression during slow remyelination in the CNS of aged rats. Mol Cell Neurosci. 2000;16:542–556. - PubMed