. 2019 Aug 12;10(1):3637.
doi: 10.1038/s41467-019-10968-6.

CAF hierarchy driven by pancreatic cancer cell p53-status creates a pro-metastatic and chemoresistant environment via perlecan

Collaborators, Affiliations

CAF hierarchy driven by pancreatic cancer cell p53-status creates a pro-metastatic and chemoresistant environment via perlecan

Claire Vennin et al. Nat Commun. .

Abstract

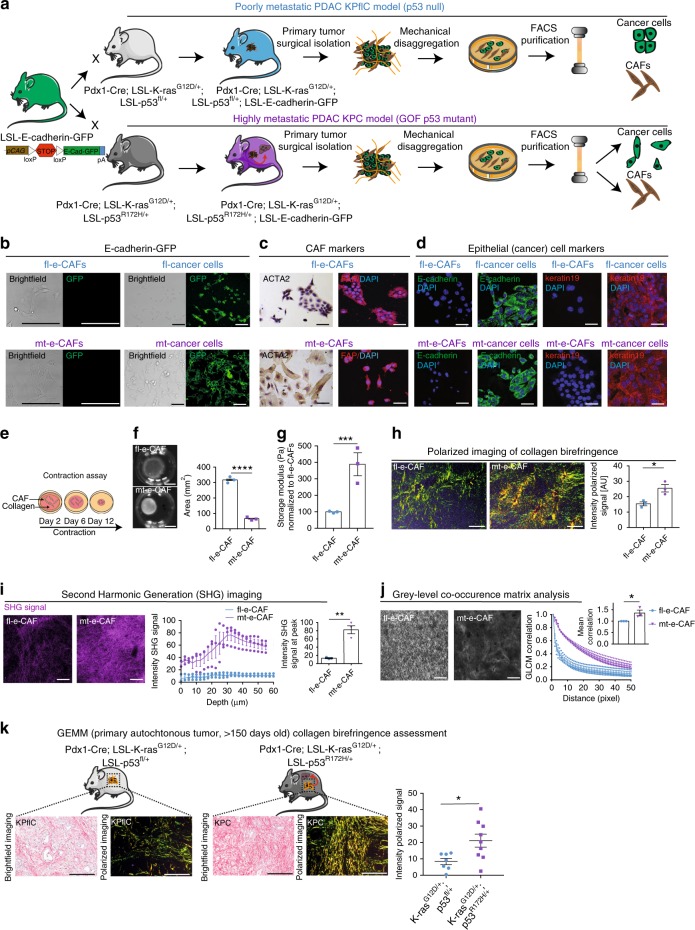
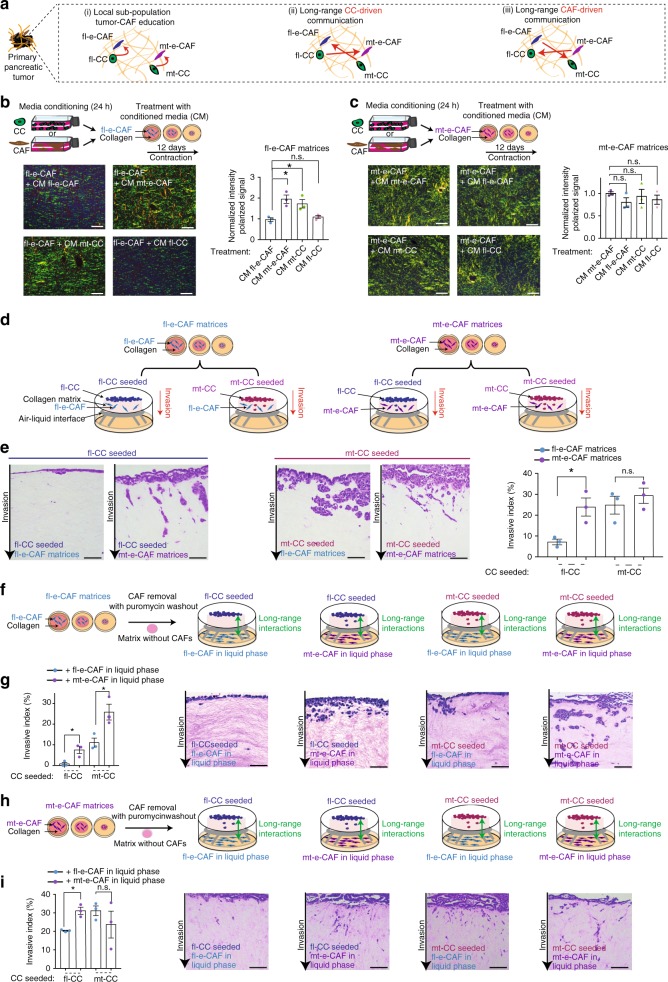
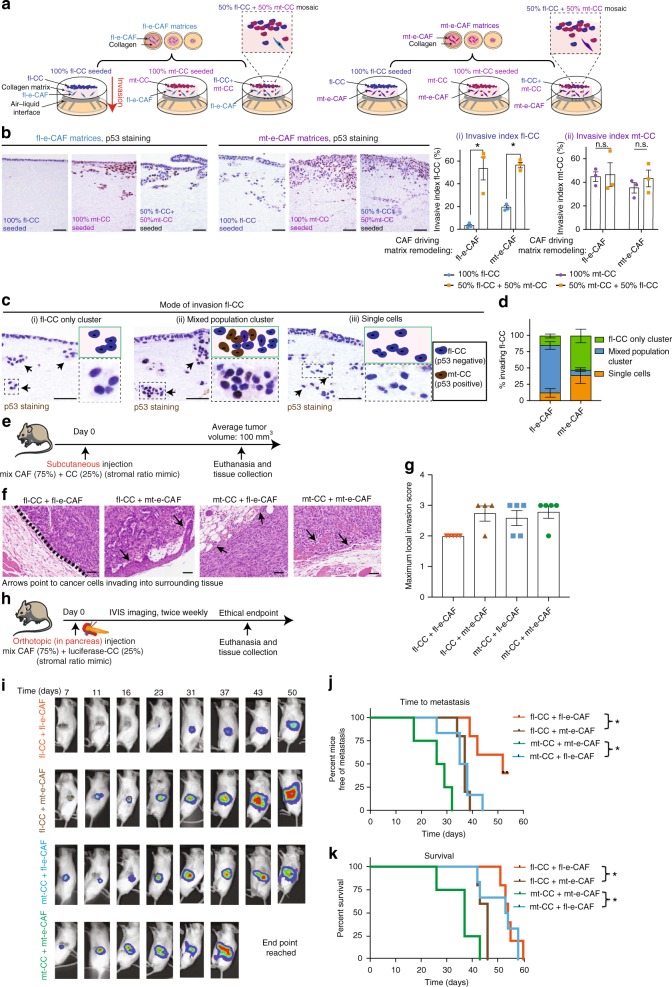
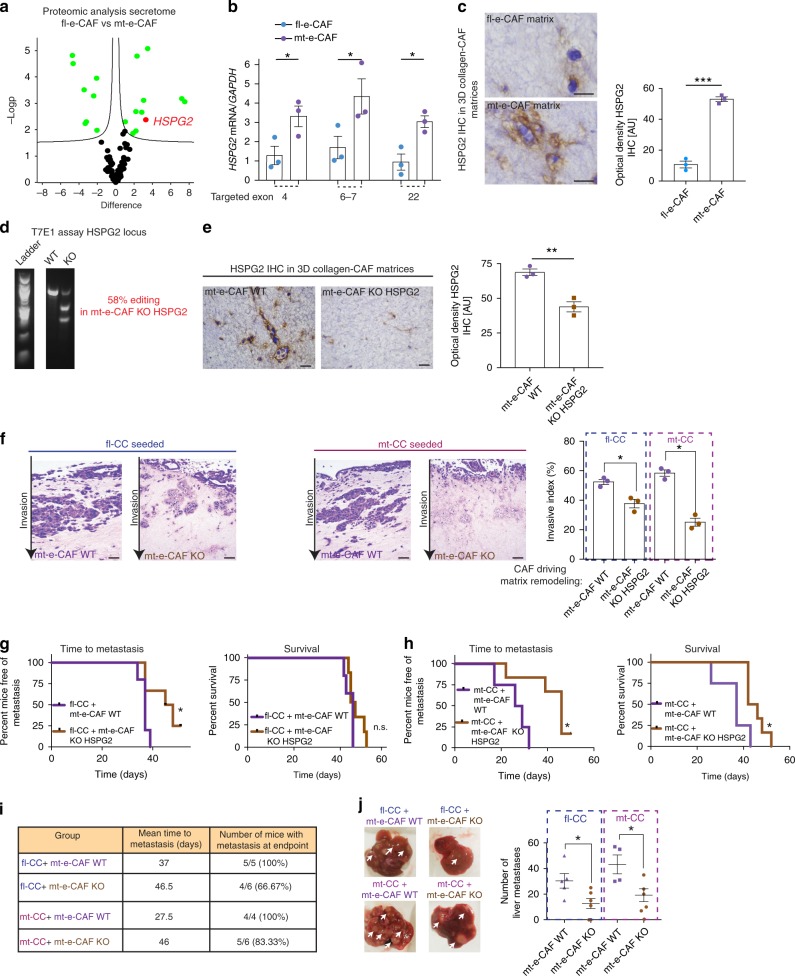
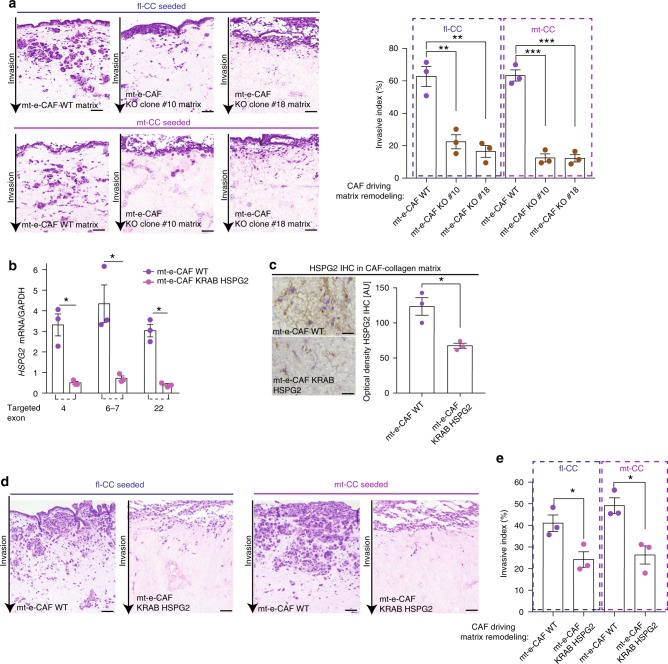
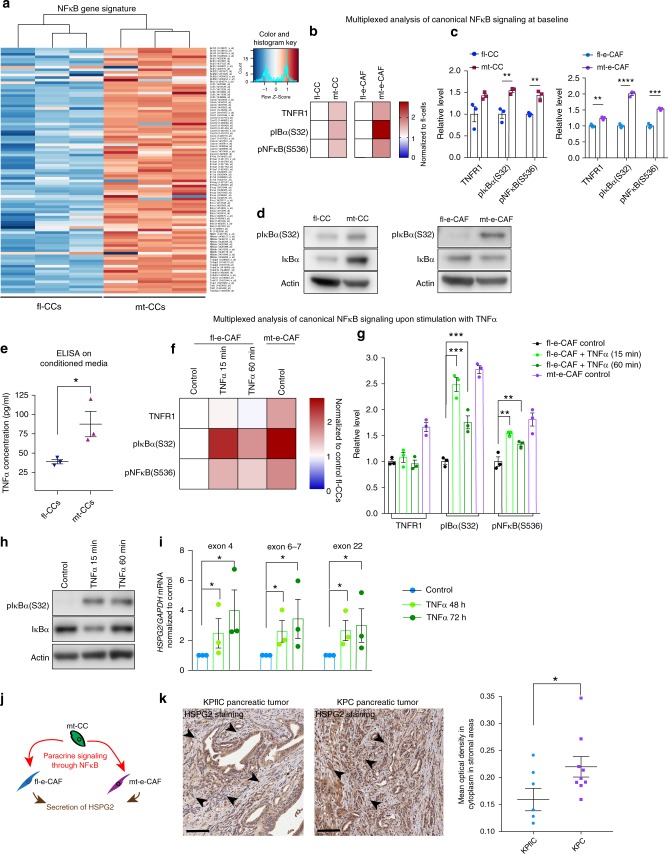
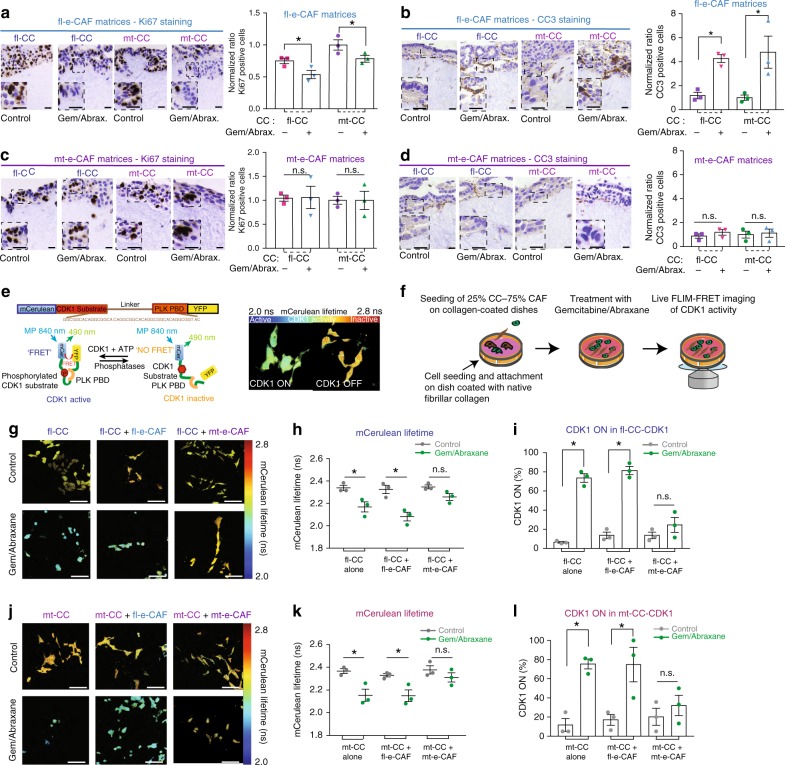
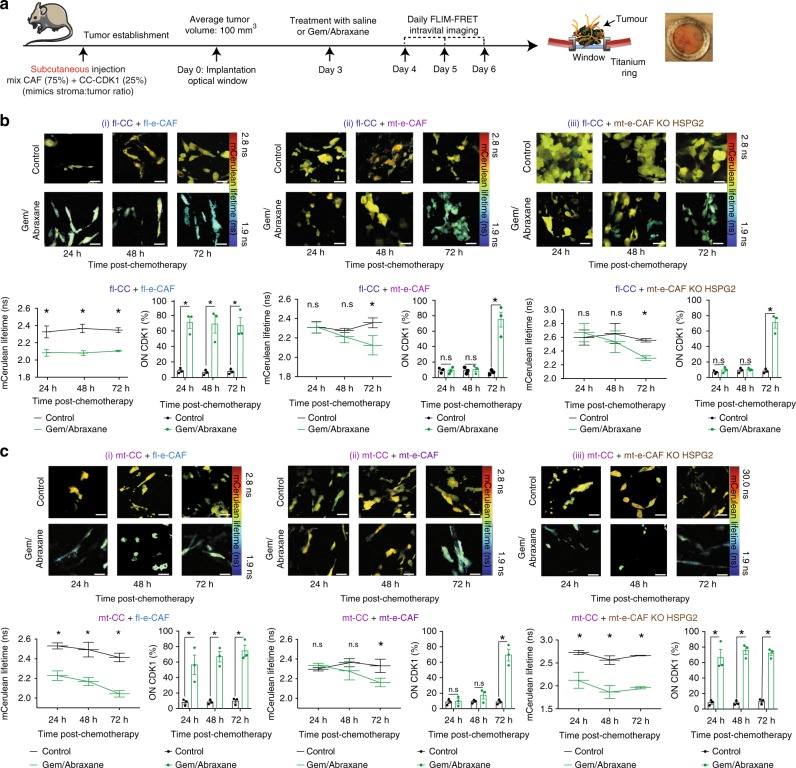
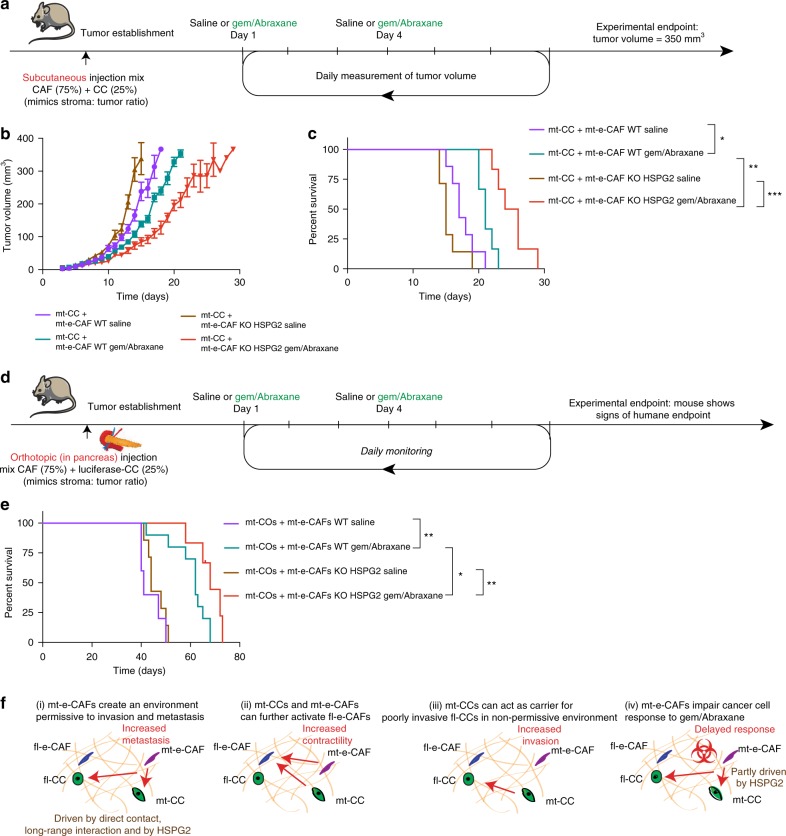
Heterogeneous subtypes of cancer-associated fibroblasts (CAFs) coexist within pancreatic cancer tissues and can both promote and restrain disease progression. Here, we interrogate how cancer cells harboring distinct alterations in p53 manipulate CAFs. We reveal the existence of a p53-driven hierarchy, where cancer cells with a gain-of-function (GOF) mutant p53 educate a dominant population of CAFs that establish a pro-metastatic environment for GOF and null p53 cancer cells alike. We also demonstrate that CAFs educated by null p53 cancer cells may be reprogrammed by either GOF mutant p53 cells or their CAFs. We identify perlecan as a key component of this pro-metastatic environment. Using intravital imaging, we observe that these dominant CAFs delay cancer cell response to chemotherapy. Lastly, we reveal that depleting perlecan in the stroma combined with chemotherapy prolongs mouse survival, supporting it as a potential target for anti-stromal therapies in pancreatic cancer.


Conflict of interest statement

The authors declare no competing interests.

Figures

Fig. 1
Fig. 1
Isolation and characterization of CAFs from KPflC and KPC primary tumors. a Representation of isolation of cancer cells and CAFs from poorly metastatic KPflC (top panel) and highly metastatic KPC (lower panel) primary tumors using the previously generated LSL-E-cadherin-GFP mouse. b Brightfield and GFP imaging of cancer cells and CAFs isolated from E-Cadherin-GFP-KPflC tumors and from E-Cadherin-GFP-KPC tumors. Scale bar: 100 μm. c Immunocytochemistry staining of markers of CAF activation (ACTA2 α-smooth muscle actin; FAP fibroblast activated protein) in fl-e-CAFs and mt-e-CAFs. Scale bar: 100 μm. d Immunofluorescence staining of CAFs and cancer cells for markers of pancreatic epithelial cells (E-cadherin, keratin 19). Scale bar: 100 μm. e Representation of CAF-driven contraction assay. f Representative images of CAF-collagen matrices and quantification of matrix area following a 12-day contraction assay. Scale bar: 1 cm, n = 3 biological repeats with three technical replicates per biological repeat. g Shear rheology measurements of storage modulus of matrices remodeled by fl-e-CAFs or by mt-e-CAFs and normalized to values found in fl-e-CAFs matrices. n = 3 biological repeats with three technical replicates per biological repeat. h Polarized light imaging and quantification of picrosirius red-stained collagen matrices remodeled by fl-e-CAFs or by mt-e-CAFs. Scale bar: 100 μm, n = 3 biological repeats with three technical replicates per biological repeat. i Representative maximum projections of Second Harmonic Generation (SHG) signal in collagen matrices remodeled by fl-e-CAFs and by mt-e-CAFs and quantification of SHG signal intensity through a 60 μm z-stack and at intensity peak (bar graph inset). Scale bar: 100 μm, n = 3 biological repeats with three technical replicates per biological repeat. j Representative single-plane SHG images of collagen matrices generated by fl-e-CAFs or by mt-e-CAFs and quantification of GLCM correlation (bar graph inset depicts GLCM mean correlation normalized to mean correlation found in fl-e-CAFs matrices). Scale bar: 100 μm, n = 3 biological repeats with three technical replicates per biological repeat. k Representative images of picrosirius red staining imaged with brightfield or polarized light and quantification of collagen birefringence signal in primary KPflC and KPC tumors. n = 7 for KPflC tumors and n = 9 for KPC tumors. Data are presented as mean values with SEM. *p < 0.05, **p < 0.01, ***p < 0.001, ****p < 0.0001
Fig. 2
Fig. 2
mt-cells further potentiate fl-e-CAFs and mt-e-CAFs to induce fl-CCs invasion. a Representation of (i) local crosstalk between cancer cells and CAFs, (ii) long-range CC driven interactions, and (iii) long-range CAF-driven interactions between cancer cells and CAFs across a primary pancreatic tumor. b Top panel: representation of media conditioning driven by cancer cells or by CAFs and treatment of fl-e-CAFs with conditioned media (CM) during remodeling of a collagen matrix over 12 days. Lower panel: representative images and quantification of collagen birefringence in fl-e-CAFs matrices treated with CM generated by fl-e-CAFs, mt-e-CAFs, mt-CCs or fl-CCs, and normalized to treatment with CM from fl-e-CAFs. Scale bar: 100 μm. c Top panel: representation of media conditioning driven by cancer cells or by CAFs and treatment of mt-e-CAFs with CM during remodeling of a collagen matrix over 12 days. Lower panel: representative images and quantification of collagen birefringence in mt-e-CAFs matrices treated with CM generated by mt-e-CAFs, fl-e-CAFs, mt-CCs or fl-CCs, and normalized to treatment with CM from mt-e-CAFs. Scale bar: 100 μm. d Schematic representation of 3D CAF-based organotypic invasion assay. e Representative H&E staining of organotypic invasion assay and quantification of invasive index for fl-CCs or mt-CCs invading into fl-e-CAF matrices (blue bars) or into mt-e-CAFs matrices (purple bars). Scale bar: 200 μm. f Schematic representation of 3D organotypic invasion assay including pharmaceutical removal of CAFs following matrix establishment and continuous media conditioning driven by CAFs during cancer cell invasion. g Quantification of invasive index and representative images of H&E stained organotypic matrices with fl-CCs and mt-CCs invading into matrices generated by fl-e-CAFs and with continuous media conditioning driven by fl-e-CAFs or by mt-e-CAFs during invasion. Scale bar: 200 μm. h Schematic representation, i quantification of invasive index and representative images of H&E stained organotypic matrices with fl-CCs and mt-CCs invading into matrices generated by mt-e-CAFs and with continuous media conditioning driven by fl-e-CAFs or by mt-e-CAFs during cancer cell invasion. Scale bar: 200 μm. Contraction and invasion assays were conducted in three biological repeats with three technical replicates per biological repeat. Individual data points are presented with mean values and SEM. *p < 0.05
Fig. 3
Fig. 3
mt-CCs act as carrier for fl-CCs and mt-e-CAFs drive local invasion and metastasis in vivo. a Schematic representation of 3D organotypic invasion assays with mosaic cancer cell cultures invading into matrices generated by fl-e-CAFs or mt-e-CAFs, b representative images of p53 staining (PAb421 antibody) and quantification of invasive index of (i) fl-CCs and (ii) mt-CCs invading alone or in a mosaic culture (fl-CCs + mt-CCs 50:50 ratio) into fl-e-CAF matrices or into mt-e-CAF matrices. Scale bar: 200 μm, n = 3 biological repeats with three technical replicates per biological repeat. c Representative images and schematic representation of p53 staining (PAb421 antibody) in organotypic matrices and depicting fl-CCs invading either as a cluster of fl-CCs only (i), as a mosaic cluster with mt-CCs (ii) or as single fl-CCs (iii). Scale bar: 200 μm. d Quantification of the mode of invasion followed by fl-CCs during invasion into fl-e-CAF matrices or into mt-e-CAF matrices and in the presence or absence of mt-CCs, n = 3 biological repeats with three technical replicates per repeat. e Schematic representation of subcutaneous injection of cancer cells (25%) with CAFs (75%), tumor growth and mouse euthanasia followed by tissue collection. f Representative H&E images, and g quantification of mean maximum score of cancer cell local invasion into the surrounding tissue in subcutaneous xenografts generated by fl-CCs injected with fl-e-CAFs (orange dots, n = 5 mice) or injected with mt-e-CAFs (brown dots, n = 4 mice) and in subcutaneous xenografts generated by mt-CCs injected with fl-e-CAFs (blue dots, n = 5 mice) or with mt-e-CAFs (green dots, n = 5 mice). Scale bar: 200 μm. h Schematic representation of orthotopic (in pancreas) injection of 50 luciferase-expressing CCs (fl-CCs or mt-CCs) with 150 CAFs (fl-e-CAFs or mt-e-CAFs) and IVIS whole body monitoring of tumor growth and metastatic spread. i Representative images of whole body IVIS imaging in mice bearing orthotopic xenografts, and j Kaplan–Meier survival analysis of time to metastasis and of k survival of mice orthotopically injected with fl-CCs + fl-e-CAFs (n = 5 mice); fl-CCs + mt-e-CAFs (n = 5 mice); mt-CCs + fl-e-CAFs (n = 6 mice) or with mt-CCs + mt-e-CAFs (n = 4 mice). Individual data points are presented with mean values and SEM. *p < 0.05
Fig. 4
Fig. 4
HSPG2 is a critical component of the permissive environment created by mt-e-CAFs. a Volcano plot depicting proteins differently secreted by fl-e-CAFs (left) and by mt-e-CAFs (right), n = 5 biological repeats. b. RT-qPCR analysis of HSPG2 mRNA levels in fl-e-CAFs and mt-e-CAFs, n = 3 biological repeats. c HSPG2 IHC staining and quantification of optical density of staining in collagen matrices remodeled by fl-e-CAFs and by mt-e-CAFs. Scale bar: 25 μm, n = 3 biological repeats with three technical replicates per biological repeat. d T7E1 assay at the HSPG2 locus in mt-e-CAFs WT and in a mixed population of mt-e-CAFs KO HSPG2. e HSPG2 IHC staining and quantification of optical density in collagen matrices remodeled by mt-e-CAFs WT or mt-e-CAFs KO HSPG2. Scale bar: 100 μm, n = 3 biological repeats with three technical replicates per biological repeat. f Representative H&E stained sections and quantification of invasive index for fl-CCs and mt-CCs invading into matrices remodeled by mt-e-CAFs WT or by mt-e-CAFs KO HSPG2. n = 3 biological repeats with three technical replicates per biological repeat. Scale bar: 100 μm. g Kaplan–Meier survival analysis of time to metastasis and Kaplan–Meier analysis of survival in mice orthotopically injected with fl-CCs + mt-e-CAFs WT (n = 5 mice, data shown in Fig. 3j-k) or with fl-CCs + mt-e-CAFs KO HSPG2 (n = 6 mice). h Kaplan–Meier survival analysis of time to metastasis and Kaplan–Meier analysis of survival in mice orthotopically injected with mt-CCs + mt-e-CAFs WT (n = 4 mice, data shown in Fig. 3j-k) or with fl-CCs + mt-e-CAFs KO HSPG2 (n = 6 mice). i Table summarizing mean time to metastasis and mice with metastasis at endpoint, and j number of liver metastases for mice orthotopically injected with fl-CCs + mt-e-CAFs WT, fl-CCs + mt-e-CAFs KO HSPG2, mt-CCs + mt-e-CAFs WT or mt-CCs + mt-e-CAFs KO HSPG2. Individual data points are presented with mean values and SEM. *p < 0.05, **p < 0.01, ***p < 0.001
Fig. 5
Fig. 5
Depleting HSPG2 deposition reduces cancer cell invasion. a Representative H&E images and quantification of invasive index for fl-CCs and for mt-CCs invading into matrices remodeled by mt-e-CAFs WT or by clones 10 and 18 isolated from the mixed population of mt-e-CAFs KO HSPG2. Scale bar: 100 μm. b RT-qPCR analysis of HSGP2 mRNA in mt-e-CAFs WT and in mt-e-CAFs transfected with a KRAB HSPG2 construct. c HSPG2 IHC staining and quantification of optical density in collagen matrices generated by mt-e-CAFs WT or by mt-e-CAFs transfected with the KRAB HSPG2 construct. Scale bar: 100 μm. d Representative H&E images and e quantification of invasive index for fl-CCs and for mt-CCs invading into collagen matrices generated by mt-e-CAFs WT or by mt-e-CAFs transfected with a KRAB HSPG2 construct. Scale bar: 100 μm. All experiments were conducted with three biological repeats and with three technical replicates per biological repeat. Individual data points are presented with mean values and SEM. *p < 0.05, **p < 0.01, ***p < 0.001
Fig. 6
Fig. 6
Paracrine signaling between mt-CCs and CAFs mediated by NFκB induces HSPG2 expression. a Heat map of microarray analysis of NFκB-target genes in fl-CCs versus mt-CCs (n = 3 independent replicates per cell line). b Heatmap and c quantification of multiplexed analysis of NFκB canonical signaling in fl-CCs, mt-CCs and their matched CAFs. n = 3 biological repeats. Data are normalized to fl-cells. d Western Blot analysis of pIκBα (S32) and IκBα at baseline in cancer cells and in their matched CAFs. e ELISA quantification of TNFα in conditioned media generated by fl-CCs and mt-CCs. n = 3 biological repeats. f Heat map and g quantification of multiplexed analysis of NFκB canonical signaling in fl-e-CAFs upon treatment with TNFα and in untreated mt-e-CAFs. h Western Blot analyses of pIκBα (S32) and IκBα in fl-e-CAFs upon stimulation with TNFα. i RT-qPCR analysis of HSPG2 expression in fl-e-CAFs upon treatment with TNFα. j Schematic of paracrine signaling between mt-CCs and the surrounding fibroblasts to drive HSPG2 secretion in the tumor microenvironment. k Representative images of HSPG2 staining and quantification of optical density in stromal areas of pancreatic tumors isolated from KPflC mice (n = 6) and KPC mice (n = 9). Individual data points are presented with mean values and SEM. Scale bar: 200 µm. *p < 0.05, **p < 0.01, ***p < 0.001, ****p < 0.0001
Fig. 7
Fig. 7
mt-e-CAFs impair cancer cell response to standard-of-care gemcitabine/Abraxane in vitro. a Representative images and quantification of Ki67 staining and of b cleaved-caspase 3 (CC3) staining of fl-CCs and mt-CCs invading into fl-e-CAF matrices upon treatment with control or with gemcitabine (100 nM)/Abraxane (100 nM) for 72 h. Scale bar: 50 μm, n = 3 biological repeats with three technical replicates per biological repeat. c Representative images and quantification of Ki67 staining and of d CC3 staining of fl-CCs and mt-CCs invading into mt-e-CAF matrices upon treatment with control or with gemcitabine (100 nM)/Abraxane (100 nM) for 72 h. Scale bar: 50 μm, n = 3 biological repeats with three technical replicates per biological repeat. e Schematic representation of the CDK1-FRET biosensor (adapted from 32) and representative mCerulean lifetime maps showing high CDK1 activity or low CDK1 activity as assessed via FLIM-FRET imaging of the CDK1-FRET biosensor. f Schematic representation of co-seeding of CAFs and cancer cells expressing the CDK1 biosensor on dishes coated with native fibrillar collagen, treatment with gemcitabine/Abraxane and FLIM-FRET imaging of CDK1 activity in cancer cells. g Representative mCerulean lifetime maps and h quantification of mCerulean lifetimes and i. CDK1 activity in fl-CCs cultured alone, cultured with fl-e-CAFs or with mt-e-CAFs and treated with control or with gemcitabine (100 nM)/Abraxane (100 nM) for 24 h. Scale bar: 100 μm, n = 3 biological repeats. j Representative mCerulean lifetime maps and k quantification of mCerulean lifetimes and l CDK1 activity in mt-CCs cultured alone, cultured with fl-e-CAFs or with mt-e-CAFs and treated with control or with gemcitabine (100 nM)/Abraxane (100 nM) for 24 h. Scale bar: 100 μm, n = 3 biological repeats, >100 cells analyzed per condition. Individual data points are presented with mean values and SEM. *p < 0.05
Fig. 8
Fig. 8
mt-e-CAFs delay fl-CC and mt-CC response to chemotherapy in an HSPG2-dependent manner for mt-CCs. a Schematic of timeline of subcutaneous injection of cancer cells with CAFs, tumor development, titanium window implantation, drug treatment, and longitudinal imaging. b Representative mCerulean lifetime maps (top images) and longitudinal quantification of mCerulean lifetimes (lower left hand panels) and of CDK1 activity (lower right hand panels) in fl-CCs injected with (i) fl-e-CAFs, with (ii) mt-e-CAFs WT or with (iii) mt-e-CAFs KO HSPG2 (mixed population) 24 h, 48 h, and 72 h after treatment with control or with gemcitabine/Abraxane. Scale bar: 100 μm, n = 3 mice per group. c Representative mCerulean lifetime maps (top images) and longitudinal quantification of mCerulean lifetimes (lower left hand panels) and CDK1 activity (lower right hand panels) in fl-CCs injected with (i) fl-e-CAFs, with (ii) mt-e-CAFs WT or with (iii) mt-e-CAFs KO HSPG2 (mixed population) at 24 h, 48 h, and 72 h after treatment with control or with gemcitabine/Abraxane. Scale bar: 100 μm, n = 3 mice per group. The threshold was calculated based on values between untreated and treated mice at 24 h post-treatment with gemcitabine/Abraxane for each group of cells co-injected subcutaneously. See Supplementary information for details on calculation of threshold. Individual data points are presented with mean values and SEM. *p < 0.05
Fig. 9
Fig. 9
Loss of HSPG2 in the stroma improves the efficacy of gemcitabine/Abraxane in vivo. a Schematic representation of subcutaneous injection and treatment timeline, b quantification of tumor volume and c. time to experimental endpoint for mice subcutaneously injected with mt-CCs + mt-e-CAFs WT and treated with saline (n = 7) or with gemcitabine/Abraxane (n = 6) or with mt-CCs + mt-e-CAFs KO HSPG2 and treated with saline (n = 7) or with gemcitabine/Abraxane (n = 6). d Schematic representation of orthotopic (in pancreas) injection and treatment timeline, and e survival for mice orthotopically injected with mt-COs + mt-e-CAFs WT and treated with saline (n = 5) or with gemcitabine/Abraxane (n = 10) or with mt-CCs + mt-e-CAFs KO HSPG2 and treated with saline (n = 7) or with gemcitabine/Abraxane (n = 5). f Schematic summary of main findings. *p < 0.05, **p < 0.01, ***p < 0.001

Comment in

Similar articles

Cited by

References

    1. Siegel RL, Miller KD, Jemal A. Cancer statistics, 2018. CA Cancer J. Clin. 2018;68:7–30. - PubMed
    1. Vennin Claire, Murphy Kendelle J., Morton Jennifer P., Cox Thomas R., Pajic Marina, Timpson Paul. Reshaping the Tumor Stroma for Treatment of Pancreatic Cancer. Gastroenterology. 2018;154(4):820–838. doi: 10.1053/j.gastro.2017.11.280. - DOI - PubMed
    1. O’Hayer KM, Brody JR. Personalized therapy for pancreatic cancer: do we need better targets, arrows, or both? Discov. Med. 2016;21:117–123. - PubMed
    1. Muller PA, Vousden KH. Mutant p53 in cancer: new functions and therapeutic opportunities. Cancer Cell. 2014;25:304–317. doi: 10.1016/j.ccr.2014.01.021. - DOI - PMC - PubMed
    1. Bailey P, et al. Genomic analyses identify molecular subtypes of pancreatic cancer. Nature. 2016;531:47–52. doi: 10.1038/nature16965. - DOI - PubMed

Publication types

MeSH terms