A Magnesium-Enriched 3D Culture System that Mimics the Bone Development Microenvironment for Vascularized Bone Regeneration
- PMID: 31380166
- PMCID: PMC6662069
- DOI: 10.1002/advs.201900209
A Magnesium-Enriched 3D Culture System that Mimics the Bone Development Microenvironment for Vascularized Bone Regeneration
Abstract
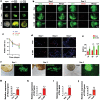
The redevelopment/regeneration pattern of amputated limbs from a blastema in salamander suggests that enhanced regeneration might be achieved by mimicking the developmental microenvironment. Inspired by the discovery that the expression of magnesium transporter-1 (MagT1), a selective magnesium (Mg) transporter, is significantly upregulated in the endochondral ossification region of mouse embryos, a Mg-enriched 3D culture system is proposed to provide an embryonic-like environment for stem cells. First, the optimum concentration of Mg ions (Mg2+) for creating the osteogenic microenvironment is screened by evaluating MagT1 expression levels, which correspond to the osteogenic differentiation capacity of stem cells. The results reveal that Mg2+ selectively activates the mitogen-activated protein kinase/extracellular regulated kinase (MAPK/ERK) pathway to stimulate osteogenic differentiation, and Mg2+ influx via MagT1 is profoundly involved in this process. Then, Mg-enriched microspheres are fabricated at the appropriate size to ensure the viability of the encapsulated cells. A series of experiments show that the Mg-enriched microenvironment not only stimulates the osteogenic differentiation of stem cells but also promotes neovascularization. Obvious vascularized bone regeneration is achieved in vivo using these Mg-enriched cell delivery vehicles. The findings suggest that biomaterials mimicking the developmental microenvironment might be promising tools to enhance tissue regeneration.
Keywords: 3D culture systems; biomaterials; developmental microenvironment; magnesium; vascularized bone regeneration.
Conflict of interest statement
The authors declare no conflict of interest.
Figures


Similar articles
-
Role of Magnesium Transporter Subtype 1 (MagT1) in the Osteogenic Differentiation of Rat Bone Marrow Stem Cells.Biol Trace Elem Res. 2016 May;171(1):131-7. doi: 10.1007/s12011-015-0459-4. Epub 2015 Sep 11. Biol Trace Elem Res. 2016. PMID: 26358767
-
MagT1 regulated the odontogenic differentiation of BMMSCs induced byTGC-CM via ERK signaling pathway.Stem Cell Res Ther. 2019 Jan 31;10(1):48. doi: 10.1186/s13287-019-1148-6. Stem Cell Res Ther. 2019. PMID: 30704530 Free PMC article.
-
Magnesium-enriched microenvironment promotes odontogenic differentiation in human dental pulp stem cells by activating ERK/BMP2/Smads signaling.Stem Cell Res Ther. 2019 Dec 10;10(1):378. doi: 10.1186/s13287-019-1493-5. Stem Cell Res Ther. 2019. PMID: 31823825 Free PMC article.
-
Effects of nanofibers on mesenchymal stem cells: environmental factors affecting cell adhesion and osteogenic differentiation and their mechanisms.J Zhejiang Univ Sci B. 2020 Nov.;21(11):871-884. doi: 10.1631/jzus.B2000355. J Zhejiang Univ Sci B. 2020. PMID: 33150771 Free PMC article. Review.
-
Impact of developmental origin, niche mechanics and oxygen availability on osteogenic differentiation capacity of mesenchymal stem/stromal cells.Acta Biochim Pol. 2019 Dec 29;66(4):491-498. doi: 10.18388/abp.2019_2893. Acta Biochim Pol. 2019. PMID: 31883439 Review.
Cited by
-
Research status and prospects of biodegradable magnesium-based metal guided bone regeneration membranes.Hua Xi Kou Qiang Yi Xue Za Zhi. 2024 Aug 1;42(4):415-425. doi: 10.7518/hxkq.2024.2024140. Hua Xi Kou Qiang Yi Xue Za Zhi. 2024. PMID: 39049628 Free PMC article. Review. Chinese, English.
-
Individualized plasticity autograft mimic with efficient bioactivity inducing osteogenesis.Int J Oral Sci. 2021 Apr 12;13(1):14. doi: 10.1038/s41368-021-00120-w. Int J Oral Sci. 2021. PMID: 33846295 Free PMC article.
-
Construction of Dual-Biofunctionalized Chitosan/Collagen Scaffolds for Simultaneous Neovascularization and Nerve Regeneration.Research (Wash D C). 2020 Aug 10;2020:2603048. doi: 10.34133/2020/2603048. eCollection 2020. Research (Wash D C). 2020. PMID: 32851386 Free PMC article.
-
Mn-containing bioceramics inhibit osteoclastogenesis and promote osteoporotic bone regeneration via scavenging ROS.Bioact Mater. 2021 Apr 12;6(11):3839-3850. doi: 10.1016/j.bioactmat.2021.03.039. eCollection 2021 Nov. Bioact Mater. 2021. PMID: 33898880 Free PMC article.
-
Bone tissue engineering for treating osteonecrosis of the femoral head.Exploration (Beijing). 2023 Feb 28;3(2):20210105. doi: 10.1002/EXP.20210105. eCollection 2023 Apr. Exploration (Beijing). 2023. PMID: 37324030 Free PMC article. Review.
References
-
- a) Stevens M., Mater. Today 2008, 11, 18;
- b) Tang D., Tare R., Yang L., Williams D., Ou K., Oreffo R., Biomaterials 2016, 83, 363. - PubMed
-
- Simon A., Tanaka E., WIREs Dev. Biol. 2013, 2, 291. - PubMed
-
- a) Gerber T., Murawala P., Knapp D., Masselink W., Schuez M., Hermann S., Gac‐Santel M., Nowoshilow S., Kageyama J., Khattak S., Currie J., Camp J., Tanaka E., Treutlein B., Science 2018, 362, eaaq0681; - PMC - PubMed
- b) Tanaka H., Ng N., Yang Yu Z., Casco‐Robles M., Maruo F., Tsonis P., Chiba C., Nat. Commun. 2016, 7, 11069. - PMC - PubMed
-
- a) Cui H., Zhu W., Holmes B., Zhang L., Adv. Sci. 2016, 3, 1600058; - PMC - PubMed
- b) Petersen A., Princ A., Korus G., Ellinghaus A., Leemhuis H., Herrera A., Klaumunzer A., Schreivogel S., Woloszyk A., Schmidt‐Bleek K., Geissler S., Heschel I., Duda G., Nat. Commun. 2018, 9, 4430; - PMC - PubMed
- c) Santos M., Reis R., Macromol. Biosci. 2010, 10, 12. - PubMed
LinkOut - more resources
Full Text Sources
Other Literature Sources
Miscellaneous
