. 2019 Oct;18(5):e13014.
doi: 10.1111/acel.13014. Epub 2019 Aug 1.

Hypothalamic mTORC2 is essential for metabolic health and longevity

Affiliations

Hypothalamic mTORC2 is essential for metabolic health and longevity

Karthikeyani Chellappa et al. Aging Cell. 2019 Oct.

Abstract

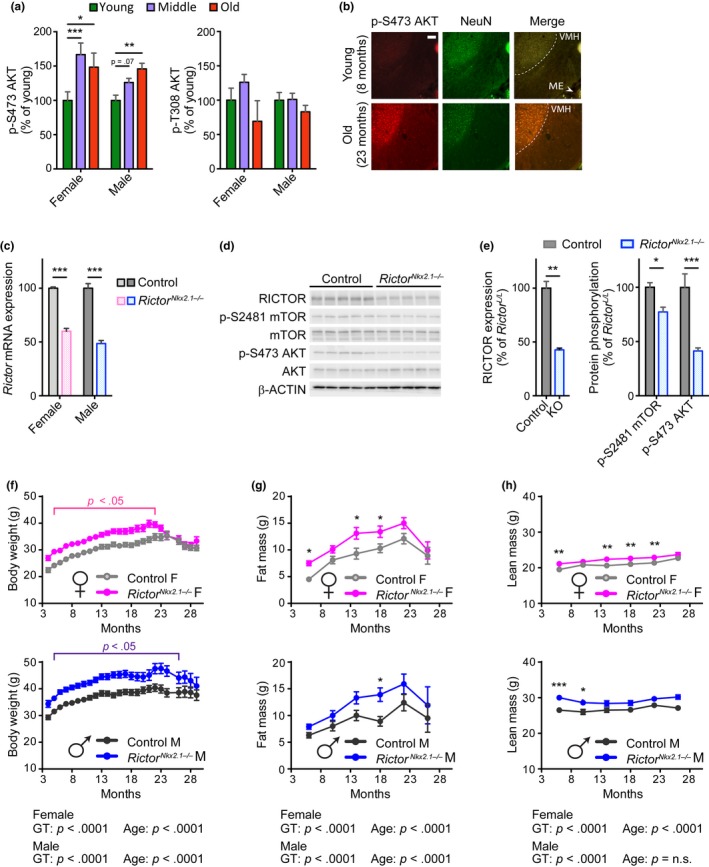
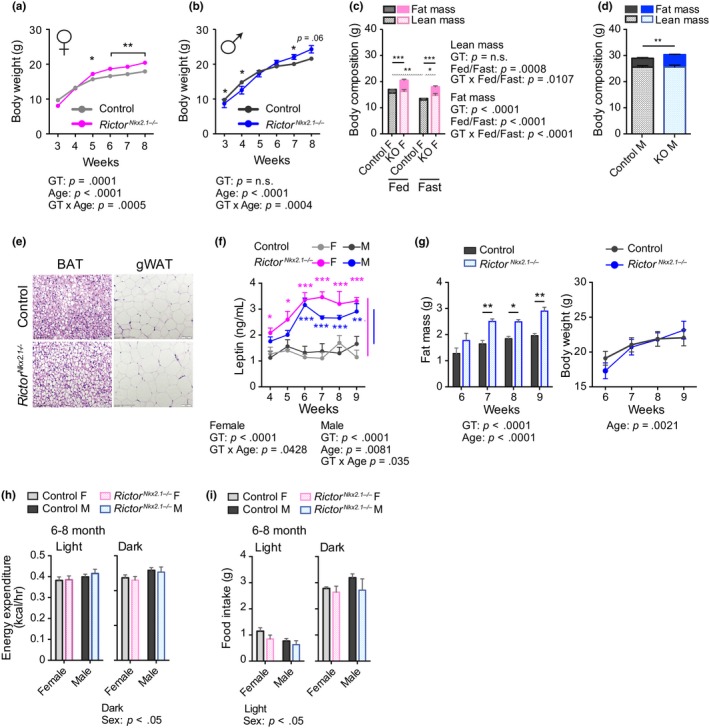
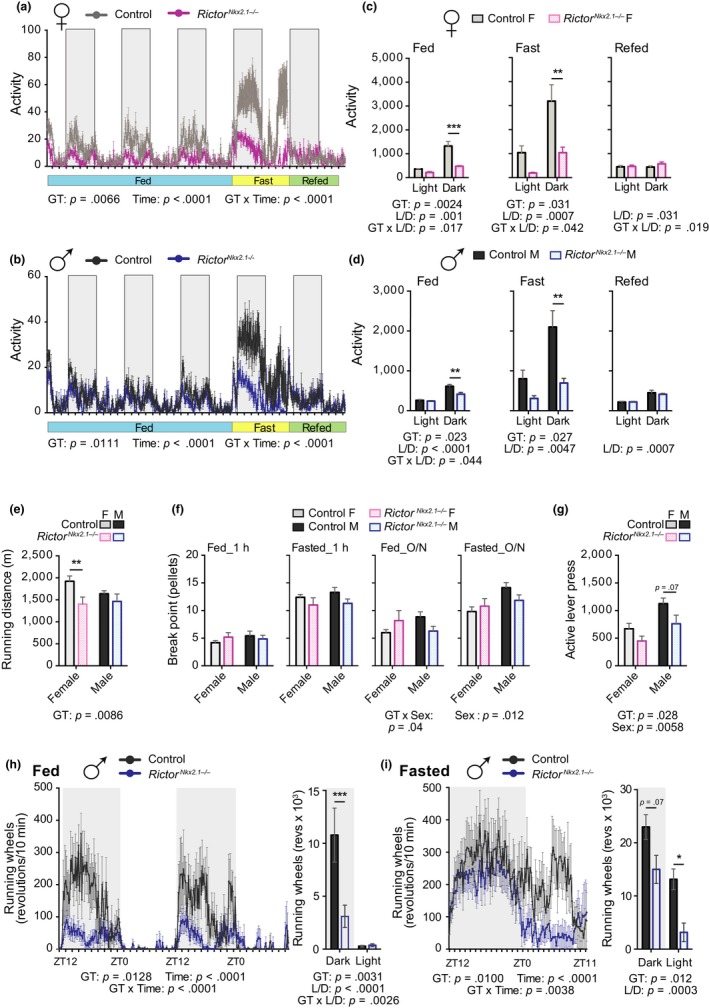
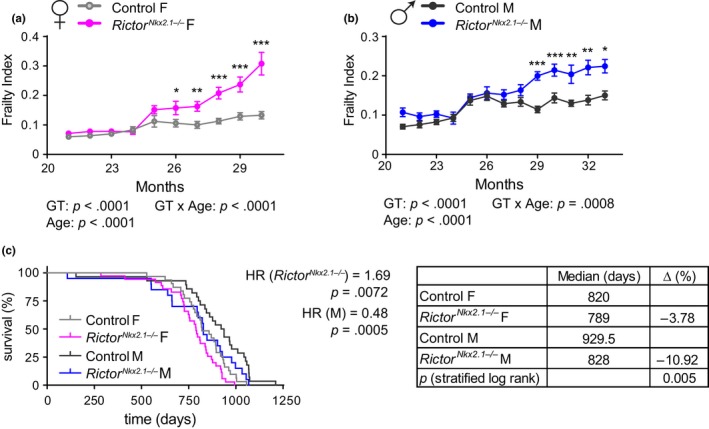
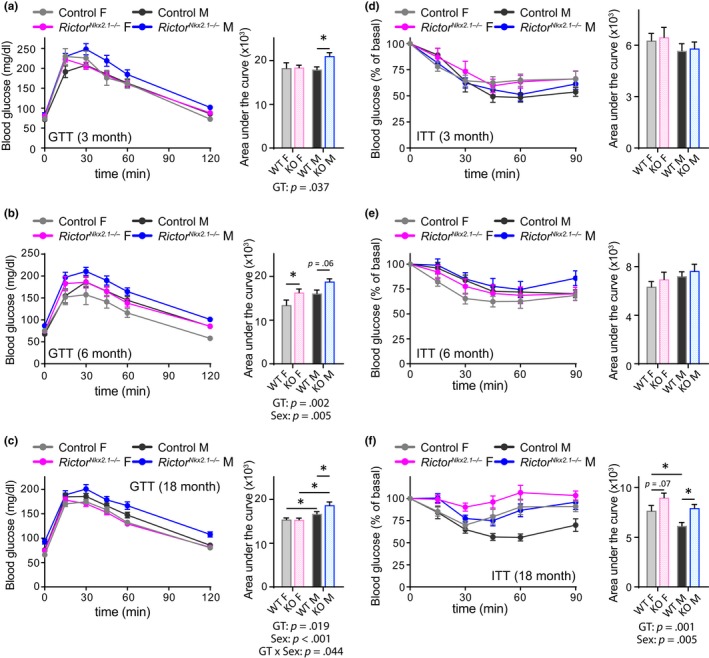
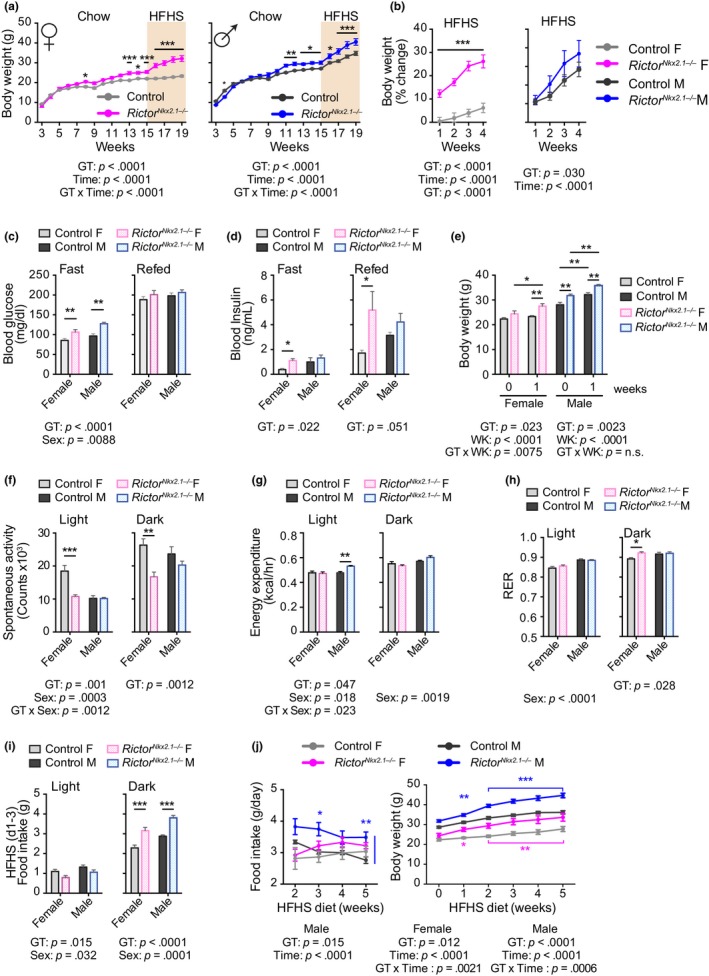
The mechanistic target of rapamycin (mTOR) is an evolutionarily conserved protein kinase that regulates growth and metabolism. mTOR is found in two protein complexes, mTORC1 and mTORC2, that have distinct components and substrates and are both inhibited by rapamycin, a macrolide drug that robustly extends lifespan in multiple species including worms and mice. Although the beneficial effect of rapamycin on longevity is generally attributed to reduced mTORC1 signaling, disruption of mTORC2 signaling can also influence the longevity of worms, either positively or negatively depending on the temperature and food source. Here, we show that loss of hypothalamic mTORC2 signaling in mice decreases activity level, increases the set point for adiposity, and renders the animals susceptible to diet-induced obesity. Hypothalamic mTORC2 signaling normally increases with age, and mice lacking this pathway display higher fat mass and impaired glucose homeostasis throughout life, become more frail with age, and have decreased overall survival. We conclude that hypothalamic mTORC2 is essential for the normal metabolic health, fitness, and lifespan of mice. Our results have implications for the use of mTORC2-inhibiting pharmaceuticals in the treatment of brain cancer and diseases of aging.

Keywords: frailty; hypothalamus; lifespanobesity; mTOR; mTORC2; obesity.


Conflict of interest statement

D.W.L has received funding from and is a scientific advisory board member of, Aeonian Pharmaceuticals, which seeks to develop novel, selective mTOR inhibitors for the treatment of various diseases.

Figures

Figure 1
Figure 1
Hypothalamic mTORC2 signaling increases with age and regulates body weight homeostasis. (a) Quantification of phosphorylated AKT residues in whole brain lysate from fasted female and male C57BL.6J.Nia mice; young refers to 6‐month‐old males and females (10 males, 5 females), middle refers to 24‐month‐old males and 22‐month‐old females (10 males, 5 females), and old refers to 30‐month‐old males and 26‐month‐old females (8 males, 4 females). Quantification of phosphorylated proteins are relative to total protein (Dunnett's test following two‐way ANOVA, * = p < .05, ** = p < .01, *** = p < .001). (b) mTORC2 activity, as determined by IHC‐IF for phosphorylated Akt S473 (in red), is increased in the hypothalamus of overnight fasted 23‐month‐old female C57BL.6J.Nia mice relative to young 8‐month‐old mice. A neuronal nuclei marker is targeted by the NeuN antibody (in green), showing the mTORC2 signaling is increased in aged neurons in these regions. Shown are representative images of hypothalamic regions (total n examined = 4 mice/group). Scale bar = 100 µm. (c) Expression of Rictor mRNA in hypothalamic tissue of 3‐ to 6‐month‐old RictorNkx2.1−/− mice and controls (n = 5‐8/group; *** = p < .001, Holm–Sidak test following two‐way ANOVA). (d) Hypothalamic protein lysates from 6‐month‐old male control and RictorNkx2.1−/− mice were immunoblotted for phosphorylated and total AKT, phosphorylated and total mTOR, RICTOR, and β‐ACTIN. (e) Quantification of RICTOR expression relative to β‐ACTIN and phosphorylated mTOR and AKT relative to total protein (n = 5 control and 9 RictorNkx2.1−/− mice; left: ** = p < .01, t test; right: Holm–Sidak test following two‐way ANOVA, * = p < .05, *** = p < .001). (f) Longitudinal assessment of body weight of control and RictorNkx2.1−/− mice (n = 5–35 per group; p < .05 indicates significant difference between genotypes at each time point within the indicated range, Holm–Sidak test following two‐way ANOVA). (g, h) Longitudinal assessment of (g) fat mass and (H) lean mass of control and RictorNkx2.1−/− mice (n = 5–29 mice/group; Holm–Sidak test following two‐way ANOVA, * = p < .05, ** = p < .01, *** = p < .001). (f–h) The overall effect of genotype (GT), age, and the interaction represents the p‐value from a two‐way ANOVA. Error bars represent the SEM
Figure 2
Figure 2
Early onset of obesity in mice lacking Rictor in hypothalamic neurons. (a and b) The weights of (a) female and (b) male control and RictorNkx2.1−/− mice were tracked from 3 to 8 weeks of age (n varies by time point and group, n = 4–31; Holm–Sidak test following two‐way ANOVA, * = p < .05, ** = p < .01). (c and d) Lean and fat mass in (c) 10‐wk‐old female mice (n = 5‐6/group; Holm–Sidak test following two‐way ANOVA, * = p < .05, ** = p < .01, *** = p < .001, solid lines indicate comparisons of fat mass and spotted lines indicate comparison of lean mass) and (d) 20‐ to 22‐week‐old male mice (n = 5‐9/group; t test, ** = p < .01). (e) H&E‐stained BAT and gonadal white adipose tissue from 24‐ to 26‐wk‐old chow fed male mice. (f) Plasma leptin levels of female and male RictorNkx2.1−/− mice (n = 6–8 mice/group; Sidak test following two‐way ANOVA, * = p < .05, ** = p < .01, *** = p < .001, blue/pink stars indicate significant difference vs. male/female controls). (Corresponding body weight curve is represented in Figure 6a, week four to nine on chow diet) (g) Fat mass (Left) and body weight (Right) of male control and RictorNkx2.1−/− mice (n = 5–6 mice/group; Sidak test following two‐way ANOVA, * = p < .05, *** = p < .001). (h) Energy expenditure of 24‐ to 33‐wk‐old female and male mice; per mouse basis (n = 6 mice/group; Sidak test following two‐way ANOVA, * = p < .05). (i) Twenty‐four hour food intake of 24‐ to 33‐wk‐old female and male mice on normal chow (n = 6 mice/group; Sidak test following two‐way ANOVA, * = p < .05).The overall effect of either genotype (GT) and age (panels A, B, F, G), GT and feeding status (C) or GT and sex (panels H‐I), and the interaction represents the p‐value from a two‐way ANOVA. Error bars represent the SEM
Figure 3
Figure 3
Voluntary home cage and running wheel activity but not goal‐oriented tasks is reduced in RictorNkx2.1−/− mice. (a and b) Traces of average home cage activity of 13‐ to 14‐wk‐old female (a) and male (b) mice under the conditions indicated, as determined by telemetry with counts binned into 10‐min blocks. The overall effect of genotype (GT), time, and the interaction represents the p‐value from a two‐way RM ANOVA. (c and d) Quantification of the data in panels a and b; activity during the fed condition represents a two day average; during fasting and refeeding over ~24‐hr time period (n = 4–5 mice/group; Sidak test following two‐way ANOVA, * = p < .05, ** = p < .01, *** = p < .001). (e) Average distance run on a treadmill at exhaustion for 11‐wk‐old male and female mice (n = 4–10 mice/group, Sidak test following two‐way ANOVA, * = p < .05, ** = p < .01). (f) Eight‐month‐old control and RictorNkx2.1−/− mice of both sexes were trained to press a lever to obtain food pellets. Pellets received prior to a 10‐min gap without earning a pellet (the “break point”) in a progressive ratio operant task conducted for one hour during the light period under fed and fasted conditions (1h PR) or during an overnight progressive ratio operant task under fed and fasted conditions (overnight PR). (n = 5–7 mice/group; Sidak test following two‐way ANOVA, * = p < .05). (g) Number of active lever presses during an overnight extinction paradigm where mice do not receive food pellets in response to lever presses (n = 5–7 mice/group; Sidak test following two‐way ANOVA, * = p < .05). (e–g) The overall effect of genotype (GT), sex, and the interaction represents the p‐value from a two‐way ANOVA. (h and i) Voluntary running wheel activity of 4‐month‐old male mice during (h) ad libitum feeding and (i) 24‐hr food deprivation. Data represented as revolutions per 10‐min bin. Inset, cumulative running wheel activity during the light and dark periods (n = 5‐8/group; Sidak test following two‐way RM ANOVA, * = p < .05, *** = p < .001). (h and i) The overall effect of genotype (GT), time, and the interaction represents the p‐value from a two‐way ANOVA. Error bars represent the SEM
Figure 4
Figure 4
Hypothalamic mTORC2 signaling is essential for healthspan and lifespan. (a and b) Frailty was assessed longitudinally in (a) female and (b) male mice starting at 21 months of age (n = numbers vary month by month; 2–24 mice/group at each time point). (c) Kaplan–Meier plot showing the lifespan of female and male control and RictorNkx2.1−/− mice. The overall effect of genotype (RictorNkx2.1−/−) and sex (M) was determined using a Cox proportional hazards test (HR, hazard ratio). The table shows the median lifespan for each group, the percentage decrease in median lifespan for each sex, and the two‐tailed stratified log‐rank p‐value for the decrease in lifespan as a result of deletion of hypothalamic Rictor. Error bars represent the SEM
Figure 5
Figure 5
RictorNkx2.1−/− mice have lifelong impairment of glucose tolerance and develop insulin resistance. Metabolic health was assessed by performing (a–c) a fasting glucose tolerance test (GTT) and (d–f) a fasting insulin tolerance test (ITT) on both sexes of control and RictorNkx2.1−/− mice at approximately (a and d) 3 months, (b and e) 6 months, and (c and f) 18 months of age. (a and d) n = 6–14 mice/group, 2–3 months of age; (b and e) n = 9–10 mice/group, 5–6 months of age; (c and f) n = 20–32 mice/group, 15–20 months of age. Area under the curve: the overall effect of genotype (GT), sex, and the interaction represents the p‐value from a two‐way ANOVA; * = p < .05 from a Sidak's post‐test examining the effect of parameters identified as significant in the two‐way ANOVA. Error bars represent the SEM
Figure 6
Figure 6
RictorNkx2.1−/− mice have increased susceptibility to diet‐induced obesity. (a and b) The body weight of control and RictorNkx2.1−/− mice of both sexes was tracked on chow diet and following a switch to a high‐fat, high‐sucrose (HFHS) diet as indicated, and (a) weight and (b) percentage weight gain on HFHS diet were plotted (n = 5‐12/group; Sidak test following two‐way ANOVA, * = p < .05, ** = p < .01, *** = p < .001). The overall effect of genotype (GT), time (T), and the interaction represents the p‐value from (a) a two‐way ANOVA or a (b) RM ANOVA. (c and d) Mice fed a HFHS diet for 3 weeks were fasted overnight and then refed for 4 hr, with collection of blood for the determination of (c) blood glucose and (d) insulin (n = 4–12 mice/group; Sidak's test following two‐way ANOVA, * = p < .05, **p = < .01). (e–i) Metabolic chambers were used to interrogate the metabolic effects of 1 week of HFHS diet feeding. (e) Body weight (f) spontaneous activity (g), energy expenditure per mouse (h) RER, and (i) average food intake during days 1–3 of HFHS feeding (n = 6 mice/group; Sidak's test following two‐way ANOVA, * = p < .05, ** = p < .01, *** = p < .001). (c–i) The overall effect of genotype (GT), sex, and the interaction represents the p‐value from a two‐way ANOVA. (j) Food intake (left) and body weight (right) of control and RictorNkx2.1−/− mice of both sexes was tracked on a HFHS diet (n = 6 mice/group; Sidak's test following RM two‐way ANOVA, * = p < .05, ** = p < .01, *** = p < .001, blue/pink stars indicate significant difference vs. male/female controls). The overall effect of genotype (GT), time on diet (T), and the interaction represents the p‐value from a two‐way ANOVA. Error bars represent the SEM

Similar articles

Cited by

  • Regulation of metabolic health by dietary histidine in mice.
    Flores V, Spicer AB, Sonsalla MM, Richardson NE, Yu D, Sheridan GE, Trautman ME, Babygirija R, Cheng EP, Rojas JM, Yang SE, Wakai MH, Hubbell R, Kasza I, Tomasiewicz JL, Green CL, Dantoin C, Alexander CM, Baur JA, Malecki KC, Lamming DW. Flores V, et al. J Physiol. 2023 Jun;601(11):2139-2163. doi: 10.1113/JP283261. Epub 2022 Sep 27. J Physiol. 2023. PMID: 36086823 Free PMC article.
  • Reduced insulin signaling in neurons induces sex-specific health benefits.
    Baghdadi M, Nespital T, Mesaros A, Buschbaum S, Withers DJ, Grönke S, Partridge L. Baghdadi M, et al. Sci Adv. 2023 Feb 22;9(8):eade8137. doi: 10.1126/sciadv.ade8137. Epub 2023 Feb 22. Sci Adv. 2023. PMID: 36812323 Free PMC article.
  • The mTOR-lysosome axis at the centre of ageing.
    Carosi JM, Fourrier C, Bensalem J, Sargeant TJ. Carosi JM, et al. FEBS Open Bio. 2022 Apr;12(4):739-757. doi: 10.1002/2211-5463.13347. Epub 2021 Dec 18. FEBS Open Bio. 2022. PMID: 34878722 Free PMC article. Review.
  • A toolbox for the longitudinal assessment of healthspan in aging mice.
    Bellantuono I, de Cabo R, Ehninger D, Di Germanio C, Lawrie A, Miller J, Mitchell SJ, Navas-Enamorado I, Potter PK, Tchkonia T, Trejo JL, Lamming DW. Bellantuono I, et al. Nat Protoc. 2020 Feb;15(2):540-574. doi: 10.1038/s41596-019-0256-1. Epub 2020 Jan 8. Nat Protoc. 2020. PMID: 31915391 Free PMC article.
  • Blazing a trail for the clinical use of rapamycin as a geroprotecTOR.
    Konopka AR, Lamming DW; RAP PAC Investigators; EVERLAST Investigators. Konopka AR, et al. Geroscience. 2023 Oct;45(5):2769-2783. doi: 10.1007/s11357-023-00935-x. Epub 2023 Oct 6. Geroscience. 2023. PMID: 37801202 Free PMC article.

References

    1. Abreu‐Vieira, G. , Xiao, C. , Gavrilova, O. , & Reitman, M. L. (2015). Integration of body temperature into the analysis of energy expenditure in the mouse. Molecular Metabolism, 4, 461–470. 10.1016/j.molmet.2015.03.001 - DOI - PMC - PubMed
    1. Alhadeff, A. L. , & Grill, H. J. (2014). Hindbrain nucleus tractus solitarius glucagon‐like peptide‐1 receptor signaling reduces appetitive and motivational aspects of feeding. American Journal of Physiology‐Regulatory, Integrative and Comparative Physiology, 307(4), R465–R470. 10.1152/ajpregu.00179.2014+ - DOI - PMC - PubMed
    1. Anon (2016). Body‐mass index and all‐cause mortality: Individual‐participant‐data meta‐analysis of 239 prospective studies in four continents. Lancet, 388(10046), 776–786. 10.1016/S0140-6736(16)30175-1. - DOI - PMC - PubMed
    1. Apelo, S. I. A. , Pumper, C. P. , Baar, E. L. , Cummings, N. E. , & Lamming, D. W. (2016). Intermittent administration of rapamycin extends the life span of female C57BL/6J mice. The Journals of Gerontology. Series A, Biological Sciences and Medical Sciences, 71(7), 876–881. 10.1093/gerona/glw064 - DOI - PMC - PubMed
    1. Arriola Apelo, S. I. , & Lamming, D. W. (2016). Rapamycin: An InhibiTOR of aging emerges from the soil of Easter Island. The Journals of Gerontology Series A: Biological Sciences and Medical Sciences, 71(7), 841–849. 10.1093/gerona/glw090 - DOI - PMC - PubMed

Publication types

Substances

LinkOut - more resources