

Autophagy inhibition of cancer stem cells promotes the efficacy of cisplatin against non-small cell lung carcinoma
- PMID: 31368411
- PMCID: PMC6676261
- DOI: 10.1177/1753466619866097
Autophagy inhibition of cancer stem cells promotes the efficacy of cisplatin against non-small cell lung carcinoma
Abstract
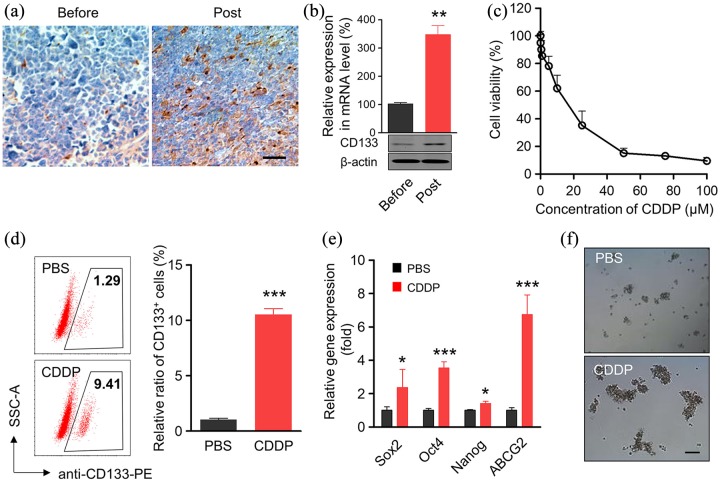
Background: Clinical treatment of non-small cell lung carcinoma (NSCLC) by cisplatin eventually results in drug resistance, which cancer stem cells and autophagy are believed to be involved in. In the present study, we aimed to explore the effect of autophagy-inhibited cancer stem cells in NSCLC.
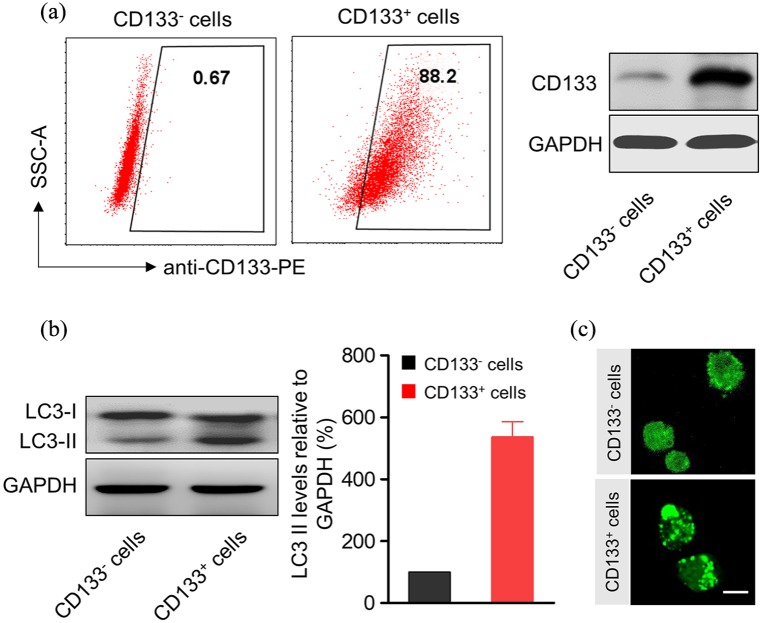
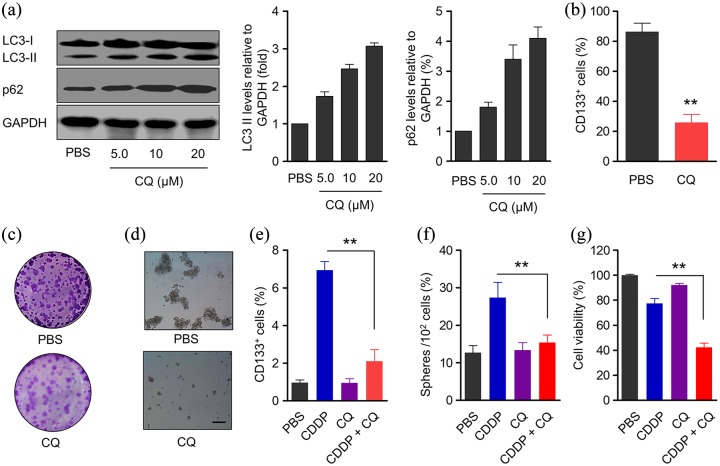
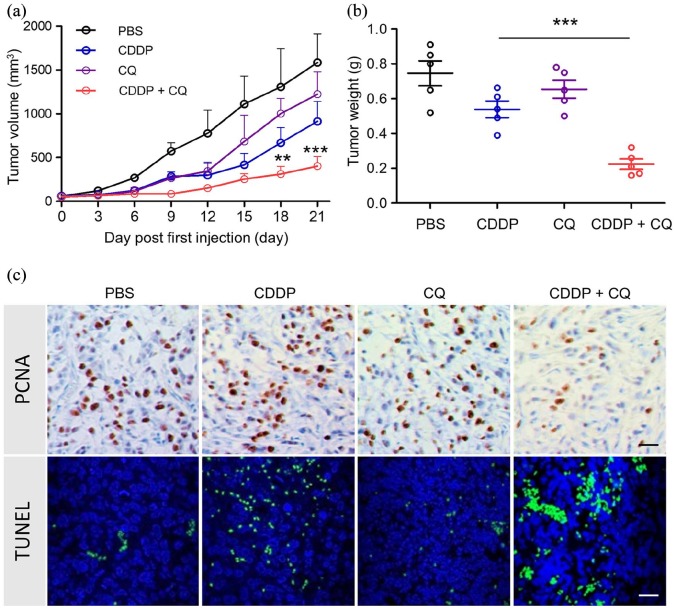
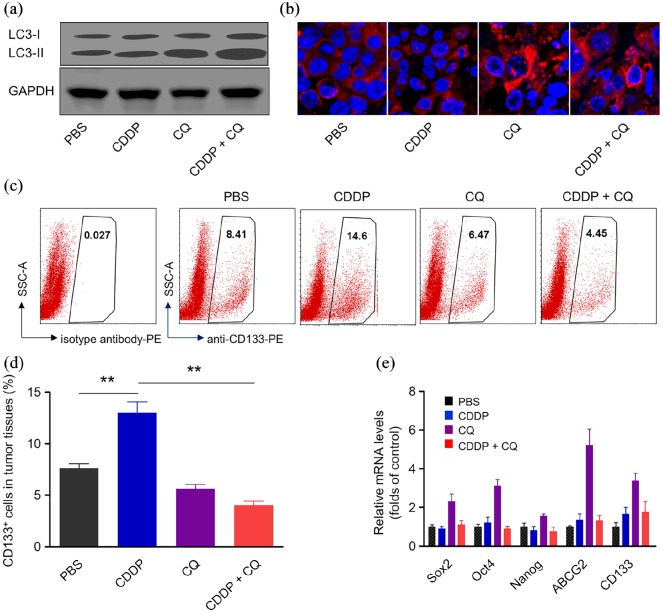
Methods: Cancer stem cells were identified by CD133 expression levels detected by immunochemistry, real-time polymerase chain reaction, western blot, and flow cytometry. Stemness was detected by sphere-forming assays of tumor cells. Autophagy was determined by LC3-II expression at mRNA and protein levels. The effect of chloroquine (CQ) on autophagy was detected by real-time polymerase chain reaction, western blot and sphere-forming assay in vitro, and tumor growth in male NOD/SCID mice.
Results: Cisplatin (CDDP) treatment enhanced CD133+ cell ratios in clinical NSCLC specimens and NSCLC cell line A549. The CD133+ cells enriched by CDDP exhibited higher autophagy levels. Autophagy inhibition by CQ inhibited CD133+ stemness and promoted CDDP efficiency in A549 cells. In addition, the combination of CDDP and CQ treatment significantly inhibited autophagy levels and cancer stem cell proportions in vitro, and dramatically suppressed tumor growth compared with individual agents.
Conclusion: Autophagy inhibition of cancer stem cells could promote the efficacy of cisplatin against NSCLC.
Keywords: autophagy; cancer stem cell; cisplatin; non-small cell lung carcinoma.
Conflict of interest statement
Figures
Similar articles
-
Autophagy Inhibition Overcomes the Antagonistic Effect Between Gefitinib and Cisplatin in Epidermal Growth Factor Receptor Mutant Non--Small-Cell Lung Cancer Cells.Clin Lung Cancer. 2015 Sep;16(5):e55-66. doi: 10.1016/j.cllc.2015.03.006. Epub 2015 Apr 2. Clin Lung Cancer. 2015. PMID: 25979647
-
Highly tumorigenic lung cancer CD133+ cells display stem-like features and are spared by cisplatin treatment.Proc Natl Acad Sci U S A. 2009 Sep 22;106(38):16281-6. doi: 10.1073/pnas.0905653106. Epub 2009 Sep 10. Proc Natl Acad Sci U S A. 2009. PMID: 19805294 Free PMC article.
-
Combination treatment of FTY720 and cisplatin exhibits enhanced antitumour effects on cisplatin-resistant non-small lung cancer cells.Oncol Rep. 2018 Feb;39(2):565-572. doi: 10.3892/or.2017.6111. Epub 2017 Nov 24. Oncol Rep. 2018. PMID: 29207165
-
Lung cancer stem cells as a target for therapy.Anticancer Agents Med Chem. 2010 Feb;10(2):164-71. doi: 10.2174/187152010790909308. Anticancer Agents Med Chem. 2010. PMID: 20184538 Review.
-
A translational approach to lung cancer research: From EGFRs to Wnt and cancer stem cells.Ann Thorac Cardiovasc Surg. 2009 Aug;15(4):213-20. Ann Thorac Cardiovasc Surg. 2009. PMID: 19763051 Free PMC article. Review.
Cited by
-
The Local Anesthetic Bupivacaine Inhibits the Progression of Non-Small Cell Lung Cancer by Inducing Autophagy Through Akt/mTOR Signaling.Front Oncol. 2021 Mar 11;11:616445. doi: 10.3389/fonc.2021.616445. eCollection 2021. Front Oncol. 2021. PMID: 33777755 Free PMC article.
-
VEGF/VEGFR-Targeted Therapy and Immunotherapy in Non-small Cell Lung Cancer: Targeting the Tumor Microenvironment.Int J Biol Sci. 2022 May 29;18(9):3845-3858. doi: 10.7150/ijbs.70958. eCollection 2022. Int J Biol Sci. 2022. PMID: 35813484 Free PMC article. Review.
-
MTTL3 upregulates microRNA-1246 to promote occurrence and progression of NSCLC via targeting paternally expressed gene 3.Mol Ther Nucleic Acids. 2021 Feb 24;24:542-553. doi: 10.1016/j.omtn.2021.02.020. eCollection 2021 Jun 4. Mol Ther Nucleic Acids. 2021. Retraction in: Mol Ther Nucleic Acids. 2022 Sep 21;30:48. doi: 10.1016/j.omtn.2022.09.004 PMID: 33898106 Free PMC article. Retracted.
-
Impact of Cancer Stem Cells and Cancer Stem Cell-Driven Drug Resiliency in Lung Tumor: Options in Sight.Cancers (Basel). 2022 Jan 6;14(2):267. doi: 10.3390/cancers14020267. Cancers (Basel). 2022. PMID: 35053430 Free PMC article. Review.
-
Emerging agents that target signaling pathways in cancer stem cells.J Hematol Oncol. 2020 May 26;13(1):60. doi: 10.1186/s13045-020-00901-6. J Hematol Oncol. 2020. PMID: 32456660 Free PMC article. Review.
References
-
- Siegel RL, Miller KD, Jemal A. Cancer statistics, 2017. CA Cancer J Clin 2017; 67: 7–30. - PubMed
-
- Bray F, Ferlay J, Soerjomataram I, et al. Global cancer statistics 2018: GLOBOCAN estimates of incidence and mortality worldwide for 36 cancers in 185 countries. CA Cancer J Clin 2018; 68: 394–424. - PubMed
-
- Doroshow DB, Herbst RS. Treatment of advanced non-small cell lung cancer in 2018. JAMA Oncol 2018; 4: 569–570. - PubMed
-
- Tilz GP, Becker H. Antigen-antibody complexes: physiology and pathology. Wien Med Wochenschr Suppl 1990; 107: 2–3. - PubMed
MeSH terms
Substances
LinkOut - more resources
Full Text Sources
Medical
Research Materials
