. 2019 Aug;3(8):1253-1264.
doi: 10.1038/s41559-019-0947-6. Epub 2019 Jul 29.

Natural selection contributed to immunological differences between hunter-gatherers and agriculturalists

Affiliations

Natural selection contributed to immunological differences between hunter-gatherers and agriculturalists

Genelle F Harrison et al. Nat Ecol Evol. 2019 Aug.

Abstract

The shift from a hunter-gatherer to an agricultural mode of subsistence is believed to have been associated with profound changes in the burden and diversity of pathogens across human populations. Yet, the extent to which the advent of agriculture affected the evolution of the human immune system remains unknown. Here we present a comparative study of variation in the transcriptional responses of peripheral blood mononuclear cells to bacterial and viral stimuli between Batwa rainforest hunter-gatherers and Bakiga agriculturalists from Uganda. We observed increased divergence between hunter-gatherers and agriculturalists in the early transcriptional response to viruses compared with that for bacterial stimuli. We demonstrate that a significant fraction of these transcriptional differences are under genetic control and we show that positive natural selection has helped to shape population differences in immune regulation. Across the set of genetic variants underlying inter-population immune-response differences, however, the signatures of positive selection were disproportionately observed in the rainforest hunter-gatherers. This result is counter to expectations on the basis of the popularized notion that shifts in pathogen exposure due to the advent of agriculture imposed radically heightened selective pressures in agriculturalist populations.


Conflict of interest statement

Competing interests: The authors declare no competing interests.

Figures

Fig. 1.
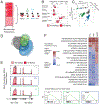
Fig. 1.. Transcriptional differences between Batwa hunter-gatherer and Bakiga agriculturalist populations.
(A) Schematics of the study design. The structure plot to the left shows the proportion of HG-ancestry (dark pink) and AG-ancestry (light pink) for each individual included in the study. Their placement along the Y-axis corresponds to how they self-identified. (B) Boxplots of the proportions of the main cell types found in PBMCs in the Batwa (dark pink) and the Bakiga (light pink). The upper and lower ends of the whiskers correspond to plus or minus 1.5 times the interquartile range, respectively. (C) Principal components analysis of gene-expression data. The first three PCs separate non-infected PBMCs from PBMCs stimulated with either LPS or GARD. (D) Venn diagram of PopDE genes detected in each condition. (E) Example of a PopDE gene (TCL1A) in which gene expression is higher in the AG population (light pink) than the HG population (dark pink) in all conditions. Expression is shown as the mean coverage per genomic position (corrected by total mapped reads) per individual in each population. F) GSEA for PopDE genes in all three conditions. The heatmaps show the enrichment scores for all pathways enriched at an FDR <5% in at least of the conditions. Positive and negative scores represent enrichments among genes that are more highly or lowly expressed in HG-Batwa than AG-Bakiga individuals, respectively. Example of an enrichment plot for genes involved in the interferon-α response pathway. Genes are ranked (left to right) from those with the strongest statistical evidence for up-regulation in the HG-Batwa vs. AG-Bakiga to those with the strongest statistical support for down-regulation in the HG-Batwa vs. AG-Bakiga.
Fig. 2.
Fig. 2.. Differences in immune response between HG and AG populations.
(A) Examples of two PopDR genes involved in immune response. The y axis shows the log2 fold changes in gene expression levels in response to LPS and GARD, for individuals from each of the two populations (x axis). The upper and lower ends of the whiskers correspond to plus or minus 1.5 times the interquartile range, respectively. (B) Venn diagram showing the number of PopDR genes identified in the LPS and GARD conditions. (C) Density plots showing the distributions of the absolute response to LPS and GARD of PopDR genes in each population. (D) A volcano plot showing an increase in seropositivity in the HG-Batwa population for 32 of the 130 viruses tested. Double stranded DNA-viruses showing a significant dependence to ancestry are marked in bold.
Fig. 3.
Fig. 3.. Analysis of the contribution of genetics to differences in immune response between the HG-Batwa and the AG-Bakiga.
(A) Schematic representation of the number of cis-eQTL shared across all conditions, or only found in non-infected PBMCs, or found in LPS and/or GARD stimulated PBMCs (stimulation-specific eQTL). Stimulation-specific eQTL were defined as those showing very strong evidence of eQTL in the stimulated cells (FDR < 0.05), and very limited evidence in the non-infected cells (FDR always higher than 0.25). (B) Example of two cis-eQTL. The top example, HLA-C, was found across all experimental condition (CTL-FDR = 0.0, LPS-FDR = 0.0, GARD-FDR = 0.0). The bottom example, Fibronectin Type III and SPRY Domain Containing 1 Like (FSD1L) was detected exclusively in the LPS condition. In this example expression is in log2(counts per million) (CTL-FDR = 0.426, LPS-FDR = 9.09−5, GARD-FDR = 0.429). The upper and lower ends of the boxplot whiskers correspond to plus or minus 1.5 times the interquartile range, respectively. (C) Bar graphs showing an enrichment of genes containing cis-eQTLs among PopDE/PopDR genes (totality of bars) per compared to genome wide expectations (stripes). (D) Manhattan plot showing ΔPVE of cis-eQTL (normalized as -log10(1-ΔPVE for easier viewing) on the Y-axis across all chromosomes for CTL (gray), GARD (blue), and LPS (green). Colored points have an FDR < 0.1 and a delta-PVE > 0.75. Points are labeled with the corresponding gene name when the PVE is > 0.99.
Fig. 4.
Fig. 4.. Evidence of selection driving population differences in immune response.
(A) This density plot shows the distribution of the percent of SNPs with extreme values of FST (e.g. in the 95th percentile) for a set of randomly sampled cis-SNPs equally-sized sets of SNPs matched for allele frequencies with high-ΔPVE SNPs. 10,000 iterations were run to obtain the distribution for each condition. The red point on each graph shows the percentage of high-ΔPVE SNPs in the 95th percentile. High-ΔPVE variants in all conditions had significantly more SNPs in the 95th Percentile (FST comparison Chi-Squared Statistic; CTL P. value = 2.2−16, LPSP. value = 2.2−16, GARD P. value = 2.2−16). (B) A tree diagram illustrating the mean values of the population branch statistic for the HG-Batwa, AG-Bakiga, and a cohort from Great Britain as an outgroup. This figure illustrates a greater mean PBS score in the HG-Batwa population among high-ΔPVE variants. (C) The distribution of the ratio of mean PBS in the HG-Batwa to the AG-Bakiga for a set of randomly sampled cis-SNPs equally-sized sets of SNPs matched for allele frequencies with high-ΔPVE SNPs. 100,000 iterations were run to obtain the distribution and to calculate the P. value. The red point shows the ratio of mean PBS values represented as the branch lengths in the tree graph. (D) A bar graph illustrating the percentage of high-ΔPVE SNPs that have an iHS value in the 95th percentile compared to a background of all top cis-SNPs. For iHS, only values in the GARD-stimulated cells in the HG-Batwa population had significantly more SNPs in the 95th percentile (HG-Batwa iHS comparison Chi-Squared Statistic; CTL P. value = 0.446, LPS P. value = 0.080, GARD P. value = 0.002; AG-Bakiga iHS comparison Chi-Squared Statistic; CTL P. value = 0.586, LPS P. value = 0.929, GARD P. value = 0.210). (E) PBS values for selection between populations graphed against absolute iHS values showing selection within each. population for high-ΔPVE variants. Pink (AG-Bakiga) and Red (AG-Batwa) dots represent high-ΔPVE SNPs in the 95th percentile of both PBS and iHS. Among this group points are labeled with the corresponding gene name.

Similar articles

Cited by

  • Local genetic adaptation to habitat in wild chimpanzees.
    Ostridge HJ, Fontsere C, Lizano E, Soto DC, Schmidt JM, Saxena V, Alvarez-Estape M, Barratt CD, Gratton P, Bocksberger G, Lester JD, Dieguez P, Agbor A, Angedakin S, Assumang AK, Bailey E, Barubiyo D, Bessone M, Brazzola G, Chancellor R, Cohen H, Coupland C, Danquah E, Deschner T, Dotras L, Dupain J, Egbe VE, Granjon AC, Head J, Hedwig D, Hermans V, Hernandez-Aguilar RA, Jeffery KJ, Jones S, Junker J, Kadam P, Kaiser M, Kalan AK, Kambere M, Kienast I, Kujirakwinja D, Langergraber KE, Lapuente J, Larson B, Laudisoit A, Lee KC, Llana M, Maretti G, Martín R, Meier A, Morgan D, Neil E, Nicholl S, Nixon S, Normand E, Orbell C, Ormsby LJ, Orume R, Pacheco L, Preece J, Regnaut S, Robbins MM, Rundus A, Sanz C, Sciaky L, Sommer V, Stewart FA, Tagg N, Tédonzong LR, van Schijndel J, Vendras E, Wessling EG, Willie J, Wittig RM, Yuh YG, Yurkiw K, Vigilant L, Piel A, Boesch C, Kühl HS, Dennis MY, Marques-Bonet T, Arandjelovic M, Andrés AM. Ostridge HJ, et al. bioRxiv [Preprint]. 2024 Jul 9:2024.07.09.601734. doi: 10.1101/2024.07.09.601734. bioRxiv. 2024. PMID: 39026872 Free PMC article. Preprint.
  • DISSECT: deep semi-supervised consistency regularization for accurate cell type fraction and gene expression estimation.
    Khatri R, Machart P, Bonn S. Khatri R, et al. Genome Biol. 2024 Apr 30;25(1):112. doi: 10.1186/s13059-024-03251-5. Genome Biol. 2024. PMID: 38689377 Free PMC article.
  • Investigating the Influence of ANTXR2 Gene Mutations on Protective Antigen Binding for Heightened Anthrax Resistance.
    Archana CA, Sekar YS, Suresh KP, Subramaniam S, Sagar N, Rani S, Anandakumar J, Pandey RK, Barman NN, Patil SS. Archana CA, et al. Genes (Basel). 2024 Mar 28;15(4):426. doi: 10.3390/genes15040426. Genes (Basel). 2024. PMID: 38674361 Free PMC article.
  • Epigenetic variation impacts individual differences in the transcriptional response to influenza infection.
    Aracena KA, Lin YL, Luo K, Pacis A, Gona S, Mu Z, Yotova V, Sindeaux R, Pramatarova A, Simon MM, Chen X, Groza C, Lougheed D, Gregoire R, Brownlee D, Boye C, Pique-Regi R, Li Y, He X, Bujold D, Pastinen T, Bourque G, Barreiro LB. Aracena KA, et al. Nat Genet. 2024 Mar;56(3):408-419. doi: 10.1038/s41588-024-01668-z. Epub 2024 Feb 29. Nat Genet. 2024. PMID: 38424460
  • DNA methylation-environment interactions in the human genome.
    Johnston RA, Aracena KA, Barreiro LB, Lea AJ, Tung J. Johnston RA, et al. Elife. 2024 Feb 26;12:RP89371. doi: 10.7554/eLife.89371. Elife. 2024. PMID: 38407202 Free PMC article.

References

    1. Diamond J & Bellwood P Farmers and their languages: the first expansions. Science 300, 597–603 (2003). - PubMed
    1. Greger M The human/animal interface: emergence and resurgence of zoonotic infectious diseases. Critical reviews in microbiology 33, 243–299 (2007). - PubMed
    1. Pearce-Duvet JM The origin of human pathogens: evaluating the role of agriculture and domestic animals in the evolution of human disease. Biol Rev Camb Philos Soc 81, 369–382, doi:10.1017/S1464793106007020 (2006). - DOI - PubMed
    1. Wolfe ND, Dunavan CP & Diamond J Origins of major human infectious diseases. Nature 447, 279–283, doi:10.1038/nature05775 (2007). - DOI - PMC - PubMed
    1. Gignoux CR, Henn BM & Mountain JL Rapid, global demographic expansions after the origins of agriculture. Proceedings of the National Academy of Sciences 108, 6044–6049 (2011). - PMC - PubMed

Publication types