. 2019 Jul 19;10(1):3236.
doi: 10.1038/s41467-019-11137-5.

Molecular retargeting of antibodies converts immune defense against oncolytic viruses into cancer immunotherapy

Affiliations

Molecular retargeting of antibodies converts immune defense against oncolytic viruses into cancer immunotherapy

Julia Niemann et al. Nat Commun. .

Abstract

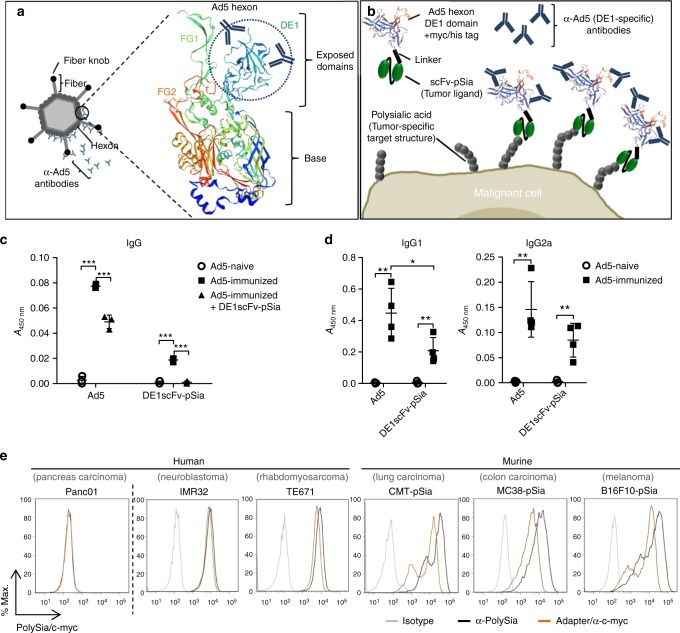
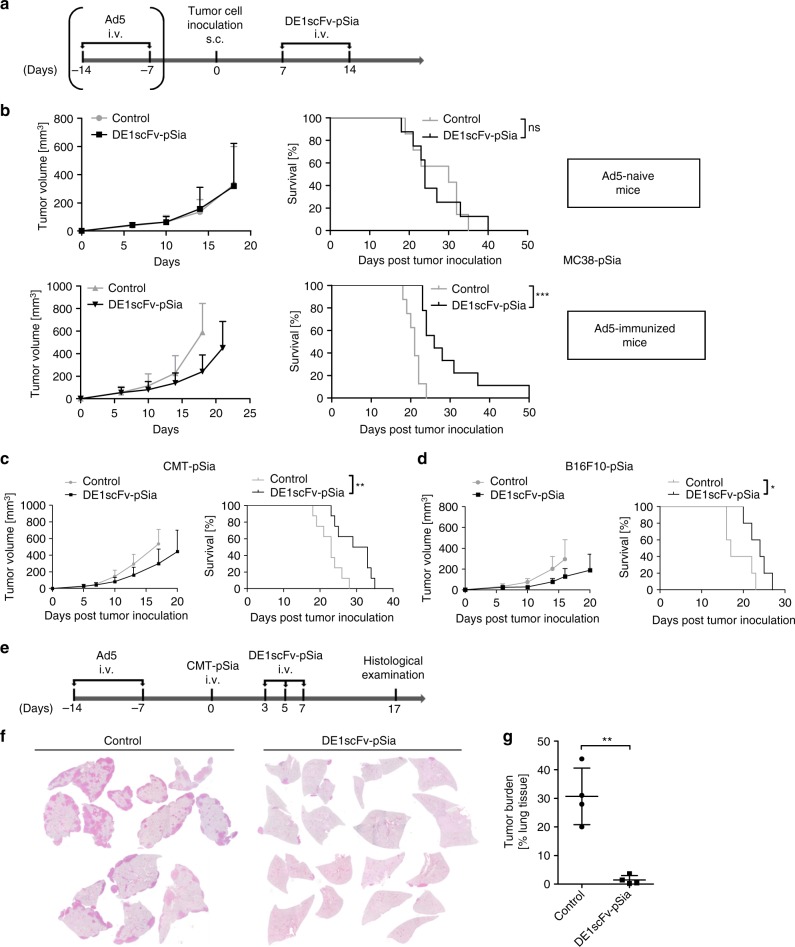
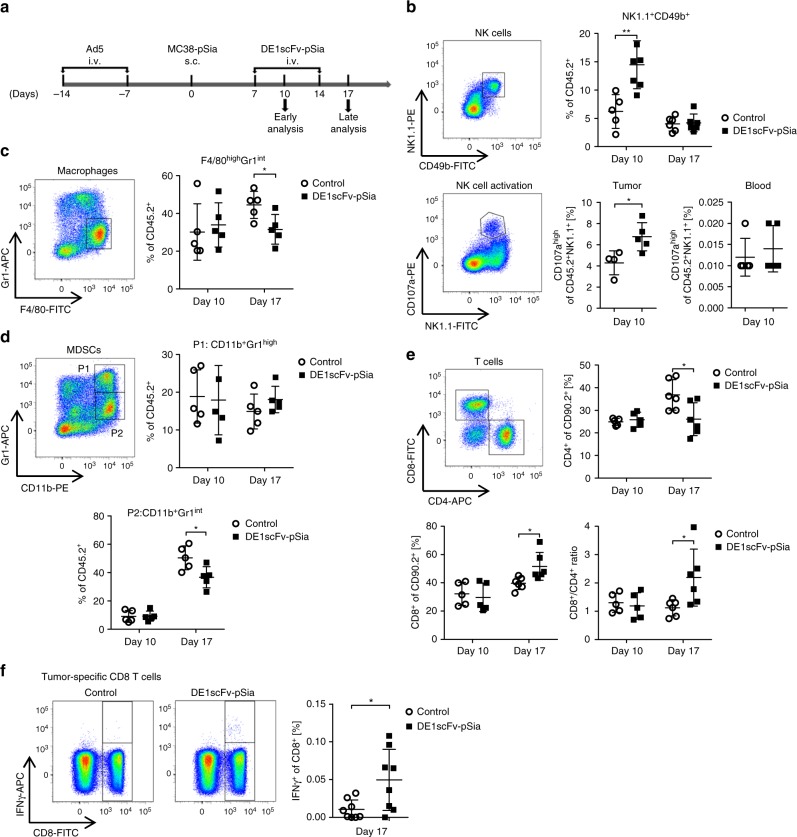
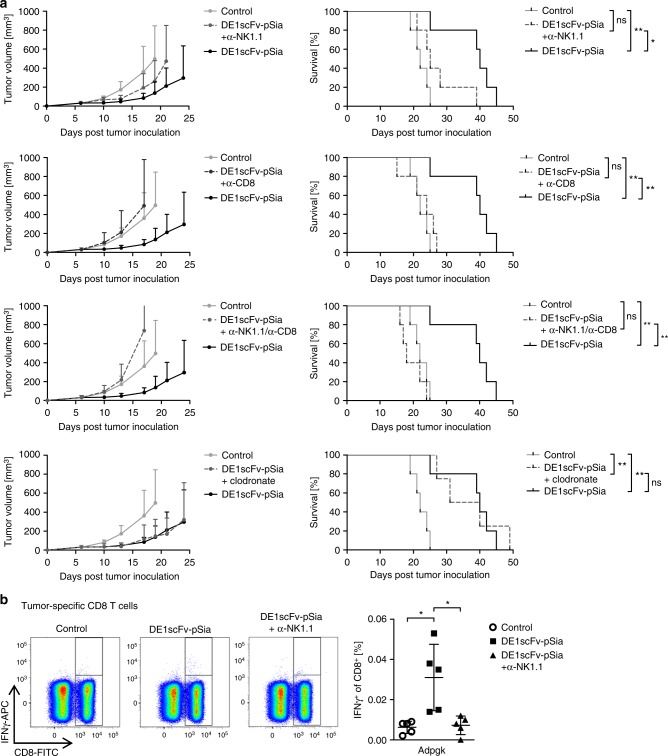
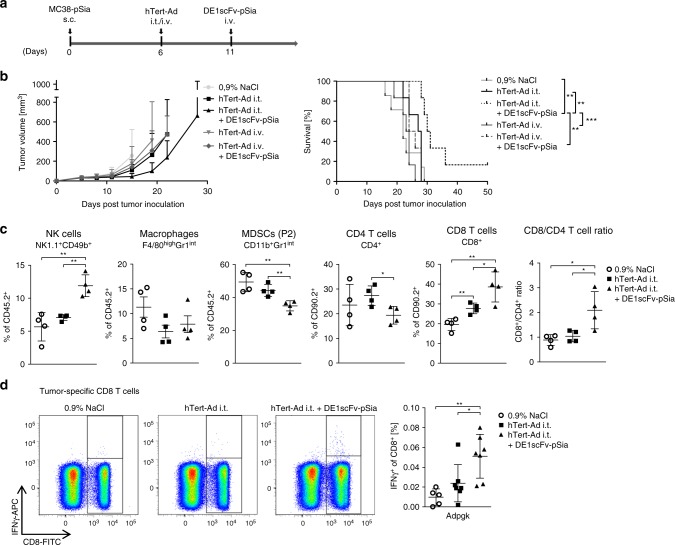
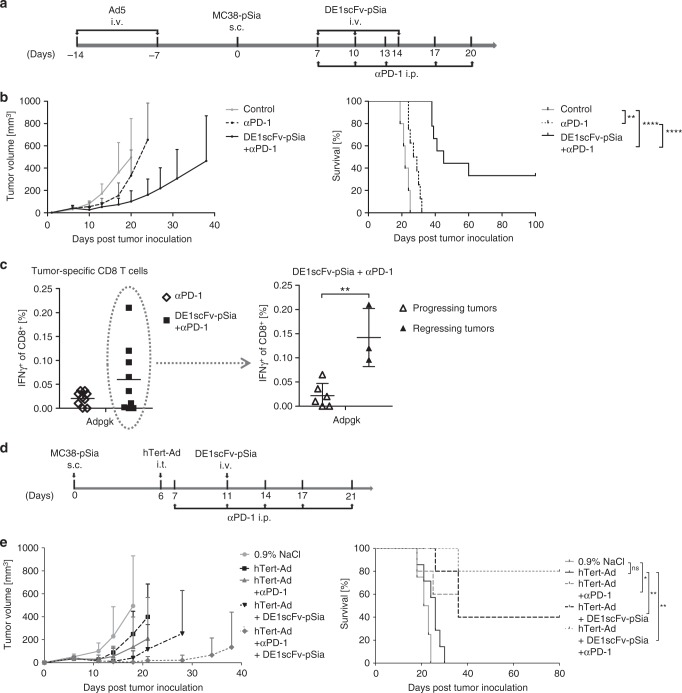
Virus-neutralizing antibodies are a severe obstacle in oncolytic virotherapy. Here, we present a strategy to convert this unfavorable immune response into an anticancer immunotherapy via molecular retargeting. Application of a bifunctional adapter harboring a tumor-specific ligand and the adenovirus hexon domain DE1 for engaging antiadenoviral antibodies, attenuates tumor growth and prolongs survival in adenovirus-immunized mice. The therapeutic benefit achieved by tumor retargeting of antiviral antibodies is largely due to NK cell-mediated triggering of tumor-directed CD8 T-cells. We further demonstrate that antibody-retargeting (Ab-retargeting) is a feasible method to sensitize tumors to PD-1 immune checkpoint blockade. In therapeutic settings, Ab-retargeting greatly improves the outcome of intratumor application of an oncolytic adenovirus and facilitates long-term survival in treated animals when combined with PD-1 checkpoint inhibition. Tumor-directed retargeting of preexisting or virotherapy-induced antiviral antibodies therefore represents a promising strategy to fully exploit the immunotherapeutic potential of oncolytic virotherapy and checkpoint inhibition.


Conflict of interest statement

The authors declare no competing interests.

Figures

Fig. 1
Fig. 1
Design of the bifunctional adapter DE1scFv-pSia for tumor retargeting of antiadenoviral antibodies. a Illustration of the adenovirus capsid protein hexon generated by ExPASy software using the SWISS-Model tool, showing the exposed domains DE1, FG1 and FG2. The domain DE1 is highlighted by a dotted circle b The structure of the adapter molecule DE1scFv-pSia containing the DE1 domain (DE1) provided with a myc/his tag which was linked to an anti-PolySia scFv fragment via a glycine/serine stretch (Linker). c ELISA showing the recognition of purified, immobilized DE1scFv-pSia by IgG in serum of Ad5-naive, or in serum of Ad5-immunized mice pretreated with or without soluble DE1scFv-pSia as competitor (group: Ad5+ + DE1scFv-pSia) to inactivate DE1-specific IgG (n = 3). d Recognition of immobilized DE1scFv-pSia or Ad5-particles by IgG1 and IgG2a in serum of Ad5-naive (n = 3) and Ad5-immunized (Ad5+; n = 4) mice was measured by ELISA. e Binding of DE1scFv-pSia to the polySia-positive human cancer cell lines IMR32 and TE671 and the murine polySia-expressing cancer cells CMT-pSia, MC38-pSia, and B16F10-pSia was measured via flow cytometry. polySia-negative human Panc01 cells were used as negative control. Binding of DE1scFv-pSia to the cell surface was detected using an anti-myc-tag antibody. PolySia expression on the cell surface was measured using the specific antibody mAb735. Two-tailed unpaired t test was used to calculate statistics in c and d: *p ≤ 0.05; **p ≤ 0.01; ***p ≤ 0.001. Error bars refer to standard deviation (SD). Source data are provided as a source data file
Fig. 2
Fig. 2
Ab-retargeting inhibits the growth of subcutaneous and disseminated tumors in Ad5-vaccinated mice. a Illustration showing the experimental time course of tumor establishement in Ad5-immunized or Ad5-naive mice by s.c. injection of PolySia-expressing tumor cells (MC38-pSia, ‚CMT-pSia, or B16F10-pSia as indicated in the Fig. 2b–d) and subsequent treatments with purified DE1scFv-pSia, or saline, respectively. b MC38-pSia tumors were established in Ad5-naive mice (upper panel) or Ad5-immunized mice (lower panel), and treated with DE1scFv-pSia or saline (control). Tumor development (left panel) and survival (right panel) were monitored. Group size: Ad5-naive control, n = 7; Ad5-naive DE1scFv-pSia treated, n = 8; Ad5-immunized control, n = 8; Ad5-immunized DE1scFv-pSia treated, n = 9. Median survival (ms) in days for Ad5-naive control: 30; Ad5-naive DE1scFv-pSia treated: 24; Ad5-immunized control: 21; Ad5-immunized DE1scFv-pSia treated: 26. c Tumor development (left panel) and survival (right panel) were monitored in Ad5-immunized mice bearing CMT-pSia tumors. Group size: n = 8; ms control: 23; ms DE1scFv-pSia: 31. d Tumor development (left panel) and survival (right panel) were monitored in Ad5-immunized mice B16F10-pSia tumor-bearing mice. Group size: n = 5; ms control: 17; ms DE1scFv-pSia: 24. e According to the shown treatment scheme, Ad5-immunized mice were injected i.v. with the lung adenocarcinoma cell line CMT-pSia to establish lung colonies. Mice were then treated i.v. with purified DE1scFv-pSia at the indicated time points or received saline as control. f Representative H/E-stained lung sections of control and DE1scFv-pSia treated individuals at endpoint examination (day 17). g Tumor burden in the lung was calculated based on microscopic investigations of H/E-stained lung sections (n = 4). Log-rank (Mantel–Cox) test was used to calculate survival in b, c, and d and two-tailed unpaired t test was used to calculate statistics in g: *p ≤ 0.05; **p ≤ 0.01, ***p ≤ 0.001. Error bars refer to standard deviation (SD). Source data are provided as a source data file
Fig. 3
Fig. 3
Ab-retargeting reduces intratumor myeloid cells and supports NK cell and CD8 T-cell infiltration. a MC38-pSia cells were used to establish s.c. tumors in Ad5-vaccinated mice. Tumor-bearing mice received i.v. injections of DE1scFv-pSia or saline, and were sacrificed according to the shown schedule. Tumor tissue was examined for infiltration of different leukocyte subsets via flow cytometry. b Frequencies of NK cells (NK1.1+CD49b+) were calculated as percentage of CD45.2+ leukocytes. NK cell activation was determined by surface expression of CD107a. Macrophages (Gr1+F4/80high) and different fractions of myeloid-derived suppressor cells (MDSCs; P1: CD11b+ Gr1high; P2: CD11b+ Gr1int) are shown in c and d, respectively. Group size was in general n = 5 with following exceptions: n = 7 (NK cells/day 10/DE1scFv-pSia); n = 6 (NK cells/day 17/control and DE1scFv-pSia groups); n = 4 (CD107ahigh – NK cells/control). e Frequencies of CD4+ and CD8+ T cells were measured as percentage of CD90.2-positive lymphocytes, and individual ratios of CD8 to CD4 T cells were calculated. Group size: n = 5 (day 10) and n = 6 (day 17). f Splenocytes were prepared from sacrificed mice, incubated with the mutated MC38 peptide Adpgk-R304M (ASMTNMELM), or an irrelevant control peptide, and responding neoantigen-reactive CD8 T cells were identified by intracellular staining for IFNγ (group size: n = 8). Two-tailed unpaired t test was used to calculate statistics: *p ≤ 0.05; **p ≤ 0.01. Error bars refer to standard deviation (SD). Source data are provided as a source data file
Fig. 4
Fig. 4
The therapeutic effect of Ab-retargeting is mediated by NK cell-dependent triggering of CD8 T cells. a According to the procedure illustrated in Fig. 2a, subcutaneous MC38-pSia tumors were established in Ad5-vaccinated mice and treated with i.v. injections of DE1scFv-pSia or saline. In addition, the influence of NK cells, CD8 T cells, and macrophages on treatment success was studied by depletion of the indicated immune cell subsets starting 2 days before first adapter treatment using depleting antibodies α-NK1.1 and α-CD8 for depletions of NK cells and CD8 T cells, respectively, or clodronate liposomes for depletion of macrophages. Tumor development (left) and survival (right) were monitored. Group size n = 5 for all groups, except for the macrophage depleted group (DE1scFv-pSia + clodronate; n = 4); the same control and DE1scFv-pSia group without depletion agent is shown in each plot. b On day 17 after tumor inoculation, splenocytes of control and adapter-treated groups with or without NK cell depletion were prepared and examined for Adpgk-R304M-reactive tumor-specific CD8 T cells (n = 5 per group) by incubation with the corresponding peptide ASMTNMELM as described in Fig. 3f. Log-rank (Mantel–Cox) test was used to calculate survival statistics in a. Two-tailed unpaired t test was used to calculate statistics in b. *p ≤ 0.05; **p ≤ 0.01. Error bars refer to standard deviation (SD). Source data are provided as a source data file
Fig. 5
Fig. 5
Ab-retargeting after intratumor application of an oncolytic adenovirus leads to improved survival. a Subcutaneous MC38-pSia tumors were established in Ad5-naive mice. After tumor formation, animals received a single application of the oncolytic adenovirus hTert-Ad (by either intratumor or intravenous application) followed by a single i.v. administration of DE1scFv-pSia as shown in the treatment scheme. Control animals were treated by i.t. injection of saline. b Tumor development and survival were monitored (group size n = 6, except control group 0.9 % NaCl: n = 7, median survival: 0.9% NaCl 22 days; hTert-Ad i.v. 23.5 days; hTert-Ad i.t. 27.5 days; hTert-Ad i.v. + DE1scFv-pSia 25 days; hTert-Ad i.t. + DE1scFv-pSia 30.5 days). c Tumor-infiltrating immune cells were analyzed on day 8 after start of i.t. virotherapy (n = 4 in all groups). Proportions of NK cells, macrophages, and MDCSs were calculated as percentage of CD45.2-positive tumor-infiltrating leukocytes. CD8 and CD4 T-cell frequencies were calculated as percentage of CD90.2-positive lymphocytes. d Analyses of tumor antigen-specific CD8 T cells in splenocytes 13 days after i.t. virotherapy (0.9% NaCl: n = 5; hTert-Ad: n = 7; hTert-Ad + DE1scFv-pSia: n = 7). To determine neoantigen-specific responses against Adpgk-R304M, splenocytes were stimulated with the peptide ASMTNMELM, or an irrelevant control peptide, and were analyzed by intracellular staining of IFNγ and flow cytometry. Log-rank (Mantel–Cox) test was used to calculate survival statistics in b. Two-tailed unpaired t test was used to calculate statistics in c and d. *p ≤ 0.05; **p ≤ 0.01; ***p ≤ 0.001. Error bars refer to standard deviation (SD). Source data are provided as a source data file
Fig. 6
Fig. 6
Ab-retargeting sensitizes tumors for PD-1 checkpoint inhibition facilitating long-term survival. a Subcutaneous MC38-pSia tumors were established in Ad5-vaccinated mice. Seven days after tumor cell injection, animals were treated with an antagonistic antibody against PD-1 as monotherapy (αPD-1) or in combination with DE1scFv-pSia antibody retargeting (DE1scFv-pSia + αPD-1) or remained untreated (control). b Tumor development and survival (group size: αPD-1: n = 8, ms: 28 days; DE1scFv-pSia + αPD-1: n = 9, ms: 45 days, control: n = 5, ms: 22 days) was monitored. c Blood samples were drawn during treatment on day 13 after start of treatment, and splenocytes were stimulated with the peptide ASMTNMELM to detect CD8 T-cell responses against the Adpgk-R304M neoepitope. Responsiveness of CD8 T cells to peptide stimulation was measured via intracellular IFNγ-staining and flow cytometry. Left panel: αPD-1 vs. DE1scFv-pSia + αPD-1 (n = 9 per group). Right panel: individuals of the DE1scFv-pSia + αPD-1 treatment group were split in those showing tumor progression (n = 6) and tumor-free animals: (n = 3). d Subcutaneous MC38-pSia tumors were established in Ad5-naive mice. Tumor-bearing mice were treated by i.t. application of hTert-Ad as monotherapy with or without i.p. PD-1 immune checkpoint inhibition, and/or antibody-retargeting according to the treatment scheme. e The left panel shows the results of tumor growth monitoring and the right panel survival data (group size n = 5, except the groups 0.9 % NaCl: n = 4 and hTert-Ad: n = 7; median survival: 0.9% NaCl ms = 22; hTert-Ad: ms = 26; hTert-Ad + αPD-1: ms = 36; hTert-Ad + DE1scFv-pSia: ms = 36; hTert-Ad + αPD-1 + DE1scFv-pSia ms = undefined). Log-rank (Mantel–Cox) test was used for survival statistics in b and d. Two-tailed unpaired t test was used for statistics in c. *p ≤ 0.05; **p ≤ 0.01; ****p ≤ 0.0001. Error bars refer to standard deviation (SD). Source data are provided as a source data file

Similar articles

Cited by

References

    1. Russell SJ, Peng KW, Bell JC. Oncolytic virotherapy. Nat. Biotechnol. 2012;30:658–670. doi: 10.1038/nbt.2287. - DOI - PMC - PubMed
    1. Benencia F, Courreges MC, Fraser NW, Coukos G. Herpes virus oncolytic therapy reverses tumor immune dysfunction and facilitates tumor antigen presentation. Cancer Biol. Ther. 2008;7:1194–1205. doi: 10.4161/cbt.7.8.6216. - DOI - PubMed
    1. Errington F, et al. Inflammatory tumour cell killing by oncolytic reovirus for the treatment of melanoma. Gene Ther. 2008;15:1257–1270. doi: 10.1038/gt.2008.58. - DOI - PMC - PubMed
    1. Breitbach CJ, et al. Targeted inflammation during oncolytic virus therapy severely compromises tumor blood flow. Mol. Ther. 2007;15:1686–1693. doi: 10.1038/sj.mt.6300215. - DOI - PubMed
    1. Senzer NN, et al. Phase II clinical trial of a granulocyte-macrophage colony-stimulating factor-encoding, second-generation oncolytic herpesvirus in patients with unresectable metastatic melanoma. J. Clin. Oncol. 2009;27:5763–5771. doi: 10.1200/JCO.2009.24.3675. - DOI - PubMed

Publication types