. 2019 Jul 4:8:e45777.
doi: 10.7554/eLife.45777.

The autophagic membrane tether ATG2A transfers lipids between membranes

Affiliations

The autophagic membrane tether ATG2A transfers lipids between membranes

Shintaro Maeda et al. Elife. .

Abstract

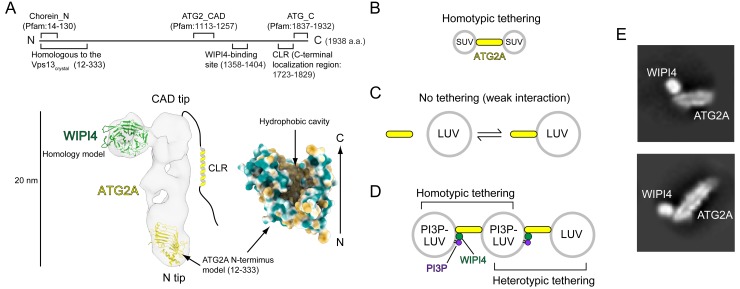
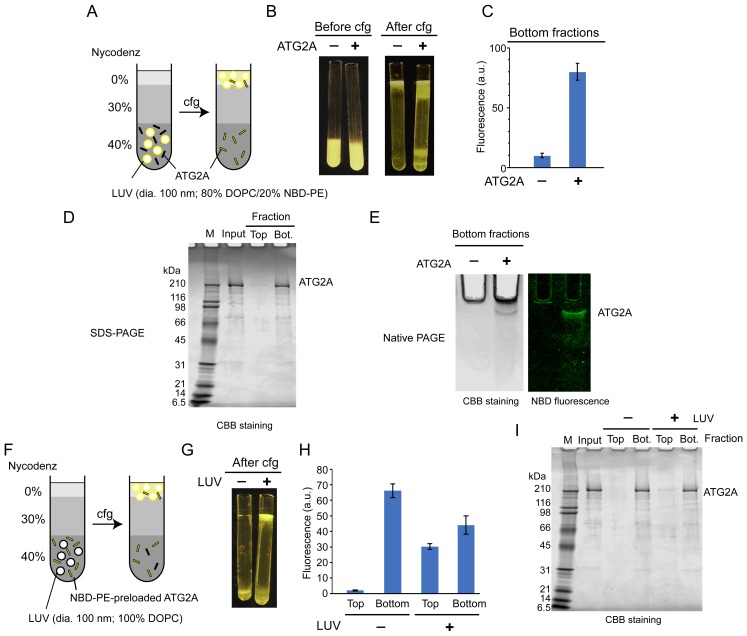
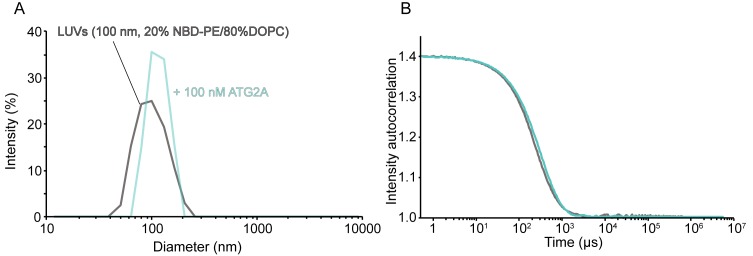
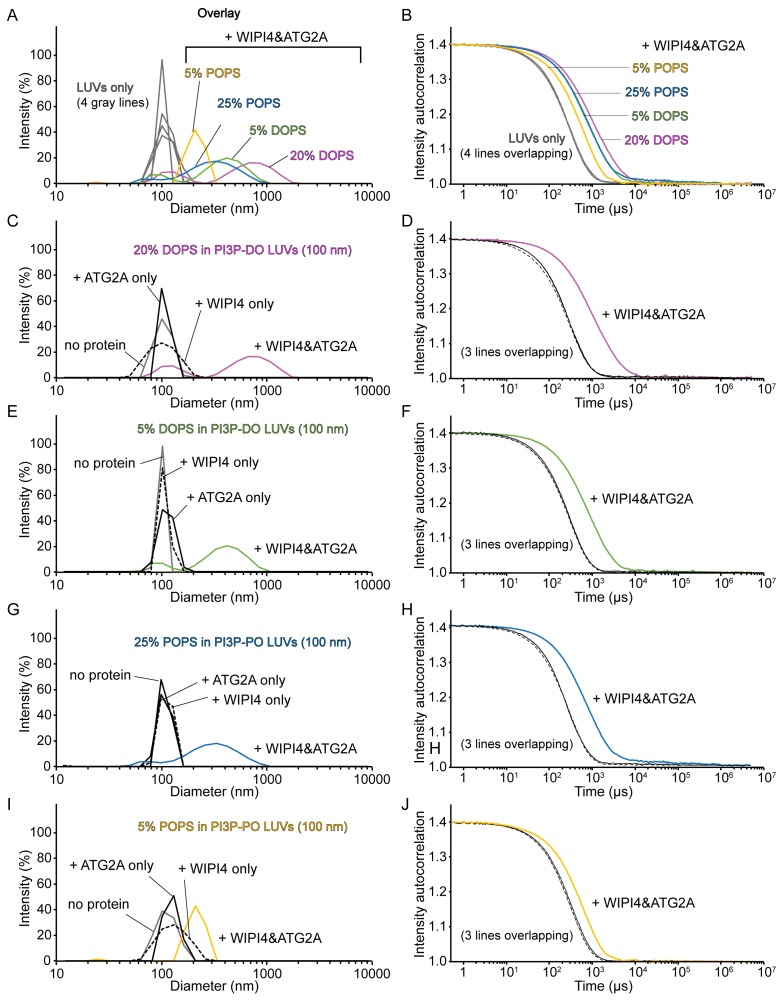
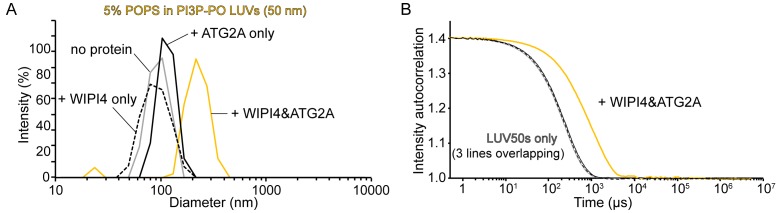
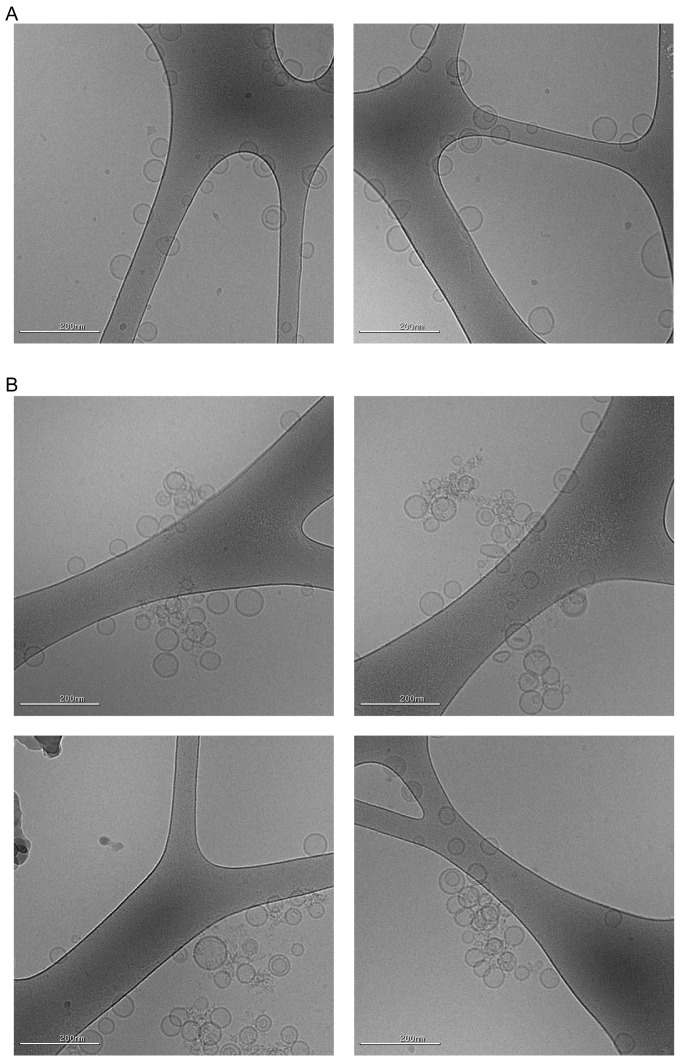
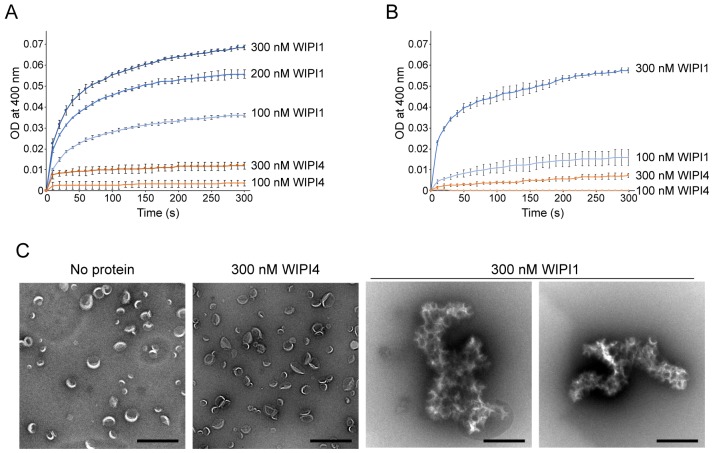
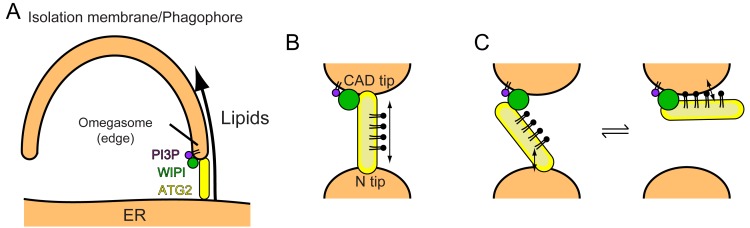
An enigmatic step in de novo formation of the autophagosome membrane compartment is the expansion of the precursor membrane phagophore, which requires the acquisition of lipids to serve as building blocks. Autophagy-related 2 (ATG2), the rod-shaped protein that tethers phosphatidylinositol 3-phosphate (PI3P)-enriched phagophores to the endoplasmic reticulum (ER), is suggested to be essential for phagophore expansion, but the underlying mechanism remains unclear. Here, we demonstrate that human ATG2A is a lipid transfer protein. ATG2A can extract lipids from membrane vesicles and unload them to other vesicles. Lipid transfer by ATG2A is more efficient between tethered vesicles than between untethered vesicles. The PI3P effectors WIPI4 and WIPI1 associate ATG2A stably to PI3P-containing vesicles, thereby facilitating ATG2A-mediated tethering and lipid transfer between PI3P-containing vesicles and PI3P-free vesicles. Based on these results, we propose that ATG2-mediated transfer of lipids from the ER to the phagophore enables phagophore expansion.

Keywords: biochemistry; cell biology; chemical biology; human; isolation membrane; lipid transfer; membrane expansion; membrane tethering; organelle biogenesis; phagophore expansion.


Conflict of interest statement

SM, CO, TO No competing interests declared

Figures

Figure 1.
Figure 1.. Structural and biochemical properties of the ATG2A-WIPI4 complex.
(A) Summary of previous structural characterizations of the ATG2A-WIPI4 complex. The conserved and functional regions of ATG2A are indicated on the line-represented primary structure (top). The negative stain EM map (EMD-8899) of the ATG2A-WIPI4 complex is shown with docked homology models of WIPI4 and the ATG2A N-terminus as well as additional information regarding the C-terminal regions. The homology models were obtained from the I-TASSER server (Roy et al., 2010), and the molecular model was generated using ChimeraX (Goddard et al., 2018). The surface representation of the ATG2A N-terminus model is colored according to the hydrophobicity potential calculated in ChimeraX. Hydrophobic and hydrophilic residues are shown in khaki and turquoise, respectively. (B–D) Summary of the membrane binding/tethering properties of ATG2A and the ATG2A-WIPI4 complex reported previously (Chowdhury et al., 2018). (B) ATG2A binds tightly to and tethers SUVs. (C) ATG2A associates weakly with and does not tether LUVs. (D) The ATG2A-WIPI4 complex can tether PI3P-containing LUVs and tether a PI3P-containing LUV to a PI3P-free LUV. Note that the tethering events shown in (B) and (D) lead to vesicle clustering in test tubes, but, for clarity, only one pair of tethered vesicles for each tethering pattern is shown. (E) Cryo-EM 2D class averages of the ATG2A-WIPI4 complex.
Figure 1—figure supplement 1.
Figure 1—figure supplement 1.. Representative cryo-EM image of the ATG2A-WIPI4 complex.
Figure 2.
Figure 2.. ATG2A extracts fluorescent lipids from membranes and unloads the lipids onto membranes.
(A–E) NBD-PE extraction assay. (A) Diagram of the assay based on density (Nycodenz) gradient centrifugation. LUVs were prepared by extrusion through a 100 nm filter. (B) Pre and postcentrifugation fluorescence images of the centrifuge tubes with and without ATG2A. (C) Quantification of the fluorescence signal in the bottom fractions of the tubes shown in (B). (D) SDS-PAGE (4–20% acrylamide gradient gel) with Coomassie blue (CBB) staining of the bottom fractions in (B). (E) Native PAGE (4–10% acrylamide gel) of the bottom fractions in (B). The nonionic detergent decyl maltoside (0.2%) was added to the samples to prevent protein aggregation in the wells of the gel. CBB staining (top) and fluorescence (bottom) images are shown. (F–I) NBD-PE unloading assay. (F) Diagram of the assay. NBD-PE-preloaded ATG2A obtained from the bottom fraction in (B) was mixed with nonfluorescent LUVs (100 nm, 100% DOPC) and subjected to density gradient centrifugation. (G) A postcentrifugation fluorescence image of the centrifuge tubes with and without LUVs. (H) Fluorescence signal in the fractions in (G). (I) SDS-PAGE (4–20% acrylamide gradient gel) with CBB staining of the fractions in (G). Experiments were repeated three times. The fluorescence data in (C) and (H) and are shown as the average of the three repeats with the SD.
Figure 2—figure supplement 1.
Figure 2—figure supplement 1.. Lipid extraction by ATG2A does not affect the size of the substrate liposomes.
DLS size distribution (A) and normalized autocorrelation profiles (B) of the LUVs (the lipid concentration; 60 µM, the lipid composition; 20% NBD-PE and 80% DOPC) used for extraction assay with or without 100 nM ATG2A.
Figure 2—figure supplement 2.
Figure 2—figure supplement 2.. Lipid extraction by ATG2A does not deform LUVs, and no liposomes remain in the bottom fraction after liposome flotation centrifugation.
(A–D) Negative stain EM image of the bottom fraction of the extraction assay in the absence (A, B) or the presence of ATG2A (C, D) before the centrifugation (after 1hr-incubation) (A, C) or after the centrifugation (B, D). Note that 1) the liposomes incubated for 1 hr with ATG2A (C) and those without the protein (A) appear similar; 2) most proteins are not bound to the LUVs (C); 3) no liposomes were detected in the bottom fractions after centrifugation (B, D). Scale bar: 100 nm.
Figure 3.
Figure 3.. ATG2A transfers lipids between SUVs.
(A) Diagram of the NBD fluorescence-based lipid transfer assay with ATG2A and SUVs. NBD fluorescence increases upon dilution of NBD, which is interpreted as the transfer of NBD-PE from the donor to the acceptor. Addition of dithionite would cause the loss of NBD fluorescence from the outer leaflets of liposomes (Meers et al., 2000). If the donor and the acceptor vesicles fuse, NBD-PE on the inner leaflet is diluted, thereby contributing to the signal increase. Hence, dithionite treatment increases the fluorescence of a membrane-fused sample to a higher level than that of a nonfused sample. (B) Lipid transfer assay with 50 nM ATG2A and 25 µM (lipid concentration) each of the donor SUVs (46% DOPC, 25% DOPE, 25% DOPS, 2% NBD-PE, and 2% Rh-PE) and the acceptor SUVs (50% DOPC, 25% DOPE, and 25% DOPS). SUVs were prepared by sonication, and the experiments were performed at 30 °C. Each data point is presented as the average of the three independent experiments and shown with the SD. Sodium dithionite was added at the time indicated by the arrow. (C) Titration of the ATG2A protein in a lipid transfer assay with the same donor and acceptor vesicles as in (B). The experiments were performed at 25 °C and repeated three times. A representative data set is shown. The concentrations of ATG2A are indicated. NBD fluorescence was normalized to the maximum NBD fluorescence, which was measured upon the addition of 0.1% Triton X-100 at the end of each experiment, and converted to the concentration of the transferred NBD-PE as reported previously (Kawano et al., 2018). (D) Plot of the initial NBD-PE transfer rate versus the concentration of ATG2A of the data shown in (C). The SD of each time point was obtained from three repeats. (E) Lipid transfer assay with 25 nM ATG2A and 25 µM donor SUVs containing 0, 5, 10, or 25% POPS (the other lipid components: 25% POPE, 2% NBD-PE, 2% Rh-PE, and 71, 66, 61, or 46% POPC, respectively) and 25 µM acceptor SUVs containing the same amount of POPS as the donor (the lipid compositions: 25% POPE, 0, 5, 10, or 25% POPS, and 75, 70, 65, or 50% POPC, respectively) (n = 3). The percentage of POPC of each liposome was calculated as 100% minus the fractions of all the other lipids. (F) The same experiment as (E), except that POPS was replaced by bovine liver PI (n = 3). (G–J) The same set of experiments (G, I, and J) and analyses (H) on ATG2A12×D as shown in (C–F).
Figure 3—figure supplement 1.
Figure 3—figure supplement 1.. ATG2A clusters SUVs composed of PO lipids.
DLS size distribution profiles (A) and normalized autocorrelation profiles (B) of the PO lipids-based SUVs (60 µM lipid concentration) in the absence or presence of 100 nM ATG2A. SUVs were composed of 25% POPE, 0, 5, 10, or 25% POPS, and 75, 70, 65, or 50% POPC, respectively (the sum of the POPS and POPC percentages is 75%). The samples were incubated for 20 min at 25 °C before DLS measurements.
Figure 4.
Figure 4.. WIPI4 and WIPI1 facilitate ATG2A-mediated lipid transfer.
(A) Diagram of the lipid transfer assay with PI3P-containing donor LUVs (extruded through a 100 nm filter, the lipid compositions; 5% PI3P, 46% DOPC, 25% DOPE, 20% DOPS, 2% NBD-PE, and 2% Rh-PE) and PI3P-free acceptor LUVs (extruded through a 100 nm filter, the lipid composition; 50% DOPC, 25% DOPE, and 25% DOPS). (B) Titration of WIPI4 into 100 nM ATG2A. The concentrations of WIPI4 are indicated. A representative data set is shown. (C) Plot of the initial NBD-PE transfer rates versus the molar ratios of WIPI4:ATG2A. The SD of each time point was obtained from three repeats. (D, E) Diagram of (D) and data from (E) the lipid transfer assay with 25 µM PI3P-free donor LUVs (extruded through a 100 nm filter, 46% DOPC, 25% DOPE, 25% DOPS, 2% NBD-PE, and 2% Rh-PE) and PI3P-containing acceptor LUVs (extruded through a 100 nm filter, 5% PI3P, 50% DOPC, 25% DOPE, and 20% DOPS). Note that the PI3P is in the acceptor. (F) Comparisons of the initial NBD-PE transfer rates between the experiments performed in (A, B) and (D, E). Data obtained with 100 nM ATG2A in the presence or absence of 100 nM WIPI4 are compared. (G) Lipid transfer assays with 100 nm filter-extruded LUVs with different lipid compositions. Both WIPI4 and ATG2A concentrations were fixed at 100 nM. All donor LUVs contained 5% PI3P, 2% NBD-PE, 2% Rh-PE, and 25% DOPE or POPE, for DO or PO lipids-based LUVs, respectively. The rest of the PS and PC compositions in each liposome was 20% DOPS/46% DOPC, 5% DOPS/61% DOPC, 25% POPS/41% POPC, and 5% POPS/61% POPC. All acceptors contained 25% DOPE or POPE, and the PS and PC compositions in each liposome was 25% DOPS/50% DOPC, 5% DOPS/70% DOPC, 25% POPS/50% POPC, or 5% POPS/70% POPC. Each donor was paired with the acceptor that contained the same or similar percentage of PS, as indicated. (H) Lipid transfer assays with various LUV50s. Both donor and acceptor LUV50s were prepared by extrusion through a 50 nm filter. The donor LUV50 was composed of 5% PI3P, 2% NBD-PE, 2% Rh-PE, 25% POPE, 5% POPS, and 61% POPC. This donor was used in all four experiments with different acceptor LUV50s. The lipid composition of each acceptor was identical to that of the acceptor with the same name (based on DOPS or POPS percentages) in (G). 100 nM each of WIPI4 and ATG2A were used. (I) Lipid transfer assays with 50 nm filter-extruded donors (LUV50s) and sonicated acceptors (SUVs). The same donor as in (H) (5% POPS/5% PI3P-containing LUV50) was used, and the composition of the acceptor SUV was 5% POPS, 25% POPE, and 70% POPC (the same as that of 5% POPS acceptor LUV50 in (H)). The concentration of ATG2A was 100 nM, and those of the WIPI4 used are indicated. (J) Titration of WIPI1 into 100 nM ATG2A. The experiment was performed as in (A). (K) Initial NBD-PE transfer rates in the experiment shown in (J). (L) The same experiment as (I) except that WIPI1 was tested. All experiments were performed at 25 °C.
Figure 4—figure supplement 1.
Figure 4—figure supplement 1.. Homotypic tethering of PI3P-containing donor liposomes by the WIPI4-ATG2A complex.
(A–J) DLS size distribution profiles (A, C, E, G, I) and normalized autocorrelation profiles (B, D, F, H, J) of the donor LUVs used in Figure 4G (extruded with a 100 nm filter) in the absence (gray lines) or the presence of 100 nM WIPI4, 100 nM ATG2A, or both. The concentration of liposomes was 60 µM (lipid concentration), and only the percentage of DOPS or POPS of each liposome is indicated for clarity. (A, B) Overlay of the profiles of four LUVs-only and LUVs with both WIPI4 and ATG2A. (C–J) Each figure displays a set of four data, each with no protein (gray), ATG2A only (solid black), WIPI4 only (dotted black), and both proteins (colored) for each donor LUV, as indicated.
Figure 4—figure supplement 2.
Figure 4—figure supplement 2.. Homotypic tethering of PI3P-containing donor LUV50 by the WIPI4-ATG2A complex.
(A, B) DLS size distribution profiles (A) and normalized autocorrelation profiles of the donor LUV50 (50 nm; 5% PI3P, 61% POPC, 25% POPE, 5% POPS, 2% NBD-PE, 2% Rh-PE; 60 µM lipid concentration) in the absence (gray) or the presence of 100 nM WIPI4 (dotted black), 100 nM ATG2A (black), or both proteins (yellow). The samples were incubated for 20 min at 25 °C before the measurements.
Figure 4—figure supplement 3.
Figure 4—figure supplement 3.. Cryo-EM visualization of homotypic tethering of 5% POPS-containing LUV50 by the WIPI4-ATG2A complex.
Cryo-EM micrographs of the donor LUV50s used in Figure 4H and I (5% PI3P, 61% POPC, 25% POPE, 5% POPS, 2% NBD-PE, 2% Rh-PE; 300 µM lipid concentration) in the absence (A) and the presence of the 100 nM ATG2-WIPI4 complex (B). The samples were incubated for 30 min at ~22 °C before grid preparation. Note that the proteins are not visible in these images, which is likely due to the thick ice of the specimen and the thin density of the proteins. Most liposomes in the clusters retained their spherical shape, which suggests that ATG2A does not deform these liposomes.
Figure 4—figure supplement 4.
Figure 4—figure supplement 4.. WIPI1 clusters PI3P-containing LUVs.
(A, B) Turbidity assays. The OD at 400 nm of 25 µM 100 nm filter-extruded LUVs in the presence of WIPI1 or WIPI4 were measured. The lipid compositions of the LUVs used in (A) were 5% PI3P, 46% DOPC, 25% DOPE, and 20% DOPS and those in (B) were 5% PI3P, 65% POPC, 25% POPE, and 5% POPS. Protein concentrations are indicated. The SDs were calculated from three independent experiments. Both LUVs were clustered by WIPI1. (B) Micrographs of the negatively stained PI3P-LUVs (100 nm; 5% PI3P, 46% DOPC, 25% DOPE, and 20% DOPS) in the presence or absence of 300 nM WIPI4 or WIPI1. Scale bar, 500 nm.
Figure 5.
Figure 5.. WIPI4 and WIPI1 recruit ATG2A to PI3P-containing LUVs.
(A) Affinity pull-down experiments with ATG2A and WIPI1/WIPI4. Strep-Tactin Superflow affinity beads loaded with or without ATG2A-TwinStrepII were mixed with free WIPI1/WIPI4 proteins. After wash, proteins were eluted. Inputs and eluted fractions were analyzed by SDS-PAGE with CBB staining. (B) Liposome flotation assays to detect membrane binding of WIPI4 and WIPI1. DO lipids-based LUVs (5% PI3P, 49% DOPC, 25% DOPE, 20% DOPS, and 1% DiD) were used at 25 µM. The control LUVs were prepared without PI3P. Protein concentrations are indicated. The top (T), middle (M), and bottom (B) fractions were collected after centrifugation and analyzed by western blotting. Bands were detected using an anti-His antibody on the 800 nm channel of a LI-COR infrared fluorescence scanner. (C) Liposome flotation assays to examine ATG2A (100 nM) recruitment to PI3P-containing membranes by WIPI proteins. The experiments were performed as in (B). ATG2A-TwinStrepII was detected using an anti-StrepII antibody on the 700 nm channel of the infrared scanner (magenta). His-WIPI proteins were detected as in (B) on the 800 nm channel (green). 10% acrylamide SDS-PAGE gels were used in all experiments.
Figure 6.
Figure 6.. Models of phagophore expansion and ATG2-mediated lipid transport.
(A) Illustration of ATG2-mediated transport of lipids from the ER to the phagophore. (B) The bridge model for WIPI-ATG2-mediated lipid transfer between a highly curved PI3-containing membrane and a non-PI3P-containing membrane. (C) The ferry model. ATG2 dynamically associates with both membranes while stably anchored to the PI3-containing membrane through the flexibly bound WIPI.
Author response image 1.
Author response image 1.. Expression and purification of the ATG2A full-length mutants.
The locations of the mutations are shown on the ATG2A N-terminus homology model. All four point mutations on each β strand were incorporated into one mutant construct (a total of three constructs were tested). SDS-PAGE shows the results of expression of the mutants in Sf9 insect cells and purification with glutathione beads. All three mutants expressed less than the wild-type protein, and little mutant proteins were detected on glutathione beads after wash. The eluted fractions after on-beads TEV digestion contained very little mutant proteins. The poor yields of these mutants prevented biochemical studies on these mutants.

Comment in

Similar articles

Cited by

References

    1. AhYoung AP, Jiang J, Zhang J, Khoi Dang X, Loo JA, Zhou ZH, Egea PF. Conserved SMP domains of the ERMES complex bind phospholipids and mediate tether assembly. PNAS. 2015;112:E3179–E3188. doi: 10.1073/pnas.1422363112. - DOI - PMC - PubMed
    1. Arstila AU, Trump BF. Studies on cellular autophagocytosis. The formation of autophagic vacuoles in the liver after glucagon administration. The American Journal of Pathology. 1968;53:687–733. - PMC - PubMed
    1. Axe EL, Walker SA, Manifava M, Chandra P, Roderick HL, Habermann A, Griffiths G, Ktistakis NT. Autophagosome formation from membrane compartments enriched in phosphatidylinositol 3-phosphate and dynamically connected to the endoplasmic reticulum. The Journal of Cell Biology. 2008;182:685–701. doi: 10.1083/jcb.200803137. - DOI - PMC - PubMed
    1. Bakula D, Müller AJ, Zuleger T, Takacs Z, Franz-Wachtel M, Thost AK, Brigger D, Tschan MP, Frickey T, Robenek H, Macek B, Proikas-Cezanne T. WIPI3 and WIPI4 β-propellers are scaffolds for LKB1-AMPK-TSC signalling circuits in the control of autophagy. Nature Communications. 2017;8:15637. doi: 10.1038/ncomms15637. - DOI - PMC - PubMed
    1. Barth H, Meiling-Wesse K, Epple UD, Thumm M. Autophagy and the cytoplasm to vacuole targeting pathway both require Aut10p. FEBS Letters. 2001;508:23–28. doi: 10.1016/S0014-5793(01)03016-2. - DOI - PubMed

Publication types

LinkOut - more resources