

An optimised tissue disaggregation and data processing pipeline for characterising fibroblast phenotypes using single-cell RNA sequencing
- PMID: 31270426
- PMCID: PMC6610623
- DOI: 10.1038/s41598-019-45842-4
An optimised tissue disaggregation and data processing pipeline for characterising fibroblast phenotypes using single-cell RNA sequencing
Abstract
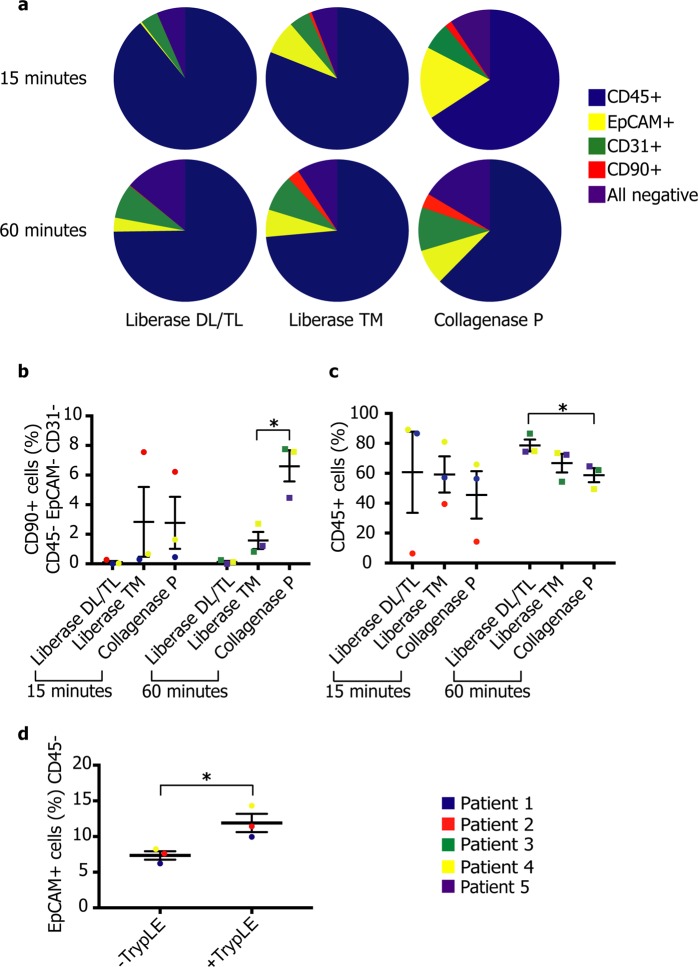
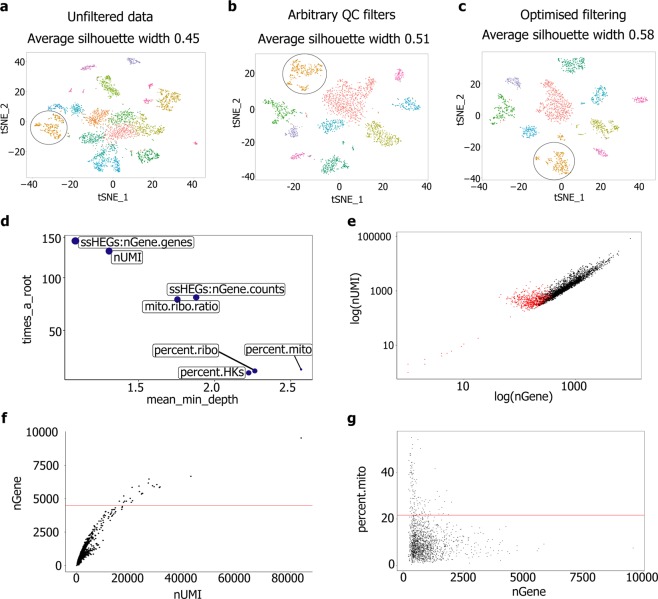
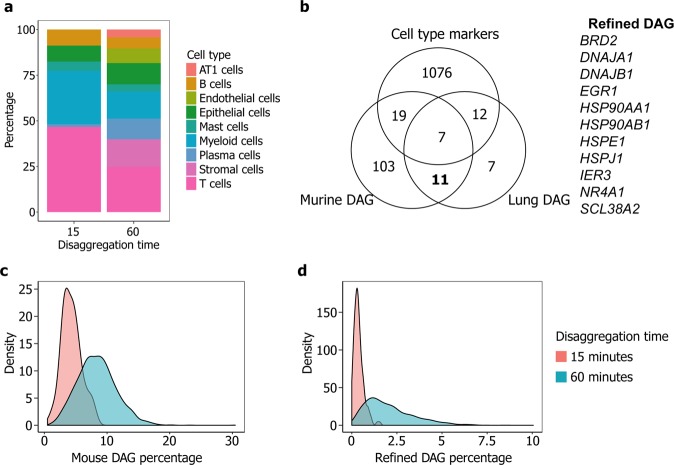
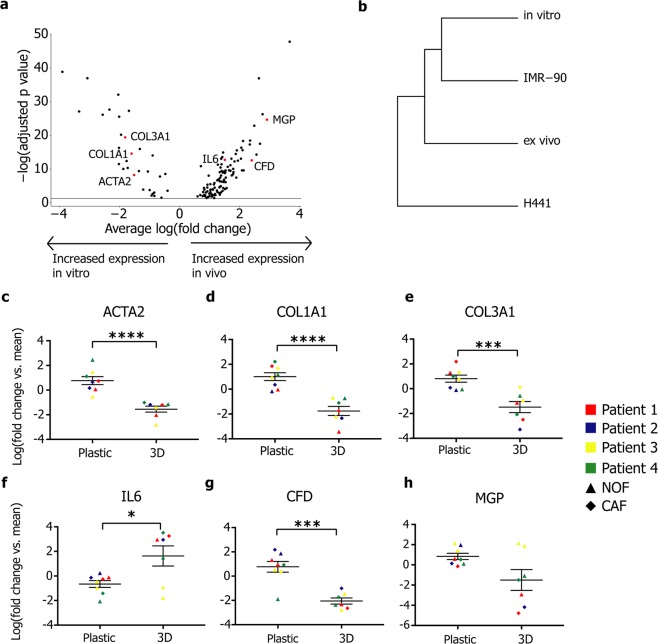
Single-cell RNA sequencing (scRNA-Seq) provides a valuable platform for characterising multicellular ecosystems. Fibroblasts are a heterogeneous cell type involved in many physiological and pathological processes, but remain poorly-characterised. Analysis of fibroblasts is challenging: these cells are difficult to isolate from tissues, and are therefore commonly under-represented in scRNA-seq datasets. Here, we describe an optimised approach for fibroblast isolation from human lung tissues. We demonstrate the potential for this procedure in characterising stromal cell phenotypes using scRNA-Seq, analyse the effect of tissue disaggregation on gene expression, and optimise data processing to improve clustering quality. We also assess the impact of in vitro culture conditions on stromal cell gene expression and proliferation, showing that altering these conditions can skew phenotypes.
Conflict of interest statement
The authors declare no competing interests.
Figures
Similar articles
-
Single-cell transcriptome analysis of endometrial tissue.Hum Reprod. 2016 Apr;31(4):844-53. doi: 10.1093/humrep/dew008. Epub 2016 Feb 13. Hum Reprod. 2016. PMID: 26874359 Free PMC article.
-
Data Analysis in Single-Cell Transcriptome Sequencing.Methods Mol Biol. 2018;1754:311-326. doi: 10.1007/978-1-4939-7717-8_18. Methods Mol Biol. 2018. PMID: 29536451
-
Single-Cell RNA Sequencing Analysis: A Step-by-Step Overview.Methods Mol Biol. 2021;2284:343-365. doi: 10.1007/978-1-0716-1307-8_19. Methods Mol Biol. 2021. PMID: 33835452
-
Clustering and classification methods for single-cell RNA-sequencing data.Brief Bioinform. 2020 Jul 15;21(4):1196-1208. doi: 10.1093/bib/bbz062. Brief Bioinform. 2020. PMID: 31271412 Free PMC article. Review.
-
Machine learning and statistical methods for clustering single-cell RNA-sequencing data.Brief Bioinform. 2020 Jul 15;21(4):1209-1223. doi: 10.1093/bib/bbz063. Brief Bioinform. 2020. PMID: 31243426 Review.
Cited by
-
Isolation of single cells from human uterus in the third trimester of pregnancy: myometrium, decidua, amnion and chorion.Oxf Open Immunol. 2022 Nov 23;3(1):iqac010. doi: 10.1093/oxfimm/iqac010. eCollection 2022. Oxf Open Immunol. 2022. PMID: 36846559 Free PMC article.
-
The spatiotemporal dynamics of microglia across the human lifespan.Dev Cell. 2022 Sep 12;57(17):2127-2139.e6. doi: 10.1016/j.devcel.2022.07.015. Epub 2022 Aug 16. Dev Cell. 2022. PMID: 35977545 Free PMC article.
-
Integrated multi-omics reveals cellular and molecular interactions governing the invasive niche of basal cell carcinoma.Nat Commun. 2022 Aug 20;13(1):4897. doi: 10.1038/s41467-022-32670-w. Nat Commun. 2022. PMID: 35986012 Free PMC article.
-
Practical Considerations for Single-Cell Genomics.Curr Protoc. 2022 Aug;2(8):e498. doi: 10.1002/cpz1.498. Curr Protoc. 2022. PMID: 35926125 Free PMC article. Review.
-
Cancer associated fibroblast: Mediators of tumorigenesis.Matrix Biol. 2020 Sep;91-92:19-34. doi: 10.1016/j.matbio.2020.05.004. Epub 2020 May 22. Matrix Biol. 2020. PMID: 32450219 Free PMC article. Review.
References
-
- Zepp Jarod A., Zacharias William J., Frank David B., Cavanaugh Christina A., Zhou Su, Morley Michael P., Morrisey Edward E. Distinct Mesenchymal Lineages and Niches Promote Epithelial Self-Renewal and Myofibrogenesis in the Lung. Cell. 2017;170(6):1134-1148.e10. doi: 10.1016/j.cell.2017.07.034. - DOI - PMC - PubMed
Publication types
MeSH terms
Substances
Grants and funding
LinkOut - more resources
Full Text Sources
Other Literature Sources
Molecular Biology Databases
