Identification of Novel Predictive Biomarkers for Endometrial Malignancies: N-Acylethanolamines
- PMID: 31245282
- PMCID: PMC6579876
- DOI: 10.3389/fonc.2019.00430
Identification of Novel Predictive Biomarkers for Endometrial Malignancies: N-Acylethanolamines
Abstract
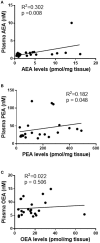
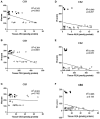
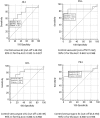
Objective: To identify new biochemical markers for endometrial cancer (EC). Recent evidence suggests that members of the endocannabinoid system (N-acylethanolamines) that bind to and activate receptors that are dysregulated in EC are involved in this tumour's biology. These observations suggest increased N-acylethanolamine levels in the tissue that might appear in plasma and could be used as disease biomarkers. Methods: N-arachidonoylethanolamine (anandamide, AEA) and the N-acylethanolamine substances, N-oleoylethanolamine (OEA), and N-palmitoylethanolamine (PEA) were quantified in plasma and endometrial tissue collected from 31 EC and seven atrophic controls using UHPLC-MS/MS. Receiver-operating characteristics (ROC) and logistic regression were used to determine diagnostic accuracy. Cannabinoid receptor 1 (CB1) and 2 (CB2) protein levels were determined by specific immunohistochemistry and histomorphometric analyses. Correlations between plasma and tissue levels of the three N-acylethanolamines and tissue levels of the three N-acylethanolamines and CB1 and CB2 receptor expression levels were determined using correlation analysis. Results: Plasma and tissue AEA and PEA levels were significantly (p < 0.05) higher in EC than controls whilst OEA levels were significantly elevated in type 1 EC tissues but not in plasma. There were significant positive correlations between plasma and tissue levels of AEA (R 2 = 0.302, p = 0.008) and PEA (R 2 = 0.182, p = 0.047), but not for OEA (R 2 = 0.022, p = 0.506). The diagnostic accuracies for EC were: sensitivity of 53.3%, specificity of 100% for plasma AEA (>1.36 nM); sensitivity of 73.3%, specificity of 100% for plasma PEA (>27.5 nM); and sensitivity of 93.3%, specificity of 28.6% for plasma OEA (>4.97 nM). Logistic regression increased the area under the ROC curve (AUC) from 0.781 for AEA, 0.857 for PEA, and 0.543 for OEA to a combined AUC of 0.933 for EC diagnosis. Significant inverse correlations between tissue AEA (R 2 = 0.343, p = 0.003) and PEA (R 2 = 0.384, p < 0.0001) levels and CB1 expression were observed. No correlation between tissue levels of OEA and CB1 and tissue levels of any of the three N-acylethanolamines and CB2 protein expression were observed, except in the type 1 EC patients. Conclusion: Since plasma AEA and PEA are significantly elevated in patients with EC and a reflection of production by the endometrial tumour, then these lipids have the potential to be useful biomarkers for the early diagnosis of EC.
Keywords: anandamide; biomarker; endocannabinoid; endometrial cancer; prediction.
Figures


Similar articles
-
Expression and Function of the Endocannabinoid Modulating Enzymes Fatty Acid Amide Hydrolase and N-Acylphosphatidylethanolamine-Specific Phospholipase D in Endometrial Carcinoma.Front Oncol. 2019 Dec 19;9:1363. doi: 10.3389/fonc.2019.01363. eCollection 2019. Front Oncol. 2019. PMID: 31921630 Free PMC article.
-
Profiling plasma N-Acylethanolamine levels and their ratios as a biomarker of obesity and dysmetabolism.Mol Metab. 2018 Aug;14:82-94. doi: 10.1016/j.molmet.2018.06.002. Epub 2018 Jun 6. Mol Metab. 2018. PMID: 29935920 Free PMC article.
-
N-Acylethanolamines in human reproductive fluids.Chem Phys Lipids. 2002 Dec 31;121(1-2):211-27. doi: 10.1016/s0009-3084(02)00158-5. Chem Phys Lipids. 2002. PMID: 12505702 Review.
-
Optimized synthesis and characterization of N-acylethanolamines and O-acylethanolamines, important family of lipid-signalling molecules.Chem Phys Lipids. 2012 Oct;165(7):705-11. doi: 10.1016/j.chemphyslip.2012.06.010. Epub 2012 Jul 28. Chem Phys Lipids. 2012. PMID: 22850591
-
Anandamide and other N-acylethanolamines: A class of signaling lipids with therapeutic opportunities.Prog Lipid Res. 2023 Jan;89:101194. doi: 10.1016/j.plipres.2022.101194. Epub 2022 Sep 20. Prog Lipid Res. 2023. PMID: 36150527 Review.
Cited by
-
(Endo)Cannabinoids and Gynaecological Cancers.Cancers (Basel). 2020 Dec 25;13(1):37. doi: 10.3390/cancers13010037. Cancers (Basel). 2020. PMID: 33375539 Free PMC article. Review.
-
The fundamental role of the endocannabinoid system in endometrium and placenta: implications in pathophysiological aspects of uterine and pregnancy disorders.Hum Reprod Update. 2020 Jun 18;26(4):586-602. doi: 10.1093/humupd/dmaa005. Hum Reprod Update. 2020. PMID: 32347309 Free PMC article. Review.
-
Expression of the putative cannabinoid receptor GPR55 is increased in endometrial carcinoma.Histochem Cell Biol. 2021 Nov;156(5):449-460. doi: 10.1007/s00418-021-02018-4. Epub 2021 Jul 29. Histochem Cell Biol. 2021. PMID: 34324032 Free PMC article.
-
Expression and Function of the Endocannabinoid Modulating Enzymes Fatty Acid Amide Hydrolase and N-Acylphosphatidylethanolamine-Specific Phospholipase D in Endometrial Carcinoma.Front Oncol. 2019 Dec 19;9:1363. doi: 10.3389/fonc.2019.01363. eCollection 2019. Front Oncol. 2019. PMID: 31921630 Free PMC article.
-
The Endocannabinoid System as a Pharmacological Target for New Cancer Therapies.Cancers (Basel). 2021 Nov 15;13(22):5701. doi: 10.3390/cancers13225701. Cancers (Basel). 2021. PMID: 34830856 Free PMC article. Review.
References
-
- Wise PM. Aging of the female reproductive system. In: Masoron EJ, Austad editors. Handbook of the Biology of Aging. 6th ed. Burlington, MA: Academic Press; (2005). p. 570–586. 10.1016/B978-012088387-5/50024-8 - DOI
-
- Cancer Research UK Cancer Statistics,. (2011). Available online at http://info.cancerresearchuk.org/cancerstats/index.htm (accessed January 17, 2019).
-
- Cancer Research Statistics Cancer Incidence Mortality in the UK,. (2014). Availabale online at http://publications.cancerresearchuk.org/downloads/Product/CS__REPORT__T... (accessed January 17, 2019).
LinkOut - more resources
Full Text Sources

