The histone lysine demethylase KDM7A is required for normal development and first cell lineage specification in porcine embryos
- PMID: 31216927
- PMCID: PMC6773414
- DOI: 10.1080/15592294.2019.1633864
The histone lysine demethylase KDM7A is required for normal development and first cell lineage specification in porcine embryos
Abstract
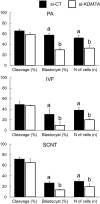
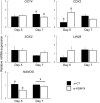
There is growing evidence that histone lysine demethylases (KDMs) play critical roles in the regulation of embryo development. This study investigated if KDM7A, a lysine demethylase known to act on mono-(me1) and di-(me2) methylation of H3K9 and H3K27, participates in the regulation of early embryo development. Knockdown of KDM7A mRNA reduced blastocyst formation by 69.2% in in vitro fertilized (IVF), 48.4% in parthenogenetically activated (PA), and 48.1% in somatic cell nuclear transfer (SCNT) embryos compared to controls. Global immunofluorescence (IF) signal in KDM7A knockdown compared to control embryos was increased for H3K27me1 on D7, for H3K27me2 on D3 and D5, for H3K9me1 on D5 and D7, and for H3K9me2 on D5 embryos, but decreased for H3K9me1, me2 and me3 on D3. Moreover, KDM7A knockdown altered mRNA expression, including the downregulation of KDM3C on D3, NANOG on D5 and D7, and OCT4 on D7 embryos, and the upregulation of CDX2, KDM4B and KDM6B on D5 embryos. On D3 and D5 embryos, total cell number and mRNA expression of embryo genome activation (EGA) markers (EIF1AX and PPP1R15B) were not affected by KDM7A knockdown. However, the ratio of inner cell mass (ICM)/total number of cells in D7 blastocysts was reduced by 45.5% in KDM7A knockdown compared to control embryos. These findings support a critical role for KDM7A in the regulation of early development and cell lineage specification in porcine embryos, which is likely mediated through the modulation of H3K9me1/me2 and H3K27me1/me2 levels, and changes in the expression of other KDMs and pluripotency genes.
Keywords: Lysine demethylases; cell differentiation; embryo development; histone methylation; porcine.
Figures


Similar articles
-
Histone 3 lysine 4, 9, and 27 demethylases expression profile in fertilized and cloned bovine and porcine embryos.Biol Reprod. 2018 Jun 1;98(6):742-751. doi: 10.1093/biolre/ioy054. Biol Reprod. 2018. PMID: 29528362
-
Histone Lysine Demethylases KDM5B and KDM5C Modulate Genome Activation and Stability in Porcine Embryos.Front Cell Dev Biol. 2020 Mar 10;8:151. doi: 10.3389/fcell.2020.00151. eCollection 2020. Front Cell Dev Biol. 2020. PMID: 32211412 Free PMC article.
-
Kdm7a expression is spatiotemporally regulated in developing Xenopus laevis embryos, and its overexpression influences late retinal development.Dev Dyn. 2024 May;253(5):508-518. doi: 10.1002/dvdy.670. Epub 2023 Nov 1. Dev Dyn. 2024. PMID: 37909656 Review.
-
Genome-Wide Dynamic Profiling of Histone Methylation during Nuclear Transfer-Mediated Porcine Somatic Cell Reprogramming.PLoS One. 2015 Dec 18;10(12):e0144897. doi: 10.1371/journal.pone.0144897. eCollection 2015. PLoS One. 2015. PMID: 26683029 Free PMC article.
-
Lysine-specific demethylase 7A (KDM7A): A potential target for disease therapy.Biochem Pharmacol. 2023 Oct;216:115799. doi: 10.1016/j.bcp.2023.115799. Epub 2023 Sep 9. Biochem Pharmacol. 2023. PMID: 37696455 Review.
Cited by
-
Chromatin role in early programming of embryos.Anim Front. 2021 Dec 17;11(6):57-65. doi: 10.1093/af/vfab054. eCollection 2021 Dec. Anim Front. 2021. PMID: 34934530 Free PMC article. No abstract available.
-
Enhancement of Chromatin and Epigenetic Reprogramming in Porcine SCNT Embryos-Progresses and Perspectives.Front Cell Dev Biol. 2022 Jul 11;10:940197. doi: 10.3389/fcell.2022.940197. eCollection 2022. Front Cell Dev Biol. 2022. PMID: 35898400 Free PMC article.
-
α-Hemolysin from Staphylococcus aureus Changes the Epigenetic Landscape of Th17 Cells.Immunohorizons. 2024 Sep 1;8(9):606-621. doi: 10.4049/immunohorizons.2400061. Immunohorizons. 2024. PMID: 39240270 Free PMC article.
-
Identification of SNPs and INDELS associated with duck egg quality traits through a genome-wide association analysis.Poult Sci. 2024 Dec;103(12):104459. doi: 10.1016/j.psj.2024.104459. Epub 2024 Oct 29. Poult Sci. 2024. PMID: 39504828 Free PMC article.
-
MYC Regulates PHF8, Which Promotes the Progression of Gastric Cancer by Suppressing miR-22-3p.Technol Cancer Res Treat. 2020 Jan-Dec;19:1533033820967472. doi: 10.1177/1533033820967472. Technol Cancer Res Treat. 2020. PMID: 33111613 Free PMC article.
References
-
- Rivera RM, Ross JW.. Epigenetics in fertilization and preimplantation embryo development. Prog Biophys Mol Biol. 2013. December;113(3):423–432.PubMed PMID: 23454467. - PubMed
-
- Cabot B, Cabot RA. Chromatin remodeling in mammalian embryos. Reproduction. 2018. March;155(3):R147–R158.PubMed PMID: 29339454. - PubMed
Publication types
MeSH terms
Substances
Grants and funding
LinkOut - more resources
Full Text Sources
Other Literature Sources
Research Materials
Miscellaneous
