. 2019 Jun 12;5(6):eaaw1386.
doi: 10.1126/sciadv.aaw1386. eCollection 2019 Jun.

BAP31 regulates mitochondrial function via interaction with Tom40 within ER-mitochondria contact sites

Affiliations

BAP31 regulates mitochondrial function via interaction with Tom40 within ER-mitochondria contact sites

Takushi Namba. Sci Adv. .

Abstract

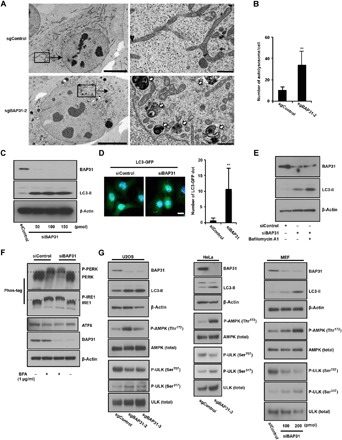
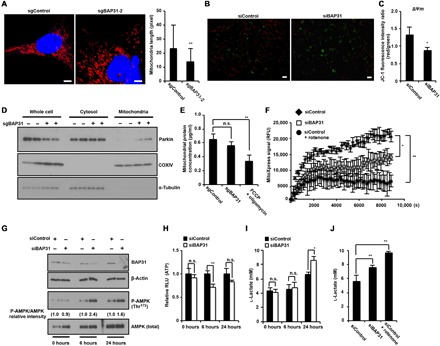
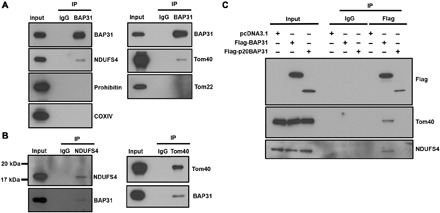
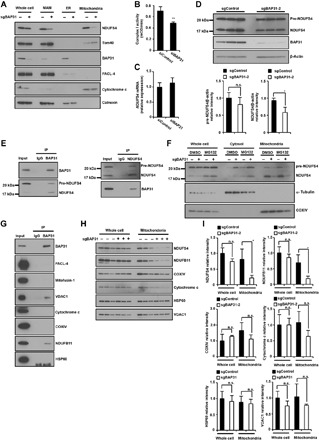
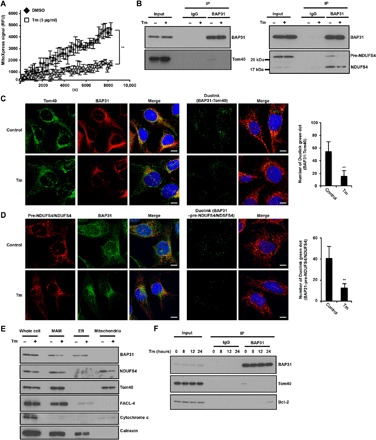
The endoplasmic reticulum (ER) is composed of large membrane-bound compartments, and its membrane subdomain appears to be in close contact with mitochondria via ER-mitochondria contact sites. Here, I demonstrate that the ER membrane protein, BAP31, acts as a key factor in mitochondrial homeostasis to stimulate the constitution of the mitochondrial complex I by forming an ER-mitochondria bridging protein complex. Within this complex, BAP31 interacts with mitochondria-localized proteins, including Tom40, to stimulate the translocation of NDUFS4, the component of complex I from the cytosol to the mitochondria. Disruption of the BAP31-Tom40 complex inhibits mitochondrial complex I activity and oxygen consumption by the decreased NDUFS4 localization to the mitochondria. Thus, the BAP31-Tom40 ER-mitochondria bridging complex mediates the regulation of mitochondrial function and plays a role as a previously unidentified stress sensor, representing a mechanism for the establishment of ER-mitochondria communication via contact sites between these organelles.


Figures

Fig. 1
Fig. 1. Suppression of BAP31 expression induces autophagy via AMPK signaling.
(A) U2OS cells subjected to BAP31 knockout via CRISPR-Cas9 system (sgControl and sgBAP31-2) were subjected to TEM. Higher magnification images are shown at the right. Scale bars, 10 and 1 μm (left and right, respectively). White arrows indicate autolysosomes. (B) Total number of autolysosomes in each cell was determined. Data are presented as means ± SD (n = 6). (C) Loss of BAP31 increases LC3-II expression. U2OS cells were transfected with the indicated concentrations of siBAP31 and 150 pmol of siControl for 24 hours. Cells were subjected to immunoblotting using anti-BAP31, anti-LC3, and anti–β-actin antibodies. (D) U2OS cells stably expressing GFP-LC3 were transfected with 100 pmol of siBAP31 or siControl for 24 hours. Cells were fixed with 4% paraformaldehyde, and GFP-LC3 (green) fluorescence was determined. Blue represents nuclear 4′,6-diamidino-2-phenylindole (DAPI) staining. Scale bar, 10 μm. The number of LC3-GFP puncta in the cells (green dots) was determined, and data are presented as means ± SD (n = 6). (E) Loss of BAP31 stimulates autophagosome synthesis. U2OS cells were transfected with 100 pmol of siControl or siBAP31 for 24 hours, followed by treatment with or without bafilomycin A1 (1 μg/ml) for 1 hour. Cells were subjected to immunoblotting using the indicated antibodies. (F) BAP31 does not affect the ER stress response. U2OS cells were transfected with siBAP31 and siControl for 18 hours and then treated with or without BFA (1 μg/ml) for 8 hours. Cells were subjected to immunoblotting using the indicated antibodies and Phos-tag SDS–polyacrylamide gel electrophoresis (PAGE) or normal SDS-PAGE. (G) BAP31 knockout or knockdown activates the AMPK-ULK-LC3 signaling pathway. U2OS and HeLa cells subjected to BAP31 knockout via the CRISPR-Cas9 system (sgControl, sgBAP31-2, and sgBAP31-3) and MEF cells transfected with siControl (200 pmol) and siBAP31 at the indicated concentrations for 24 hours were subjected to immunoblotting using the indicated antibodies. P value was calculated using two-way analysis of variance (ANOVA). **P < 0.01 (B and D).
Fig. 2
Fig. 2. Loss of BAP31 impaired mitochondrial function.
(A) Loss of BAP31 induces mitochondrial morphological changes. U2OS sgControl or sgBAP31-2 cells were treated with MitoTracker orange and subjected to fluorescence microscopy. Red represents mitochondria MitoTracker staining, and blue represents nuclear DAPI staining. Scale bars, 10 μm. The length of mitochondria within the cells was determined, and data are presented as means ± SD (n = 30). (B and C) Loss of BAP31 decreases mitochondrial transmembrane electric potential. After 24 hours of treatment with siControl or siBAP31 in U2OS cells, these cells were incubated with JC-1 for 20 min and subjected to either (B) fluorescence microscopy (red, JC-1 aggregates; green, JC-1 monomers) or (C) microplate reader; ΔΨm was determined by the ratio between the fluorescence intensity obtained at red fluorescence of energized mitochondrion and green fluorescence of de-energized mitochondrion. Scale bars, 20 μm. (D) Parkin-localized mitochondrial fraction by loss of BAP31. U2OS sgControl or sgBAP31-2 cells were fractionated into three parts (whole cell, cytosol, and mitochondria) and blotted with antibodies to Parkin, COXIV (mitochondria marker), and α-tubulin (cytosol marker). (E) The same number of U2OS sgBAP31-2 cells and sgControl cells with or without simultaneous treatment of FCCP (1 μM) and oligomycin (1 μM) for 12 hours was isolated via mitochondrial fractionation, and protein concentration was determined. (F) Mitochondrial oxygen consumption is suppressed by BAP31 knockdown. U2OS cells transfected with siBAP31 or siControl for 24 hours received additional treatment with or without rotenone (5 μM) for 6 hours. Time-resolved fluorescence (TR-F) of MitoXpress probe was converted to phosphorescence values and normalized to the cell number. Data are expressed as mean TR-F. Data are presented as means ± SD of three simultaneously performed experiments. RFU, relative fluorescence units. (G) Cell lysates were subjected to immunoblotting using the indicated antibodies. The intensity of the P-AMPK band was determined using ImageJ software. (H) ATP level was determined using a CellTiter-Glo assay. RLU, relative luminescence units. (I) Suppression of BAP31 expression decreases ATP levels and stimulates glycolysis. U2OS cells were treated with siControl or siBAP31 for the indicated time periods. l-Lactate levels were determined using the Glycolysis Cell-Based Assay Kit. (J) Inhibition of mitochondrial complex I stimulates glycolysis. U2OS cells transfected with siBAP31 or siControl for 24 hours received additional treatment with or without rotenone (5 μM) for 6 hours. l-Lactate levels were determined using the same procedure described in (I). Data are presented as means ± SD of three simultaneously performed experiments (C, E, F, and H to J). P value was calculated using two-way ANOVA; n.s., not significant; *P < 0.05; **P < 0.01.
Fig. 3
Fig. 3. BAP31 interacts with NDUFS4 and Tom40.
(A and B) U2OS cells were harvested, and proteins were cross-linked with dithiobis(succinimidyl propionate) before protein extraction. A co-immunoprecipitation (IP) assay was performed with cell lysates using the indicated antibodies, followed by Western blotting. IgG, immunoglobulin G. (C) Mapping of BAP31 binding sites for NDUFS4 or Tom40 by co-immunoprecipitation, followed by Western blotting using the indicated antibodies. The indicated flag-BAP31 proteins (amino acids 1 to 246) and flag-BAP31 deletion proteins (p20BAP31; amino acids 1 to 164) were generated for these co-immunoprecipitation experiments.
Fig. 4
Fig. 4. BAP31 stimulates translocation of NDUFS4 from cytosol to mitochondria.
(A) Decreased NDUFS4 localization at MAM and mitochondria with BAP31 knockout. U2OS cells with sgBAP31 (+) or sgNegative (−) were fractionated into three parts (MAM, mitochondria, and ER) and blotted using antibodies to NDUFS4, Tom40, BAP31, FACL-4 (MAM marker), cytochrome c (mitochondria marker), and calnexin (ER and MAM markers). The protein concentration was equalized between each sample fraction. (B) Mitochondrial complex I activity is suppressed by BAP31 knockdown. U2OS cells transfected with siControl or siBAP31 for 24 hours were subsequently assessed for mitochondrial respiratory complex I activity. Data are presented as mean ± SD of three simultaneously performed experiments. mOD, millioptical density. (C) BAP31 expression level does not affect NDUFS4 mRNA expression. Total RNA of U2OS cells transfected with siControl or siBAP31 for 24 hours was extracted and subjected to real-time quantitative polymerase chain reaction. Data are presented as means ± SD (three different datasets). (D) BAP31 expression level does not affect total pre-NDUFS4 expression. U2OS sgControl or sgBAP31-2 cells were subjected to immunoblotting with the indicated antibodies. The clear band intensity was determined and expressed relative to the sgControl (n = 3). (E) BAP31 interacts with pre-NDUFS4. U2OS cells were harvested, and a co-immunoprecipitation assay was performed with cell lysates for pre-NDUFS4 detection using the indicated antibodies, followed by Western blotting. (F) Loss of BAP31 inhibits pre-NDUFS4/NDUFS4 translocation to mitochondria and stimulates proteolysis by the proteasome. U2OS sgControl (−) or sgBAP31-2 (+) cells were treated with the proteasome inhibitor MG132 for 1 hour, and cells were subsequently subjected to fractionation and immunoblotting with the indicated antibodies. DMSO, dimethyl sulfoxide. Cytosol fraction was concentrated by using amicon ultra spin. (G) BAP31 interacts with VDAC1 and NDUFB11. The co-immunoprecipitation assay is described in Fig. 3A. (H) BAP31 regulates NDUFS4 and NDUFB11 localization to the mitochondria. U2OS sgControl (−) or sgBAP31-2 (+) cells were subjected to fractionation and immunoblotting with the indicated antibodies. (I) The clear band intensity was determined [gels are shown in (H)] and expressed relative to the sgControl whole-cell fraction (n = 3). P value was calculated using two-way ANOVA; *P < 0.05; **P < 0.01 (B, D, and I). FACL-4, fatty acid-CoA ligase 4; VDAC1, voltage-dependent anion-selective channel 1; NDUFB11, NADH:ubiquinone oxidoreductase subunit B11; HSP60, heat shock protein 60.
Fig. 5
Fig. 5. ER stress-dependent modification of BAP31 localization and interaction with Bcl-2 induces disruption of the BAP31-Tom40 complex.
(A) Mitochondrial oxygen consumption is suppressed by Tm treatment. U2OS cells were treated with Tm for 8 hours. TR-F of the MitoXpress probe was performed using the same procedure described in Fig. 2E. Data are presented as means ± SD of three simultaneously performed experiments. (B) BAP31 and Tom40 or pre-NDUFS4/ NDUFS4 interaction is suppressed by ER stress. U2OS cells were treated with or without Tm (1 μg/ml) for 8 hours. Co-immunoprecipitation was performed using the same procedure described in Fig. 3A and Fig. 4E. (C and D) U2OS cells were treated with Tm (1 μg/ml) for 8 hours. Cells were subjected to immunostaining analysis using antibodies Tom40 (green) and BAP31 (red) (C, left) or pre-NDUFS4/NDUFS4 (red) and BAP31 (green) (D, left). Representative images of Duolink using BAP31 and Tom40 (C, middle) and BAP31 and pre-NDUFS4/NDUFS4 (D, middle) antibodies in U2OS cells following Tm treatment. Endogenous BAP31 and Tom40 or pre-NDUFS4/NDUFS4 interactions were detected by performing a proximity ligation assay and are shown as green dots. Red represents mitochondria MitoTracker staining (C, middle, and D, middle). Merged images are also shown, and colocalization is indicated in yellow. Blue represents nuclear DAPI staining. The number of Duolink dots in the cells was determined (n = 6) (C, right, and D, right). Scale bars, 10 μm. (E) BAP31 localization in MAM is decreased by ER stress. U2OS cells were treated with Tm for 8 hours. Cell lysates were fractionated using the same procedure described in Fig. 4A. (F) BAP31 and Tom40 dissociate upon ER stress, and then BAP31 interacts with Bcl-2. U2OS cells were treated with Tm (1 μg/ml) for the indicated time periods, and co-immunoprecipitation was performed using the same procedure described in Fig. 3A. P value was calculated using two-way ANOVA; *P < 0.05; **P < 0.01.

Similar articles

Cited by

References

    1. Suomalainen A., Battersby B. J., Mitochondrial diseases: The contribution of organelle stress responses to pathology. Nat. Rev. Mol. Cell Biol. 19, 77–92 (2018). - PubMed
    1. Walter P., Ron D., The unfolded protein response: From stress pathway to homeostatic regulation. Science 334, 1081–1086 (2011). - PubMed
    1. Green D. R., Galluzzi L., Kroemer G., Metabolic control of cell death. Science 345, 1250256 (2014). - PMC - PubMed
    1. Win S., Than T. A., Fernandez-Checa J. C., Kaplowitz N., JNK interaction with Sab mediates ER stress induced inhibition of mitochondrial respiration and cell death. Cell Death Dis. 5, e989 (2014). - PMC - PubMed
    1. Hotamisligil G. S., Endoplasmic reticulum stress and the inflammatory basis of metabolic disease. Cell 140, 900–917 (2010). - PMC - PubMed

Publication types

MeSH terms