. 2019 Aug;9(8):1102-1123.
doi: 10.1158/2159-8290.CD-19-0094. Epub 2019 Jun 13.

Cross-Species Single-Cell Analysis of Pancreatic Ductal Adenocarcinoma Reveals Antigen-Presenting Cancer-Associated Fibroblasts

Affiliations

Cross-Species Single-Cell Analysis of Pancreatic Ductal Adenocarcinoma Reveals Antigen-Presenting Cancer-Associated Fibroblasts

Ela Elyada et al. Cancer Discov. 2019 Aug.

Abstract

Cancer-associated fibroblasts (CAF) are major players in the progression and drug resistance of pancreatic ductal adenocarcinoma (PDAC). CAFs constitute a diverse cell population consisting of several recently described subtypes, although the extent of CAF heterogeneity has remained undefined. Here we use single-cell RNA sequencing to thoroughly characterize the neoplastic and tumor microenvironment content of human and mouse PDAC tumors. We corroborate the presence of myofibroblastic CAFs and inflammatory CAFs and define their unique gene signatures in vivo. Moreover, we describe a new population of CAFs that express MHC class II and CD74, but do not express classic costimulatory molecules. We term this cell population "antigen-presenting CAFs" and find that they activate CD4+ T cells in an antigen-specific fashion in a model system, confirming their putative immune-modulatory capacity. Our cross-species analysis paves the way for investigating distinct functions of CAF subtypes in PDAC immunity and progression. SIGNIFICANCE: Appreciating the full spectrum of fibroblast heterogeneity in pancreatic ductal adenocarcinoma is crucial to developing therapies that specifically target tumor-promoting CAFs. This work identifies MHC class II-expressing CAFs with a capacity to present antigens to CD4+ T cells, and potentially to modulate the immune response in pancreatic tumors.See related commentary by Belle and DeNardo, p. 1001.This article is highlighted in the In This Issue feature, p. 983.


Conflict of interest statement

Disclosure of potential conflict of interest

D.A. Tuveson serves on the Scientific Advisory Board of Leap Therapeutics, Surface Oncology, and Bethyl Laboratory, which is not related to the subject matter of this manuscript. D.A.Tuveson also receives funding and reagents from Fibrogen. A. Califano is founder, equity holder, consultant, and director of DarwinHealth Inc., a company that has licensed some of the algorithms used in this manuscript from Columbia University. Columbia University is also an equity holder in DarwinHealth Inc. Under a licensing agreement between Aduro Biotech Inc., Johns Hopkins University, and E. M. Jaffee, Johns Hopkins University is entitled to milestone payments and royalties on sales of certain cancer vaccine products. E. M. Jaffee is on the SABs of Genocea, Adaptive Biotech, CSTONE and DragonFly. E. M. Jaffee receives funding and/or reagents from Aduro Biotech, Bristol Myer Squibb, Hertix, Corvus, and Amgen.

Figures
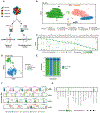
Figure 1.
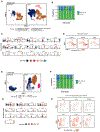
Figure 1.. Single cell analysis uncovers ductal cell subpopulations in human PDAC.
A. Graphical scheme describing the workflow. Human and murine pancreatic tumors were dissociated into single cells. Two fractions of cells were collected by FACS from each sample: (1) all viable cell fraction (DAPI) (2) fibroblast-enriched fraction (DAPI, CD45, CD31, EpCAM). The sorted cells from each fraction were subjected to single cell capture, barcoding and reverse transcription using the 10X Genomics platform. B. Unsupervised clustering of viable cells from 6 human PDAC resections and 2 adjacent-normal pancreata, represented as a t-Distributed Stochastic Neighbor Embedding (t-SNE) plot. Different cell type clusters are color-coded. C. Bubble plot showing selected cell type-specific markers across all clusters. Size of dots represents the fraction of cells expressing a particular marker and intensity of color indicates level of mean expression. Legends are shown below. D. Re-clustering of the ductal cell types in the dataset (clusters 2, 8 and 15 from B), represented as a t-SNE plot. E. Proportion of cells from adjacent-normal pancreata and tumor resections present in each ductal cell sub-cluster. The horizontal black line represents the input contribution of adjacent-normal or tumor tissues into the dataset. F. Violin plot showing normalized expression of marker genes for the different ductal cell sub-clusters. G. Hallmark pathways enriched in the 3 tumor-derived ductal cell sub-clusters (sub-clusters 1, 3 and 4) relative to the adjacent-normal-derived ductal cell sub-cluster (sub-cluster 2). Size of dots represents intersection of upregulated genes (>2 logFC) with hallmark pathway gene sets and intensity of color indicates log10(q-value). Legends are shown below.
Figure 2.
Figure 2.. Immune-suppressive environment is dominating human PDAC.
A. Re-clustering of the myeloid cells in the human dataset (cluster 3 from Fig. 1B) represented as a t-SNE plot. B. Proportion of cells from adjacent-normal pancreata and tumor resections present in each myeloid cell sub-cluster. The horizontal black line represents the input contribution of adjacent-normal or tumor tissues into the dataset. C. Violin plots of selected genes, showing normalized expression in the different sub-clusters. D. t-SNE plots showing expression of selected neutrophil marker genes in the myeloid sub-clusters. Legend shows a color gradient of normalized expression. E. Re-clustering of the T & NK cells in the human dataset (cluster 4 from Fig. 1B) represented as a t-SNE plot. F. Proportion of cells from adjacent-normal pancreata and tumor resections present in each lymphoid cell sub-cluster. The horizontal black line represents the input contribution of adjacent-normal or tumor tissues into the dataset. G. Violin plots of selected genes, showing normalized expression in the different sub-clusters. H. t-SNE plots showing expression of selected T/NK cell activation and exhaustion marker genes in the lymphoid sub-clusters. Legend shows a color gradient of normalized expression. Asterisk marks NKT cells within the NK cell cluster.
Figure 3.
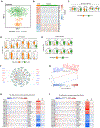
Figure 3.. Distinct subtypes of cancer-associated fibroblasts are detected in human PDAC.
A. Re-clustering of cancer-associated fibroblasts in the human dataset (cluster 7 from Fig. 1B) represented as a t-SNE plot. B. Heatmap showing scaled normalized expression of discriminative marker genes between the two sub-clusters, with cells as columns and genes as rows. Color scheme represents Z-score distribution from −3 (blue) to 3 (dark orange). C-E. Violin plot of selected pan-CAF markers (C), iCAF markers (D) and myCAF markers (E) showing normalized expression in each of the sub-clusters. F. Network representation of selected differentially activated proteins between human iCAFs and myCAFs, as analyzed by VIPER. Proteins activated in iCAFs are shown in red; proteins activated in myCAFs are shown in blue. G. GSEA plot showing the enrichment score (ES) for a selected set of differentially activated proteins in iCAFs (shown in red) and myCAFs (shown in blue). H-I. VIPER plot showing the enrichment for the top 20 differentially activated signaling molecules (H) or transcription factors (I) between iCAFs and myCAFs. The top bar represents the ranked gene expression signature between myCAFs and iCAFs. Regulatory target genes in each signaling molecule regulon or transcription factor regulon are represented by vertical lines projected along the gene expression signature. Each vertical line represents the position of a regulatory target gene in the ranked signature between myCAFs and iCAFs. The colors of the lines indicate if the regulatory targets are positively- (red) or negatively- (blue) regulated by their corresponding signaling molecule or transcription factor, according to the ARACNe/VIPER inferred regulatory model. The two-columns heatmap on the right shows the inferred differential activity (Act) and the differential gene expression (Exp) of each regulon. The column on the left shows the p-values associated with the enrichment of each regulon.
Figure 4.
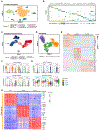
Figure 4.. Single cell analysis of KPC tumors recapitulates human PDAC and reveals a novel CAF subtype.
A. Unsupervised clustering of all viable cells from four KPC mouse PDAC tumors, represented as a t-SNE plot. Different cell type clusters are color-coded. B. Bubble plot showing selected cell type-specific markers across all clusters. Size of dots represents fraction of cells expressing a particular marker, and intensity of color indicates level of mean expression. Legends are shown below. C. Unsupervised clustering of the fibroblast-enriched fraction from PDAC tumors of four KPC mice, represented as a t-SNE plot. Different cell type clusters are color-coded. D. Unsupervised re-clustering of the fibroblasts (clusters 5 and 6 from C) in the four KPC tumors, represented as a t-SNE plot. Different fibroblast sub-clusters are color-coded. E. Heatmap showing scaled normalized expression of discriminative marker genes between the three fibroblast sub-clusters, with cells as columns and genes as rows. Color scheme represents Z-score distribution from −3 (blue) to 3 (dark orange). F. Violin plots of selected iCAF and myCAF markers, showing normalized expression in each of the sub-clusters. G. Violin plots of selected apCAF and pan-CAF markers, showing normalized expression in each of the sub-clusters. H. Heat map showing the top differentially activated proteins (red) in each CAF subtype, as predicted by VIPER analysis. Color scheme represents Z-score distribution from −2 (blue) to 2 (red).
Figure 5.
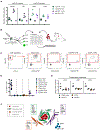
Figure 5.. MHC class II expression characterizes a third CAF subpopulation in KPC tumors.
A. Duplex in situ hybridization of Col1a1 and H2-Ab1 in KPC tumor sections. The black square on the left panel is magnified in the right panel. Arrows indicate apCAFs. B. Sequential immunohistochemistry (IHC) of PDPN and CD74 in KPC tumor sections. The black square on the left panel is magnified in the right panel. Arrow indicates an apCAF. C. A representative flow cytometry analysis of cell suspension from a KPC tumor. Forward- and side-scatter were used to eliminate debris, and DAPI staining was used to eliminate dead cells. CD45 was used as an immune cell marker, EpCAM as an epithelial cell marker and PDPN and PDGFRα as fibroblast markers. Cells that were negative for both CD45 and EpCAM (red square on left panel), and positive for PDPN (red rectangle on middle panel) were gated on for Ly6C and MHCII expression. The top left quarter shows iCAFs (Ly6C+, MHCII), the bottom right quarter shows apCAFs (Ly6C, MHCII+) and the bottom left quarter shows myCAFs (Ly6C, MHCII). D. Proportions of CAF subtypes from the PDPN-positive population in KPC tumors, as measured by flow cytometry analysis (n=20, %±SEM: iCAFs 44.4±3.9, apCAFs 10.3±1.25, myCAFs 45.3±4.1). E-G. qPCR analysis of apCAF marker genes (E), iCAF marker genes (F) and myCAF marker genes (G) in the three CAF subtypes sorted from KPC tumors (n≥2 biological replicates). Black horizontal line represents mean value of data points. All transcripts were normalized to Hprt.
Figure 6.
Figure 6.. apCAFs are detectable in human PDAC.
A. Expression levels of COL1A1 and selected apCAF marker genes in the human CAF dataset, represented as t-SNE plots. Legend shows a color gradient of normalized expression. Dotted line in the COL1A1 t-SNE plot separates the iCAF and myCAF sub-clusters according to Fig. 3A. B. t-SNE plot showing binary expression scheme of HLA-DRA and CD74 in human CAFs. Colors represent cells expressing HLA-DRA only (blue), CD74 only (pink), both genes (green) or neither (gray). C. Quantification of the t-SNE plot shown in B. D. A representative image from an imaging mass cytometry (IMC) staining of human PDAC sections, using metal-conjugated antibodies. Tumor sections from 4 different patients were stained. The left panel shows a zoomed-out image. The small panels on the right show a magnification of the depicted area within the section (white rectangle), where each panel is stained for a specific marker(s), as indicated. Errors are pointing to examples of apCAFs.
Figure 7.
Figure 7.. apCAFs can present antigens to T cells.
A. qPCR analysis of apCAF and myCAF marker genes in apCAFs sorted from KPC tumors (apCAFs in vivo) compared to the same population following culture in two-dimensional monolayer (apCAFs in 2D). myCAFs sorted from the same KPC tumors (myCAFs in vivo) and myCAFs grown in 2D (myCAFs in 2D) were used as positive controls for myCAF genes (n=3 biological replicates). Black horizontal line represents mean value of data points. All transcripts were normalized to Hprt. B. An illustration of the T cell activation assay: the three CAF subtypes and professional APCs were isolated from orthotopic tumors that were transplanted in MHCII-EGFP host mice (left side). Sorted cells were incubated with or without OVA peptide, and then co-cultured with CD4+ T cells that were isolated from OVA-specific OTII mice (right side). After 17 hours of co-culture, T cells were analyzed by flow cytometry for early activation markers. C. An example of T cell early activation assay. CD4+ T cells that were co-cultured with OVA-loaded APCs or different CAF subtypes for 17 h, were washed and stained for T cell markers, and read on a flow cytometer. Debris and dead cells were excluded by forward- and side-scatter and by DAPI staining (not shown). Viable cells were stained for CD4, CD25 and CD69. A representative example of CD4 gating is shown on the most left panel. Each of the other panels shows the CD69+ population upon co-culture of T cells with different cell types, following an incubation with OVA. D. Quantification of three independent experiments of T cell early activation. Values ±SEM are shown (n=7 for APCs and myCAFs, n=6 for iCAFs, n=3 for apCAFs). E. qPCR analysis of costimulatory molecules in the three CAF subtypes sorted from KPC tumors, compared to CD45+ cells sorted from the same tumors (n≥2 biological replicates). Black horizontal line represents mean value of data points. All transcripts were normalized to Hprt. F. Illustrated summary of CAF subpopulations and their functions in PDAC. Subpopulations and their unique features are highlighted by different colors: myCAFs in green, iCAFs in orange and apCAFs in purple. Selected markers of each subpopulation are listed in the corresponding boxes.

Comment in

Similar articles

Cited by

References

    1. Siegel RL, Miller KD, Jemal A. Cancer statistics, 2018. CA Cancer J Clin 2018;68(1):7–30 doi 10.3322/caac.21442. - DOI - PubMed
    1. Waghray M, Yalamanchili M, di Magliano MP, Simeone DM. Deciphering the role of stroma in pancreatic cancer. Curr Opin Gastroenterol 2013;29(5):537–43 doi 10.1097/MOG.0b013e328363affe. - DOI - PMC - PubMed
    1. Ohlund D, Elyada E, Tuveson D. Fibroblast heterogeneity in the cancer wound. J Exp Med 2014;211(8):1503–23 doi 10.1084/jem.20140692. - DOI - PMC - PubMed
    1. Veenstra VL, Garcia-Garijo A, van Laarhoven HW, Bijlsma MF. Extracellular Influences: Molecular Subclasses and the Microenvironment in Pancreatic Cancer. Cancers (Basel) 2018;10(2) doi 10.3390/cancers10020034. - DOI - PMC - PubMed
    1. Bolm L, Cigolla S, Wittel UA, Hopt UT, Keck T, Rades D, et al. The Role of Fibroblasts in Pancreatic Cancer: Extracellular Matrix Versus Paracrine Factors. Transl Oncol 2017;10(4):578–88 doi 10.1016/j.tranon.2017.04.009. - DOI - PMC - PubMed

Publication types

MeSH terms

Substances