. 2019 Jun 3;10(1):2387.
doi: 10.1038/s41467-019-10335-5.

Senescent cells evade immune clearance via HLA-E-mediated NK and CD8+ T cell inhibition

Affiliations

Senescent cells evade immune clearance via HLA-E-mediated NK and CD8+ T cell inhibition

Branca I Pereira et al. Nat Commun. .

Abstract

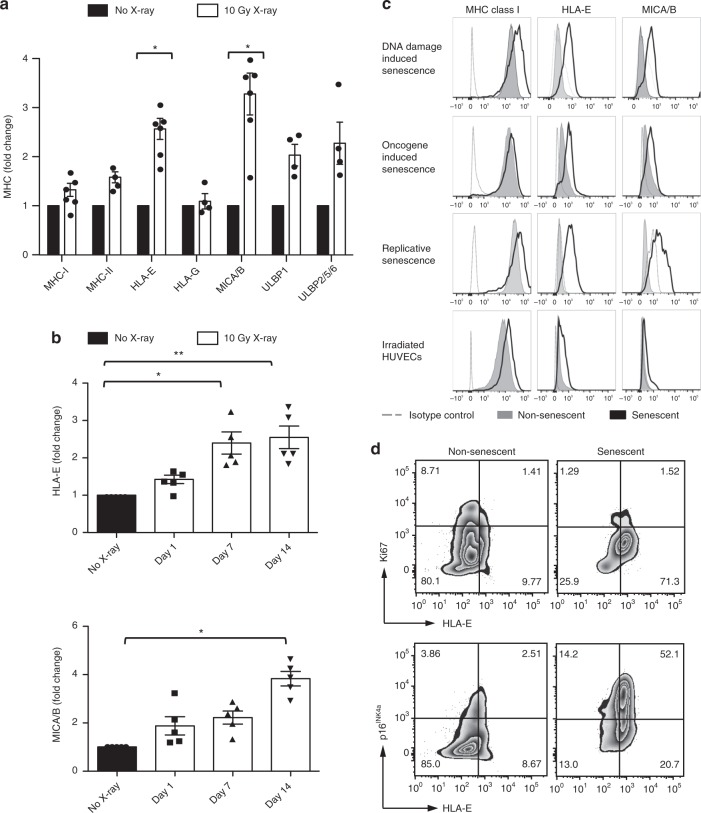
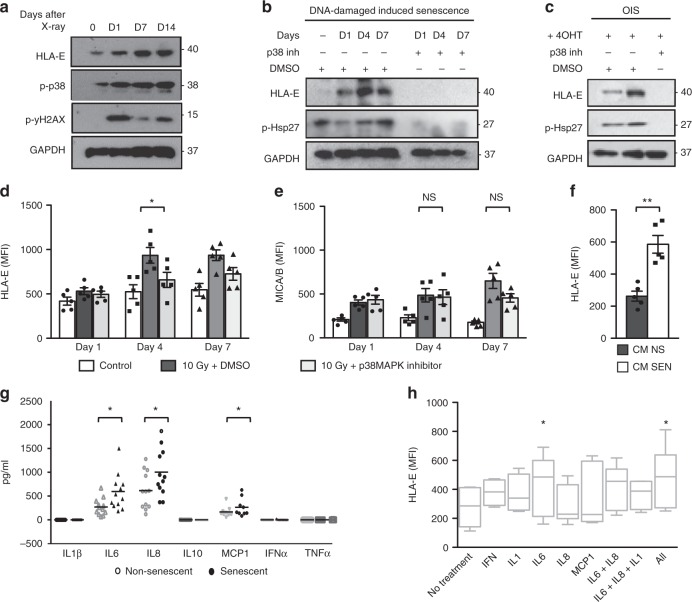
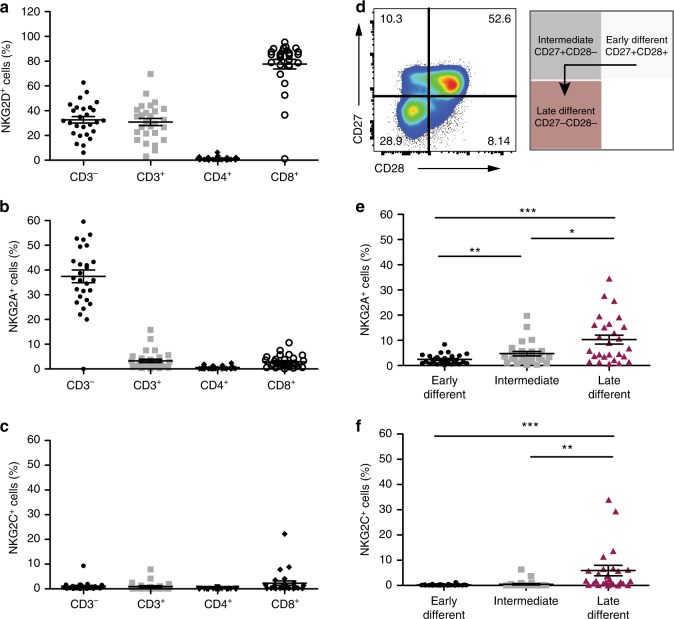
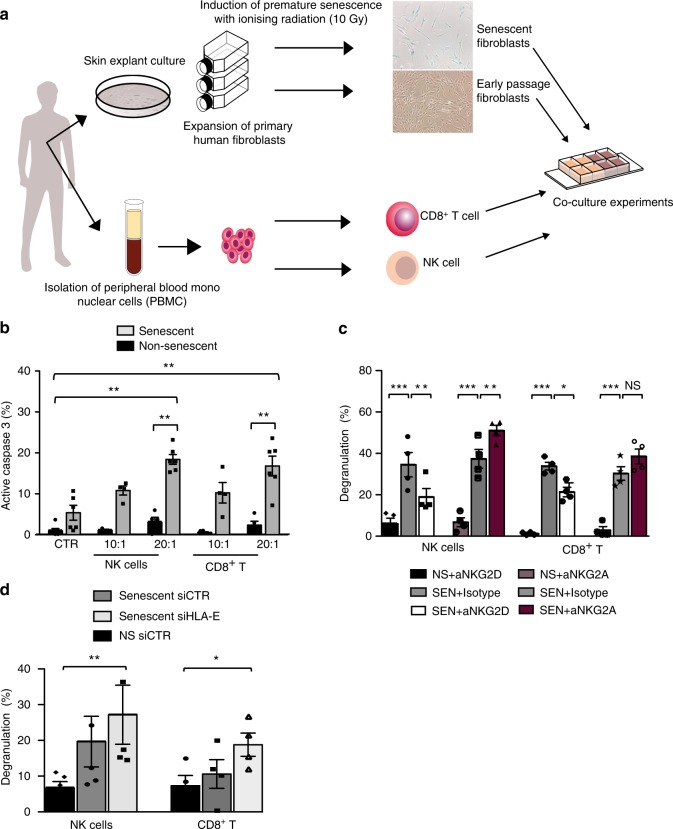
Senescent cells accumulate in human tissues during ageing and contribute to age-related pathologies. The mechanisms responsible for their accumulation are unclear. Here we show that senescent dermal fibroblasts express the non-classical MHC molecule HLA-E, which interacts with the inhibitory receptor NKG2A expressed by NK and highly differentiated CD8+ T cells to inhibit immune responses against senescent cells. HLA-E expression is induced by senescence-associated secretary phenotype-related pro-inflammatory cytokines, and is regulated by p38 MAP kinase signalling in vitro. Consistently, HLA-E expression is increased on senescent cells in human skin sections from old individuals, when compared with those from young, and in human melanocytic nevi relative to normal skin. Lastly, blocking the interaction between HLA-E and NKG2A boosts immune responses against senescent cells in vitro. We thus propose that increased HLA-E expression contributes to persistence of senescent cells in tissues, thereby suggesting a new strategy for eliminating senescent cells during ageing.


Conflict of interest statement

The authors declare no competing interests.

Figures

Fig. 1
Fig. 1
Senescent human fibroblasts express atypical MHC molecules. a Primary human fibroblasts were derived from the human skin and induced to senesce by ionising radiation (IR, 10 Gy X-ray). MHC expression by senescent fibroblasts (white bars) analysed at day 14 after IR using flow cytometry (n = 6 different donors for MHC-I, HLA-E and MICA/B, n = 4 for MHC-II, HLA-G and ULBP). Mean fluorescence intensity (MFI) values are shown as fold change compared with non-irradiated controls, set as one (black bars). b Time course of HLA-E and MICA/B expression at the indicated intervals after irradiation (n = 5). c Representative FACS plots of the total MHC-I, HLA-E and MICA/B expression in senescent fibroblasts induced by ionising radiation (DNA-damage induced senescence), H-RAS activation (oncogene-induced senescence) or continuous passaging (replicative senescence). MHC expression was compared between senescent (black lines), non-senescent (filled histograms) and isotype controls (dashed lines). Human umbilical vein endothelial cells (HUVECs) were irradiated (10 Gy), and MHC expression analysed by flow cytometry as previously described. d Flow-cytometry analysis of co-expression of HLA-E and Ki67 and p16INK4a on irradiated fibroblasts (day 14 after irradiation) and non-irradiated controls. Numbers indicate percentages of cells per quadrant. The data are representative of at least three independent experiments from distinct samples. Statistical significance calculated with Mann–Whitney U test (a) and repeated measures ANOVA with Bonferroni correction (b). The data presented as means ± standard error of the mean (SEM). *p < 0.05, **p < 0.01, ***p < 0.001, ****p < 0.0001
Fig. 2
Fig. 2
HLA-E expression on senescent cells is regulated by p38 and induced by IL-6. a Representative immunoblot of human fibroblasts at the indicated intervals after IR showing the kinetics of HLA-E, p38 (Thr180/Tyr182) and γH2AX (Ser139) phosphorylation. b Human fibroblasts were treated with p38 inhibitor BIRB796 (0.5 μM) or DMSO 12 h before, and for 7 days after IR. Immunoblot of HLA-E expression at the indicated intervals after IR compared with DMSO-treated controls. Undetectable levels of phospho-Hsp27 (p-Hsp27) confirm effective inhibition of p38. c IMR-90 ER:STOP/ER:RAS cells treated with 4-OHT to induce senescence (as demonstrated in Supplementary Fig. 2A–C) and treated with BIRB796 (0.5 μM) or DMSO over 7 days, followed by protein extraction and immunoblot analysis of HLA-E and p-Hsp27. GAPDH served as a loading control in ac. Uncropped immunoblots are provided in the Source Data file. d The summary data of HLA-E and (e) MICA/B expression analysed by flow cytometry on irradiated fibroblasts treated with SB203580 (10 μM), compared with DMSO-treated and non-irradiated controls (n = 5). f Flow-cytometry analysis of HLA-E expression on fibroblasts exposed to the conditioned medium (CM) from senescent (SEN) or non-senescent (NS) cells for 48 h (n = 5). g Supernatant from irradiated senescent or early-passage fibroblasts analysed by cytokine-bead arrays to measure secreted cytokines (in pg/mL) (n = 12). h Fibroblasts were exposed to IL-6 (20 ng/mL), IL-8 (20 ng/mL), IL-1β (20 ng/mL) or IFNα (500 U/mL) or combinations of these for 48 h and analysed for HLA-E expression by flow cytometry (n = 6). The data are representative of at least three independent experiments from distinct samples. Comparison between groups performed with Kruskal–Wallis test in (d), (e) and Mann–Whitney U test in (f), (g) and (h). The data presented as means ± SEM. *p < 0.05, **p < 0.01, ***p < 0.001, ****p < 0.0001
Fig. 3
Fig. 3
MICA/B and HLA-E bind NKG2 receptors expressed on NK and CD8+ T cells. Distribution of (a) NKG2D+, (b) NKG2A+ and (c) NKG2C+ cells on the indicated subsets of human lymphocytes from blood of healthy volunteers (n = 27; mean age 49.9; range, 27–83), analysed by flow cytometry. FACS sequential gating strategies represented in Supplementary Fig. 4. d Human CD8+ T cells were stratified according to CD27 and CD28 expression in early- (CD27+28+), intermediate- (CD27+28) and late-differentiated (CD2728) cells, as represented in the flow-cytometry plot. e, f The summary data of the distribution of NKG2A+ (e) and NKG2C+ (f) cells within early-, intermediate- and late-differentiated CD8+ T cells gated as in (d) in the same donors (n = 27; mean age 49.9; range, 27–83). Comparison between groups done with Friedman test with Dunn's correction for multiple comparisons in (e) and (f). The data presented as means ± SEM. *p < 0.05, **p < 0.01, ***p < 0.001, ****p < 0.0001
Fig. 4
Fig. 4
HLA-E/NKG2A blockade enhances senescent cell killing. a The experimental design of the autologous co-culture system to study immune surveillance of senescent cells: primary human fibroblasts from the skin of healthy volunteers were expanded and induced to senescence by ionising radiation. NK and CD8+ T cells from peripheral blood of the same donors (n = 5, age range 20–46) were used in co-culture experiments with autologous fibroblasts. b The summary data (n = 6) of active caspase 3 expression by non-senescent (black) and senescent fibroblasts (grey) after incubation with NK cells or CD8+ T cells, using different effector to target (E:T) ratios. Controls (CTR) indicate spontaneous activation of caspase 3 in fibroblasts cultured without effector cells. c NK and CD8+ T cells were pre-incubated with blocking antibodies to NKG2A (Z199), NKG2D (1D11) or isotype-matched controls, using an E:T ratio of 20:1. The summary data (n = 4) of degranulation of NK and CD8+ T cells towards senescent and non-senescent fibroblasts assessed by CD107a expression. d The cumulative data of CD107a expression in NK (n = 5) and CD8+ T cells (n = 4) after incubation with normal and senescent fibroblasts transfected with siRNA to HLA-E or a control siRNA. The data are presented as the index of degranulation (calculated as described in the Methods section) in c and d. Measurements were from distinct samples. Statistical analysis done with Mann–Whitney U test in (b) and one-way ANOVA with Bonferroni's multiple comparison test in c and d. The data presented as means ± SEM. *p < 0.05, **p < 0.01, ***p < 0.001, ****p < 0.0001
Fig. 5
Fig. 5
The expression of Qa-1b (mouse homolog of HLA-E) in p16-3MR mice. a Schematic of the p16-3MR (trimodality reporter) fusion protein, containing functional domains of a synthetic Renilla luciferase (LUC), monomeric red fluorescent protein (mRFP) and truncated herpes simplex virus 1 (HSV-1) thymidine kinase (HSV-TK) driven by the p16 promoter. b p16-3MR mice were treated with bleomycin (intra-tracheal injection, 1.9 UI/Kg), ganciclovir (GCV, 25 mg/kg; daily i.p. injections) or PBS; ce qRT-PCR was used to quantify levels of mRNAs encoding p16INK4a (CDKN2A), Qa-1 (H2-T23) and collagen (COL1A1) in lungs from mice treated with PBS (white bar), bleomycin + vehicle control (black bars) and bleomycin + GCV (grey bars). mRNA levels for the indicated genes were normalised to tubulin and presented as fold difference relative to PBS-treated mice. Statistical analysis between groups performed with one-way ANOVA with Bonferroni's multiple comparison test. The data presented as means ± SEM. *p < 0.05, **p < 0.01, ***p < 0.001, ****p < 0.0001
Fig. 6
Fig. 6
HLA-E expression by senescent cells in human melanocytic nevi. Formalin-fixed paraffin-embedded tissue arrays of human melanocytic nevi were analysed by immunohistochemistry using (a) HLA-E (MEM-E/02), (b) Ki67, (c) CD8 specific antibodies. d Double-staining with antibodies for HLA-E (brown) and CD8 (red) showing CD8+ infiltrates surrounding areas with strong HLA-E expression. e Double-staining with HLA-E (brown) and CD3 (red) showing that part of the CD8+ infiltrates are also positive for CD3, identifying them as CD8+ T cells. Scale bar = 50 μm. f Correlation between the frequency of HLA-E+ cells and CD8+ infiltrates in human melanocytic nevi (n = 24) assessed by Spearman test
Fig. 7
Fig. 7
HLA-E expression by senescent fibroblasts in human skin during ageing. a Histological sections from healthy donors were stained for DAPI (blue), TelC (red punctate intranuclear), γH2AX S139 (green) and p16INK4A (white). Telomere-associated γH2AX foci (TAF) are shown (white arrow heads) in non-senescent (NSEN; top panels) and senescent (SEN; bottom panels) cells in the dermis of the human skin. Original image shown in Supplementary Fig. 7E and provided in the Source Data file. Scatterplot showing the relationship between the frequency of p16INK4A+ cells (b) and donor age (c) with the frequency of TAF+ cells in the interstitial dermis of the human skin. d Skin sections were stained for DAPI (blue), TelC (red punctate intranuclear), γH2AX S139 (green) and HLA-E (white). Telomere-associated γH2AX foci (TAF) are shown (white arrow heads) in senescent HLA-E+ cells (yellow asterisks) of the human dermis. The signal intensity of TelC and γH2AX along lines (a) and (b) are represented in histogram format and both signals overlap in the senescent, but not the non-senescent cell. e Correlation of HLA-E+ cells and TAF+ cells in the interstitial dermis of human skin. f Correlation of HLA-E+ cells and p16INK4A+ cells in the interstitial dermis of the human skin. g The frequency of HLA-E+ cells present in the superficial dermis of young (n = 4) and old (n = 5) human skin. h The frequency of HLA-E+ cells in the TAF+ and TAF populations in the dermis of young (n = 4) and old (n = 5) human skin. The data are represented as mean ± SEM. Statistical significance calculated with Mann–Whitney U test. *p < 0.05, **p < 0.01, ***p < 0.001, ****p < 0.0001

Similar articles

Cited by

References

    1. Campisi J. Aging, cellular senescence, and cancer. Annu. Rev. Physiol. 2013;75:685–705. doi: 10.1146/annurev-physiol-030212-183653. - DOI - PMC - PubMed
    1. Demaria M, et al. An essential role for senescent cells in optimal wound healing through secretion of PDGF-AA. Dev. cell. 2014;31:722–733. doi: 10.1016/j.devcel.2014.11.012. - DOI - PMC - PubMed
    1. Ritschka B, et al. The senescence-associated secretory phenotype induces cellular plasticity and tissue regeneration. Genes Dev. 2017;31:172–183. doi: 10.1101/gad.290635.116. - DOI - PMC - PubMed
    1. van Deursen JM. The role of senescent cells in ageing. Nature. 2014;509:439–446. doi: 10.1038/nature13193. - DOI - PMC - PubMed
    1. Baker DJ, et al. Clearance of p16Ink4a-positive senescent cells delays ageing-associated disorders. Nature. 2011;479:232–236. doi: 10.1038/nature10600. - DOI - PMC - PubMed

Publication types

MeSH terms

Substances