Fecal Metabolomics and Potential Biomarkers for Systemic Lupus Erythematosus
- PMID: 31130958
- PMCID: PMC6509220
- DOI: 10.3389/fimmu.2019.00976
Fecal Metabolomics and Potential Biomarkers for Systemic Lupus Erythematosus
Abstract
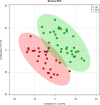
The role of metabolomics in autoimmune diseases has been a rapidly expanding area in researches over the last decade, while its pathophysiologic impact on systemic lupus erythematosus (SLE) remains poorly elucidated. In this study, we analyzed the metabolic profiling of fecal samples from SLE patients and healthy controls based on ultra-high-performance liquid chromatography equipped with mass spectrometry for exploring the potential biomarkers of SLE. The results showed that 23 differential metabolites and 5 perturbed pathways were identified between the two groups, including aminoacyl-tRNA biosynthesis, thiamine metabolism, nitrogen metabolism, tryptophan metabolism, and cyanoamino acid metabolism. In addition, logistic regression and ROC analysis were used to establish a diagnostic model for distinguishing SLE patients from healthy controls. The combined model of fecal PG 27:2 and proline achieved an area under the ROC curve of 0.846, and had a good diagnostic efficacy. In the present study, we analyzed the correlations between fecal metabolic perturbations and SLE pathogenesis. In summary, we firstly illustrate the comprehensive metabolic profiles of feces in SLE patients, suggesting that the fecal metabolites could be used as the potential non-invasive biomarkers for SLE.
Keywords: biomarker; feces; liquid chromatography; mass spectrometry; metabolomics; systemic lupus erythematosus.
Figures


Similar articles
-
Fecal Metabolites Were Altered, Identified as Biomarkers and Correlated With Disease Activity in Patients With Systemic Lupus Erythematosus in a GC-MS-Based Metabolomics Study.Front Immunol. 2020 Sep 10;11:2138. doi: 10.3389/fimmu.2020.02138. eCollection 2020. Front Immunol. 2020. PMID: 33013903 Free PMC article.
-
Urinary metabolomic profiling of a cohort of Colombian patients with systemic lupus erythematosus.Sci Rep. 2024 Apr 25;14(1):9555. doi: 10.1038/s41598-024-60217-0. Sci Rep. 2024. PMID: 38664528 Free PMC article.
-
Urinary metabolomic study of systemic lupus erythematosus based on gas chromatography/mass spectrometry.Biomed Chromatogr. 2016 Nov;30(11):1877-1881. doi: 10.1002/bmc.3734. Epub 2016 May 12. Biomed Chromatogr. 2016. PMID: 27061577
-
Caution in studying and interpreting the lupus metabolome.Arthritis Res Ther. 2020 Jul 17;22(1):172. doi: 10.1186/s13075-020-02264-2. Arthritis Res Ther. 2020. PMID: 32680552 Free PMC article. Review.
-
Advances in applying of multi-omics approaches in the research of systemic lupus erythematosus.Int Rev Immunol. 2020;39(4):163-173. doi: 10.1080/08830185.2020.1736058. Epub 2020 Mar 6. Int Rev Immunol. 2020. PMID: 32138562 Review.
Cited by
-
A Novel Microbial Dysbiosis Index and Intestinal Microbiota-Associated Markers as Tools of Precision Medicine in Inflammatory Bowel Disease Paediatric Patients.Int J Mol Sci. 2024 Sep 5;25(17):9618. doi: 10.3390/ijms25179618. Int J Mol Sci. 2024. PMID: 39273567 Free PMC article.
-
Gut microbiota modulation enhances the immune capacity of lizards under climate warming.Microbiome. 2024 Feb 22;12(1):37. doi: 10.1186/s40168-023-01736-2. Microbiome. 2024. PMID: 38388458 Free PMC article.
-
Metabolomics profiling reveals low blood tyrosine levels as a metabolic feature of newborns from systemic lupus erythematosus pregnancies.Front Immunol. 2024 Jan 31;15:1335042. doi: 10.3389/fimmu.2024.1335042. eCollection 2024. Front Immunol. 2024. PMID: 38357540 Free PMC article.
-
Dietary tryptophan and genetic susceptibility expand gut microbiota that promote systemic autoimmune activation.bioRxiv [Preprint]. 2024 Jan 19:2024.01.16.575942. doi: 10.1101/2024.01.16.575942. bioRxiv. 2024. PMID: 38293097 Free PMC article. Preprint.
-
GC/MS and LC/MS serum metabolomic analysis of Chinese LN patients.Sci Rep. 2024 Jan 17;14(1):1523. doi: 10.1038/s41598-024-52137-w. Sci Rep. 2024. PMID: 38233574 Free PMC article.
References
Publication types
MeSH terms
Substances
LinkOut - more resources
Full Text Sources
Medical

