. 2019 Jun 6;6(3):ENEURO.0503-18.2019.
doi: 10.1523/ENEURO.0503-18.2019. Print 2019 May/Jun.

Pannexin 1 Regulates Network Ensembles and Dendritic Spine Development in Cortical Neurons

Affiliations

Pannexin 1 Regulates Network Ensembles and Dendritic Spine Development in Cortical Neurons

Juan C Sanchez-Arias et al. eNeuro. .

Abstract

Dendritic spines are the postsynaptic targets of excitatory synaptic inputs that undergo extensive proliferation and maturation during the first postnatal month in mice. However, our understanding of the molecular mechanisms that regulate spines during this critical period is limited. Previous work has shown that pannexin 1 (Panx1) regulates neurite growth and synaptic plasticity. We therefore investigated the impact of global Panx1 KO on spontaneous cortical neuron activity using Ca2+ imaging and in silico network analysis. Panx1 KO increased both the number and size of spontaneous co-active cortical neuron network ensembles. To understand the basis for these findings, we investigated Panx1 expression in postnatal synaptosome preparations from early postnatal mouse cortex. Between 2 and 4 postnatal weeks, we observed a precipitous drop in cortical synaptosome protein levels of Panx1, suggesting it regulates synapse proliferation and/or maturation. At the same time points, we observed significant enrichment of the excitatory postsynaptic density proteins PSD-95, GluA1, and GluN2a in cortical synaptosomes from global Panx1 knock-out mice. Ex vivo analysis of pyramidal neuron structure in somatosensory cortex revealed a consistent increase in dendritic spine densities in both male and female Panx1 KO mice. Similar findings were observed in an excitatory neuron-specific Panx1 KO line (Emx1-Cre driven; Panx1 cKOE) and in primary Panx1 KO cortical neurons cultured in vitro. Altogether, our study suggests that Panx1 negatively regulates cortical dendritic spine development.

Keywords: cortical neuron; critical period; dendritic spines; network ensembles; pannexin; somatosensory.


Figures

None
Graphical abstract
Figure 1.
Figure 1.
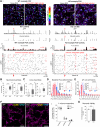
Increased network ensembles and altered Ca2+ dynamics in Panx1 KO cortical neurons. A, Representative analyses for functional connectivity in WT and Panx1 KO primary cortical neuron cultures. Ca2+ imaging data were collected using confocal microscopy in DIV12-14 primary cortical neurons using Fluo-4-AM. A MATLAB based program called FluoroSNNAP was used to determine network ensemble properties. Ai, Confocal micrographs of exemplary FOVs of WT and Panx1 KO (labeled KO) demonstrating Fluo-4-derived Ca2+ activity from low and high activity frames (as indicated), along with the FluoroSNNAP output ΔF/F (middle) and inferred spikes (bottom) from the identified WT (75) and KO (85) cells. Aii, Percentage of active neurons in each frame from the example FOVs (top). The red line indicates the threshold for a statistically significant number of coactive cells in a frame used by FluoroSNNAP (3 SD). Raster plots of WT and KO example FOVs (bottom) generated from thresholded spike probability data. Spikes from cells participating in a network ensemble are shown in red. The exemplary high activity frames and cells from A are also highlighted in red. B, Network ensemble data from WT and Panx1 KO DIV12-14 primary neuron cultures. Bi, The mean number of network ensembles was increased in Panx1 KO cultures (WT: 4.0 ± 0.6, KO: 7.6 ± 0.7 network ensembles; t(13) = 4.1, p = 0.0014a1; n = 7–8 coverslips from 3 independent cultures; **p < 0.01). Bii, The number of cells involved in network ensembles was also increased in Panx1 KO neurons (WT: 5.0 ± 0.6, KO: 8.5 ± 0.6 cell per ensemble; t(13) = 4.4, p < 0.0001a2; n = 20–21 network ensembles from 3 independent cultures; ****p < 0.0001). C, Core network ensemble data from WT and Panx1 KO DIV12-14 primary neuron cultures. Ci, The mean number of core ensembles (co-activated neurons participating in more than one ensemble) was increased in Panx1 KO cultures (WT: 1.2 ± 0.3, KO: 2.7 ± 0.5 core ensembles; t(39) = 2.8, p = 0.0071b1; n = 20–21 network ensembles from 3 independent cultures; **p < 0.01). Cii, The number of cells forming a core ensemble was not significant different between the analyzed groups (WT: 3.1 ± 0.3, KO: 3.7 ± 0.3 cells per core ensemble; t(30) = 1.3, p = 0.1968b2; n = 12–20 core ensembles from 3 independent cultures; n.s., not significant). D, Distributions and violin plots of resting and total change (maximum minus minimum) of Fluo-4 fluorescence intensities in DIV12-14 primary cortical neuronal cultures. Di, Frequency distributions of Fluo-4 Ca2+ indicator dye fluorescence intensities of WT (red) and Panx1 KO (blue) revealed a right shift toward higher median Ca2+ levels at baseline (defined the as raw median fluorescence intensity value for each neuron; WT median = 37, n = 1017 cells; KO median = 58.50, n = 1089 cells; p < 0.0001c; Mann–Whitney U = 316,969; data compiled from 7 to 8 coverslips from 3 independent cultures per condition; ****p < 0.0001). Dotted lines represent the mean of each distribution; a.u., arbitrary units. E, Similarly, the difference between the maximum and minimum fluorescence intensity values (ΔF, fluorescence intensity range) was right-shifted and significant larger in Panx1 KO neurons (WT median = 16, n = 1017 cells; KO median = 25, n = 1089 cells; p < 0.0001d; Mann–Whitney U = 294,294; data compiled from a total of 7–8 coverslips across 3 independent cultures per condition; ****p < 0.0001). Dotted lines represent the mean of each distribution; a.u., arbitrary units. F, WT and Panx1 KO cortical neuronal cultures have a similar cell-type composition. Fi, Representative images of WT and Panx1 KO cortical neurons labeled with the pan-neuronal marker MAP2, interneuron marker Gad67, and the astrocytic marker GFAP. Scale bar, 100 µm. Fii, The proportion of excitatory neurons, inhibitory neurons, and astrocytes was similar between groups (WT excitatory neurons = 81.4% ± 1.3%, KO excitatory neurons = 79.8% ± 1.6%, p = 0.9702e8; WT inhibitory neurons = 17.1% ± 1.3%, KO inhibitory neurons = 15.2% ± 1.0%, p = 0.7500e9; WT astrocytes = 1.5% ± 0.4%, KO astrocytes = 4.9% ± 1.0%, p = 0.1026e10; simple-effect ANOVA with Bonferroni’s multiple-comparison test, n = 16 FOV from 2 independent cultures; n.s., not significant). G, WT and Panx1 cortical neurons exhibited similar cell viability. Conversion of MTT to formazan (absorbance measured at 540 nm) was not significant between groups (WT = 100% ± 2.5%, KO = 98.62% ± 8.5%; p = 0.9089f; t(4) = 0.128; n = 3 independent cultures; n.s., not significant). Data are presented as mean ± SEM.
Figure 2.
Figure 2.
Panx1 is enriched in synaptic compartments. A, Synaptic protein extraction and isolation revealed Panx1 enrichment in cortical synaptic compartments. Ai, Protocol for synaptosome preparation from dissected cortical tissue using SynPer. Aii, Western blot of subcellular fractionations obtained from a P14 WT brain and probed with PSD-95 (top), Panx1 (second panel), and GFAP (third panel), with Stain-Free (total protein) at the bottom, demonstrating enrichment of PSD-95 in the P3 fraction (synaptosomes) and exclusion of GFAP (negative control). Aiii, Quantification of Panx1 enrichment in synaptic compartments as determined by higher immunoreactivity in P3 (synaptosomes) relative to homogenate. As expected, PSD-95 was also enriched in P3 (Panx1, p = 0.0093g6,8; PSD-95, p < 0.0001g5,7; simple-effect ANOVA with Bonferroni’s multiple-comparison test; n = 3 animals; **p < 0.01, ****p < 0.0001). B, Panx1 cortical expression is developmentally down regulated. Bi, Western blot of WT dissected whole cortical tissues from P7-P63 animals, probed with Panx1 (top), and Stain-Free (total protein) at the bottom. Bii, Panx1 expression decreased with age (age: F(3,8) = 365.9, p < 0.0001h1; n = 3 animals per group; ****p < 0.0001) with levels markedly dropping from P7 to P14 (p < 0.0001h2; P14–P29, p = 0.0006h3; P29–P63, p = 0.9604h4; one-way ANOVA with Bonferroni’s comparison test; n = 3 animals per age group; ***p < 0.001; ****p < 0.0001; n.s., not significant). Data are presented as mean ± SEM.
Figure 3.
Figure 3.
Increased PSD-95 and altered postsynaptic receptor expression in Panx1 KO cortical synaptosomes. A, Representative Western blots of cortical synaptosome preparations from WT and Panx1 KO (P14 and P29) probed for Panx1, PSD-95, and glutamate postsynaptic receptor subunits (GluA1, GluA2, GluN1, GluN2A, GluN2B). The Bio-Rad Stain-Free reagent (bottom) was used to quantify total protein for normalization. Molecular weight markers are indicated in kilodaltons. B, Quantification of protein expression levels of Panx1, PSD-95, and post-synaptic glutamate receptors. Expression levels for each protein were normalized to total protein and expressed as a percentage of WT P14 values; n = 5 animals per group analyzed in five independent experiments. Panx1 significantly decreased from P14 to P29 in WT cortical synaptosomes (P14 = 100 ± 9.4%; P29 = 13.4 ± 1.2%, p < 0.0001i3,4,7; simple effect ANOVA with Bonferroni’s multiple-comparison test; ****p < 0.0001). No Panx1 signal was detected in Panx1 KO cortical synaptosomes. PSD-95 significantly increased with age in both WT and Panx1 KO, and was also significantly higher in Panx1 KO relative to WT within age-matched controls (age: F(1,16) = 37.4, p < 0.0001j3; genotype: F(1,6 = 175.8, p < 0.0001j2; interaction: F(1,16) = 4.2, p = 0.0570j1; two-way ANOVA with Bonferroni’s multiple-comparison test; WT P14 = 100 ± 8.5%, KO P14 = 179.2 ± 9.1%, p < 0.0001j4; WT P29 = 248.5 ± 9.0%, KO P29 = 287.9 ± 11.8%, p = 0.0220j5; *p < 0.05, ****p < 0.0001). GluA1 and GluN2a also exhibited age-matched increases in expression in Panx1 KO cortical synaptosomes (GluA1: genotype, F(1,16) = 9.090, WT P14 = 100 ± 7.2%, KO P14 = 155.6 ± 24.4%; WT P29 = 93.42 ± 14.9%, KO P29 = 168.4 ± 31.7%, p = 0.0082k2; GluN2A: F(1,16) = 7.892, WT P14 = 100 ± 12.2%, KO P14 = 167.8 ± 31.20%; WT P29 = 121.4 ± 23.2%, KO P29 = 201.3 ± 33.3%, p = 0.0126n2); *p < 0.05, **p < 0.01, GluN1 developmental upregulation was more pronounced in the WT group (p = 0.0009m1-8); ***p < 0.001, whereas GluN2B immunoreactivity in Panx1 KO synaptosomes exhibited a steeper developmental decline at P29 compared to WT (age: F(1,16) = 4.547, p = 0.0488o3; WT P14 = 100 ± 6.5%, WT P29 = 97.1 ± 16.6%, p > 0.9999o4; KO P14 = 133.1 ± 11.9%, KO P29 = 88.6 ± 5.9%; p = 0.0240o5; two-way ANOVA with Bonferroni’s multiple-comparison test; *p < 0.05). Data are presented as mean ± SEM. For additional statistical information, see Table 1i1-o5.
Figure 4.
Figure 4.
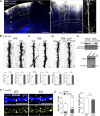
Increased dendritic spine density in Panx1 KO cortical neurons. A, Experimental setup for DiI labeling of apical dendrites of layer 5 somatosensory neurons ex vivo. On the left is a representative micrograph of a WT P14 mouse cortex labeled on the pial surface with DiI with an overlay delimiting the somatosensory cortex and cortical layers. A yellow arrow denotes the cell bodies of the layer 5 cortical neuron, shown in the inset; scale bar, 100 µm. On the right, a 100 µm segment of the primary apical dendrite of the cell in the inset, traversing layer 2/3; scale bar, 20 µm. Scale bar, 500 µm. B, Increased dendritic spine density in Panx1 KO cortical neurons. Bi, Representative maximum intensity projections of Panx1 WT (left) and Panx1 KO (right) neurons at P14. Scale bar, 1 µm. Average spine density was significantly higher in Panx1 KO (WT, 13.7 ± 0.7 spines per 10 µm; KO, 17.2 ± 0.5 spines per 10 µm, p = 0.0014p1; t(14) = 3.9, unpaired t test, n = 8 animals per genotype; **p < 0.01). Average spine length was not significantly different (WT, 1.64 ± 0.06 µm; KO, 1.58 ± 0.04 µm, p = 0.4133p2; t(14) = 0.8, unpaired t test, n = 8 animals per genotype; n.s., not significant). Bii, At P29. average spine density was significantly higher in Panx1 KO (WT, 20.3 ± 0.5 spines per 10 µm; KO, 25.6 ± 0.8 spines per 10 µm; t(12) = 5.8, p < 0.0001q1, unpaired t test, n = 7 animals per genotype; ****p < 0.0001). Average spine length was not significantly different (WT, 1.47 ± 0.01 µm; KO, 1.50 ± 0.03 µm, p = 0.4274q2; t(12) = 0.8, unpaired t test, n = 8 animals per genotype; n.s., not significant). Biii, Similarly, average spine density was significantly higher at P29 in a conditional excitatory neocortical pyramidal cell Panx1 KO (Emx1IRES-Cre/+;Panx1f/f, Panx1 cKOE) compared with Panx1f/f littermate controls (Panx1f/f, 18.2 ± 1.4 spines per 10 µm; cKOE, 25.3 ± 0.8 spines per 10 µm t(4) = 4.6; p = 0.0104r1, unpaired t test, n = 3 mice per genotype; *p < 0.05). Average spine length was not significantly different (Panx1f/f, 1.43 ± 0.03 µm; cKOE, 1.50 ± 0.08 µm, p = 0.4326p2; t(4) = 0.9, unpaired t test, n = 3 animals per genotype; n.s., not significant). Data are represented as mean ± SEM. Biv, Top, representative Western blot of cortical (Cx) and cerebellar (Cb) lysates from control (Panx1f/f) and Panx1 cKOE mice. Bottom, Genotyping results assaying for the presence of Cre and Emx1 in Panx1f/f and Panx1 cKOE. See Methods for more details. Ci, Increased dendritic spine density and PSD-95-positive spine density in cultured cortical neurons at DIV12-14. Representative maximum intensity projections of primary neurite (longest neurite) distal segments from WT and Panx1 KO cultured cortical neurons. Dendritic spines were identified using the phalloidin (F-actin; blue). PSD-95 puncta (white) were quantified (PSD-95+ spines). Scale bar, 10 µm. Cii, Quantification revealed increased mean spine density (WT, 10 ± 0.6 spines per 10 µm; KO, 16 ± 0.5 spines per 10 µm, t(25) = 8.4, p < 0.0001s1; unpaired t test, n = 10–17 cells from 3 independent cultures; ****p < 0.0001), and increased density of PSD-95-positive spines in Panx1 KO cultured cortical neurons (WT, 1.5 ± 0.3 spines per 10 µm; KO, 3.9 ± 0.6 spines per 10 µm, t(25) = 4.2, p = 0.003s2; unpaired t test, n = 10–17 neurons from 3 independent cultures; ***p < 0.001). Spine length was not different between groups (p = 0.2047s3). Data are presented as mean ± SEM.

Similar articles

Cited by

References

    1. Alvarez VA, Sabatini BL (2007) Anatomical and physiological plasticity of dendritic spines. Annu Rev Neurosci 30:79–97. 10.1146/annurev.neuro.30.051606.094222 - DOI - PubMed
    1. Arce-McShane FI, Ross CF, Takahashi K, Sessle BJ, Hatsopoulos NG (2016) Primary motor and sensory cortical areas communicate via spatiotemporally coordinated networks at multiple frequencies. Proc Natl Acad Sci U S A 113:5083–5088. 10.1073/pnas.1600788113 - DOI - PMC - PubMed
    1. Ardiles AO, Flores-Muñoz C, Toro-Ayala G, Cárdenas AM, Palacios AG, Muñoz P, Fuenzalida M, Saez JC, Martínez AD (2014) Pannexin 1 regulates bidirectional hippocampal synaptic plasticity in adult mice. Front Cell Neurosci 8:326. 10.3389/fncel.2014.00326 - DOI - PMC - PubMed
    1. Awad PN, Amegandjin CA, Szczurkowska J, Carriço JN, Fernandes do Nascimento AS, Baho E, Chattopadhyaya B, Cancedda L, Carmant L, Di Cristo G (2018) KCC2 regulates dendritic spine formation in a brain-region specific and BDNF dependent manner. Cereb Cortex 28:4049–4062. 10.1093/cercor/bhy198 - DOI - PMC - PubMed
    1. Bardy C, Hurk M van den, Eames T, Marchand C, Hernandez RV, Kellogg M, Gorris M, Galet B, Palomares V, Brown J, Bang AG, Mertens J, Böhnke L, Boyer L, Simon S, Gage FH (2015) Neuronal medium that supports basic synaptic functions and activity of human neurons in vitro. Proc Natl Acad Sci USA 112:E2725–E2734. 10.1073/pnas.1504393112 - DOI - PMC - PubMed

Publication types

MeSH terms