. 2019 May 16;14(5):e0216705.
doi: 10.1371/journal.pone.0216705. eCollection 2019.

CiliaCarta: An integrated and validated compendium of ciliary genes

Affiliations

CiliaCarta: An integrated and validated compendium of ciliary genes

Teunis J P van Dam et al. PLoS One. .

Abstract

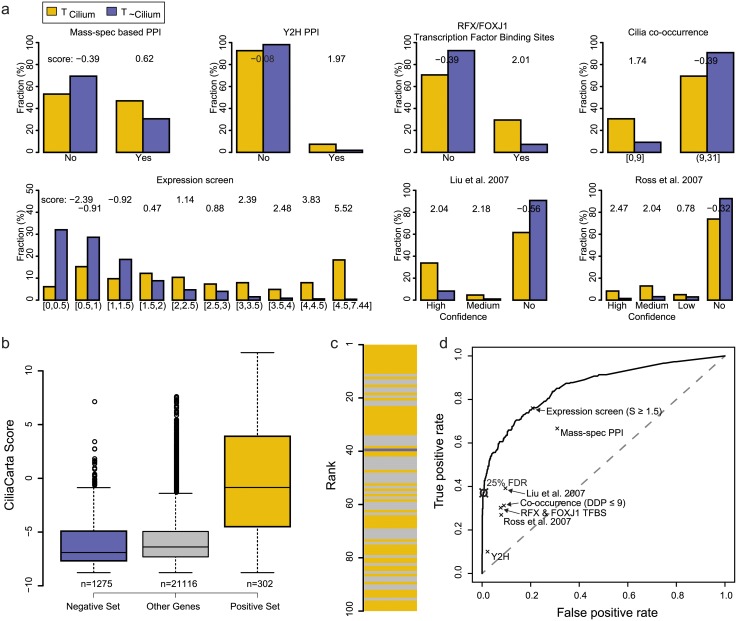
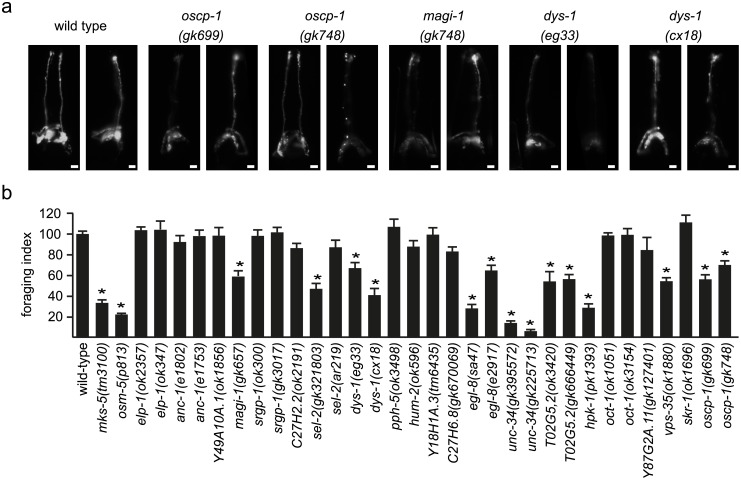
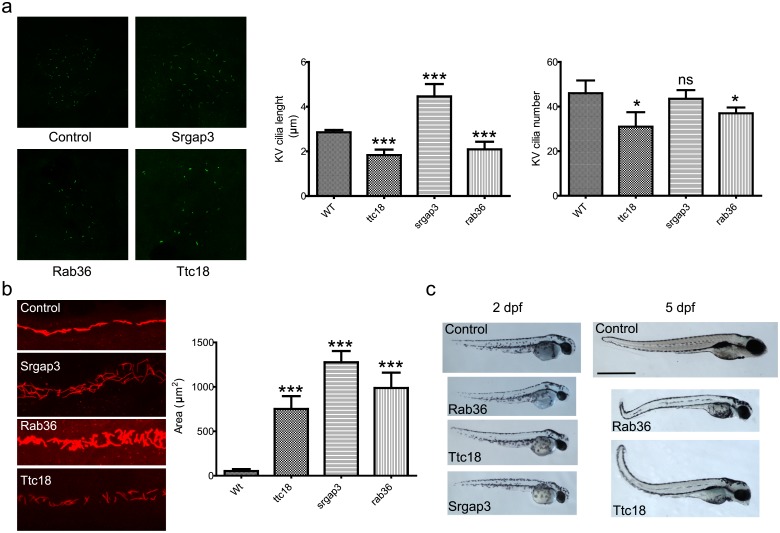
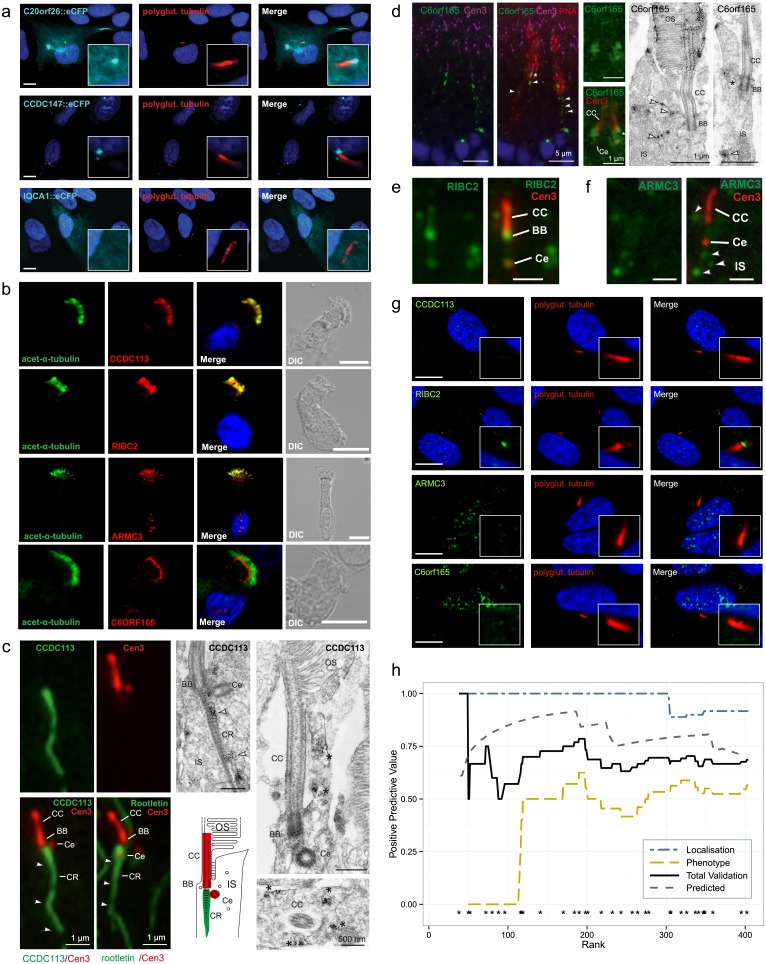
The cilium is an essential organelle at the surface of mammalian cells whose dysfunction causes a wide range of genetic diseases collectively called ciliopathies. The current rate at which new ciliopathy genes are identified suggests that many ciliary components remain undiscovered. We generated and rigorously analyzed genomic, proteomic, transcriptomic and evolutionary data and systematically integrated these using Bayesian statistics into a predictive score for ciliary function. This resulted in 285 candidate ciliary genes. We generated independent experimental evidence of ciliary associations for 24 out of 36 analyzed candidate proteins using multiple cell and animal model systems (mouse, zebrafish and nematode) and techniques. For example, we show that OSCP1, which has previously been implicated in two distinct non-ciliary processes, causes ciliogenic and ciliopathy-associated tissue phenotypes when depleted in zebrafish. The candidate list forms the basis of CiliaCarta, a comprehensive ciliary compendium covering 956 genes. The resource can be used to objectively prioritize candidate genes in whole exome or genome sequencing of ciliopathy patients and can be accessed at http://bioinformatics.bio.uu.nl/john/syscilia/ciliacarta/.


Conflict of interest statement

The authors have declared that no competing interests exist.

Figures

Fig 1
Fig 1. Data sets and performance of the Bayesian classifier for predicting ciliary genes.
A) For each data set the fraction of positive (TCilium) and negative gene sets (T~Cilium) and the log-likelihood scores are displayed per sub-category. B) Distributions of the integrated CiliaCarta scores for the negative set, the positive set, and the remaining unassigned genes. The positive set has significantly higher scores than the negative set (p-value: 2.8e-85 Mann-Whitney U test). C) Top 100 scoring genes. Known ciliary genes from the positive set are in yellow, genes from the negative set are in blue. High scoring genes in grey are prime candidate novel ciliary genes. D) Receiver-Operator Characteristics curve showing the performance of the Bayesian classifier as a function of the CiliaCarta Score and the performance of the individual data sets.
Fig 2
Fig 2. Validation by worm phenotype.
A) C. elegans dye uptake assay. In wild type worms, DiI dye is taken up by 6 pairs of amphid (head) and one pair of phasmid (tail; not shown) neurons via their environmentally exposed sensory cilia. In the mutants shown, the amount of incorporated dye is modestly reduced, although most or all neurons still uptake the dye. The mks-5 mutant functions as control for ciliary disfunction. Scale bars: 20 μm. B) Single worm roaming assays. Bars represent mean ± S.E.M (n≥20) independent experiments), normalized to wild type control. * p<0.05 (unpaired t-test; vs. WT).
Fig 3
Fig 3. Validation by zebrafish phenotype.
A) Cilia length and number in zebrafish Kupffer’s vesicles. The length and number of cilia in ttc18 and rab36 morphants are significantly reduced (p<0.001 and p<0.05 resp.). Cilia in srgap3 morphants are elongated (p<0.001) but the number of cilia is normal. Bars represent mean ± S.E.M. B) Pronephric ducts in 24 hpf morphants. Cilia are stained with antibodies against acetylated alpha tubulin. The pronephric ducts are significantly enlarged for all three morphants compared to wild type (p<0.001). Bars represent mean ± S.E.M. C) Whole embryo phenotype 2 days post fertilization (dpf) and 5 dpf zebrafish control and morphant embryos. All morphants exhibit the body curvature that is characteristic for cilia dysfunction. Note that in our screening we did not manage to obtain surviving srgap3 morphants past 3 dpf.
Fig 4
Fig 4. Validation by ciliary localization.
A) Fluorescence microscopy of eCFP fused to C20orf26, CCDC147 and IQCA1 in hTERT-RPE1 cells. Acetylated alpha tubulin (red) is used to mark the axoneme. DAPI (blue) staining is used to mark the cell nucleus. IQCA1 does not appear to co-localize with acetylated alpha tubulin. B) Localization of CCDC113, RIBC2, ARMC3 and C6orf165 (red) compared with acetylated alpha tubulin (green) in human lung epithelial cells. C) Localization of CCDC113 in the primary sensory cilium of mature mouse photoreceptor cells. On the left: indirect 2-color immunofluorescence of CCDC113 (green) and centrin-3 (Cen3, red), a marker protein for the connecting cilium (CC), the basal body (BB) and the adjacent centriole (Ce), and of the ciliary rootlet (CR) marker rootletin (green) and Cen3 (red) indicates the localization of CCDC113 at the ciliary base and the CR projecting into the inner segment (IS). On the right: immunoelectron microscopy of CCDC113 confirms the localization of CCDC113 at the CR (arrowheads) and demonstrates accumulation of CCDC113 in the periciliary region of photoreceptor cells (asterisks). D) On the left: localization of C6orf165 in the primary sensory cilium of mature mouse cone photoreceptor cells. Indirect double immunofluorescence of C6orf165 (green) and Cen3 (magenta) in combination with the counterstaining with fluorescent PNA (red) revealed the localization of C6orf165 at the BB and the Ce of cone photoreceptors and a punctate staining in the IS (arrowheads). At the center: higher magnification of the double immunofluorescence of C6orf165 (green) and Cen3 (red). On the right: immunoelectron microscopy of the ciliary region of photoreceptors confirmed the ciliary and periciliary localization (asterisks) of C6orf165, but also demonstrated its presence in outer segments (OS) of cones. E) Double immunofluorescence of RIBC2 (green) and Cen3 (red) of a photoreceptor cilium showed localization of RIBC2 throughout the connecting cilium (CC) and the adjacent centriole (Ce) as seen by co-localization with the ciliary marker Cen3. F) Double immunofluorescence of ARMC3 (green) and Cen3 (red) of a photoreceptor cilium revealed the absence of ARMC3 from the CC (counterstained for Cen3) but a punctate staining in the periciliary region of the photoreceptor IS (arrowheads). G) Localization of CCDC113, RIBC2, ARM3 and C6orf165 compared with polyglutamylated tubulin in hTERT-RPE1 cells. H) Positive predictive value (PPV) of the Bayesian classifier based on the experimental validation outcomes plotted against CiliaCarta gene rank. The PPV of the combined validation converges to 0.67, which equals the predicted PPV (0.67, given 0.33 FDR). The asterisks (*) above the x-axis denote the ranks of the candidate genes and proteins tested for ciliary function or localization.
Fig 5
Fig 5. OSCP1 localizes to the cilium and regulates ciliary function in vivo.
A) GFP-tagged OSCP-1 driven by its endogenous promoter is specifically expressed in ciliated sensory neurons in C. elegans, and the GFP-fusion protein is concentrated along the length of the cilium. Shown are fluorescent images of OSCP-1::GFP and XBX-1::tdTomato (ciliary marker) localization in amphid and phasmid cilia. Basal bodies (bb) and cilia are indicated. B) OSCP1::eCFP localization in hTERT-RPE1 cells. OSCP1 localizes to the basal body and daughter centriole as well as in the cytosol in a punctate manner. C) OSCP1 localization in human respiratory cells (red) co-stained with acetylated tubulin (green). OSCP1 localizes to the cytosol, but specifically to the base of the ciliated crown of these multi-ciliated cells. D) Indirect high magnification immunofluorescence of OSCP1 (green) and centrin-3 (Cen3, red), a marker protein for the connecting cilium (CC), the basal body (BB) and the adjacent centriole (Ce), in the photoreceptor cilium region of an adult mouse. Immunoelectron microscopy of CCDC113 confirms the localization of OSCP1 at the base of the cilium. The schematic represents a zoom of the ciliary region of a photoreceptor stained for OSCP1 and Cen3 in the according colors. IS, inner segment; OS, outer segment. E) Immunostaining of serum-starved murine IMCD3 cells with OSCP1 antibodies. OSCP1 is expressed in a punctate pattern along the axoneme. Acetylated tubulin and γ-tubulin (green), OSCP1 (Proteintech, 12598-1-AP, red) and nuclei (blue). Scale bar 5 μm. F) Zebrafish embryos injected with 4 ng of oscp1 splice morpholino 2 and 4 days post-fertilization (dpf). The characteristic ciliary phenotype with a curved body, small eyes and melanocyte migration defects at 2dpf. 4 dpf morphants display obvious pronephric cysts, small eyes, heart edemas, small heads and short bodies. Scale bar 500 μm. G) Left panel: details of the head of 2 dpf zebrafish embryos showing small eyes and small head in the oscp1 morphants. Scale bar 500 μm. Right panel: dorsal view of 4 dpf zebrafish embryos. Left embryo is a 4dpf oscp1 morphant. Right embryo is a control. Scale bar 200 μm. Note the small eyes, melanocyte migration defects and small fin buds (white arrows) in the oscp1 morphants compared with the control fin buds (black arrows). H) Immunofluorescence staining of pronephric cilia at 24 hpf (acetylated α-tubulin). 4 ng oscp1 morphants display shortened and disorganized cilia in the medial portion of the pronephric ducts. I) Detail of a pronephric cyst (outlined) in a 4 dpf zebrafish morphant. Scale bar 500 μm. J) Oscp1 morphants Kupffer’s vesicle cilia staining. Oscp1 morphants show smaller Kupffer’s vesicles with reduced cilia number per Kupffer’s vesicle (56 controls vs. 33 oscp1 morphants) and shorter cilia (controls; 7.1 μm vs oscp1 morphants; 5.7 μm. Significance was determined by t-test p-value<0.01. K) Dose dependent phenotype of oscp1 morphants. After injecting 4 ng of oscp1 morpholino the percentage of embryos with a weak phenotype is 51% and embryos with a strong phenotype is 28%. Those percentages change when 6 ng of morpholino are used with 31% of embryos showing with a weak phenotype and 27% with a strong phenotype, (strong and weak phenotypes described in S7 Fig). The number of dead embryos increases when 6ng of oscp1 morpholino are used (38%) compared with 4 ng of oscp1 morpholino (10%). We injected zebrafish embryos at one cell stage with 4 ng of oscp1 morpholino and 100 pg of human OSCP1 mRNA. The rescue increased the normal phenotype percentage from 8% to 43% and decreased the weak phenotype from 51% to 27% and the strong phenotype from 28% to 9.5%. Significance was determined by χ2 test, p<0.0001.

Similar articles

Cited by

References

    1. Yuan S, Sun Z. Expanding horizons: ciliary proteins reach beyond cilia. Annu Rev Genet. Annual Reviews; 2013;47: 353–76. 10.1146/annurev-genet-111212-133243 - DOI - PMC - PubMed
    1. Reiter JF, Leroux MR. Genes and molecular pathways underpinning ciliopathies. Nat Rev Mol Cell Biol. Nature Publishing Group; 2017;18: 533–547. 10.1038/nrm.2017.60 - DOI - PMC - PubMed
    1. Waters AM, Beales PL. Ciliopathies: an expanding disease spectrum. Pediatr Nephrol. Springer Berlin / Heidelberg; 2011; 1–18–18. 10.1007/s00467-010-1731-7 - DOI - PMC - PubMed
    1. Tyler KM, Fridberg A, Toriello KM, Olson CL, Cieslak JA, Hazlett TL, et al. Flagellar membrane localization via association with lipid rafts. J Cell Sci. 2009;122: 859–66. 10.1242/jcs.037721 - DOI - PMC - PubMed
    1. Takao D, Verhey KJ. Gated entry into the ciliary compartment. Cell Mol Life Sci. 2015; 10.1007/s00018-015-2058-0 - DOI - PMC - PubMed

Publication types