. 2019 Dec;15(12):2142-2162.
doi: 10.1080/15548627.2019.1615822. Epub 2019 May 22.

Clearance of damaged mitochondria via mitophagy is important to the protective effect of ischemic preconditioning in kidneys

Affiliations

Clearance of damaged mitochondria via mitophagy is important to the protective effect of ischemic preconditioning in kidneys

Man J Livingston et al. Autophagy. 2019 Dec.

Abstract

Ischemic preconditioning (IPC) affords tissue protection in organs including kidneys; however, the underlying mechanism remains unclear. Here we demonstrate an important role of macroautophagy/autophagy (especially mitophagy) in the protective effect of IPC in kidneys. IPC induced autophagy in renal tubular cells in mice and suppressed subsequent renal ischemia-reperfusion injury (IRI). The protective effect of IPC was abolished by pharmacological inhibitors of autophagy and by the ablation of Atg7 from kidney proximal tubules. Pretreatment with BECN1/Beclin1 peptide induced autophagy and protected against IRI. These results suggest the dependence of IPC protection on renal autophagy. During IPC, the mitophagy regulator PINK1 (PTEN induced putative kinase 1) was activated. Both IPC and BECN1 peptide enhanced mitolysosome formation during renal IRI in mitophagy reporter mice, suggesting that IPC may protect kidneys by activating mitophagy. We further established an in vitro model of IPC by inducing 'chemical ischemia' in kidney proximal tubular cells with carbonyl cyanide 3-chlorophenylhydrazone (CCCP). Brief treatment with CCCP protected against subsequent injury in these cells and the protective effect was abrogated by autophagy inhibition. In vitro IPC increased mitophagosome formation, enhanced the delivery of mitophagosomes to lysosomes, and promoted the clearance of damaged mitochondria during subsequent CCCP treatment. IPC also suppressed mitochondrial depolarization, improved ATP production, and inhibited the generation of reactive oxygen species. Knockdown of Pink1 suppressed mitophagy and reduced the cytoprotective effect of IPC. Together, these results suggest that autophagy, especially mitophagy, plays an important role in the protective effect of IPC.Abbreviations: ACTB: actin, beta; ATG: autophagy related; BNIP3: BCL2 interacting protein 3; BNIP3L/NIX: BCL2 interacting protein 3 like; BUN: blood urea nitrogen; CASP3: caspase 3; CCCP: carbonyl cyanide 3-chlorophenylhydrazone; COX4I1: cytochrome c oxidase subunit 4I1; COX8: cytochrome c oxidase subunit 8; DAPI: 4',6-diamidino-2-phenylindole; DNM1L: dynamin 1 like; EGFP: enhanced green fluorescent protein; EM: electron microscopy; ER: endoplasmic reticulum; FC: floxed control; FIS1: fission, mitochondrial 1; FUNDC1: FUN14 domain containing 1; H-E: hematoxylin-eosin; HIF1A: hypoxia inducible factor 1 subunit alpha; HSPD1: heat shock protein family D (Hsp60) member 1; IMMT/MIC60: inner membrane mitochondrial protein; IPC: ischemic preconditioning; I-R: ischemia-reperfusion; IRI: ischemia-reperfusion injury; JC-1: 5,5',6,6'-tetrachloro-1,1',3,3'-tetraethylbenzimidazolylcarbocyanine iodide; KO: knockout; MAP1LC3B/LC3B: microtubule associated protein 1 light chain 3 beta; mito-QC: mito-quality control; mRFP: monomeric red fluorescent protein; NAC: N-acetylcysteine; PINK1: PTEN induced putative kinase 1; PPIB: peptidylprolyl isomerase B; PRKN: parkin RBR E3 ubiquitin protein ligase; ROS: reactive oxygen species; RPTC: rat proximal tubular cells; SD: standard deviation; sIPC: simulated IPC; SQSTM1/p62: sequestosome 1; TOMM20: translocase of outer mitochondrial membrane 20; TUNEL: terminal deoxynucleotidyl transferase-mediated dUTP nick end labeling.

Keywords: Acute kidney injury; autophagy; ischemic preconditioning; mitophagy; proximal tubule; renal ischemia-reperfusion.


Figures
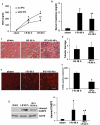
Figure 1.
Figure 1.
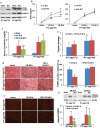
Renal IPC protects against renal IRI in C57BL/6 mice. Mice were subjected to 15-min bilateral renal ischemia followed by 1 h of reperfusion to induce renal IPC. To induce renal IRI, mice were subsequently treated with 27-min bilateral renal ischemia followed by 24 to 48 h of reperfusion (I-R) (sham: n = 3; I-R: n = 7; IPC + I-R: n = 10). Blood and kidneys were collected at the indicated time points for renal function, histology and immunoblot analyses. (a) BUN. (b) Serum creatinine. Data are expressed as mean ± SD. *, P < 0.05, significantly different from the sham group; #, P < 0.05, significantly different from I-R group. (c) Representative histology of renal cortex and outer medulla H-E staining. Scale bar: 50 µm. (d) Pathological score of tubular damage. (e) Representative images of TUNEL staining. Scale bar: 50 µm. (f) Quantification of TUNEL-positive cells. Data in (d and f) are expressed as mean ± SD. *, P < 0.05, significantly different from I-R group. (g) Representative blots and densitometric analysis of cleaved CASP3. ACTB was used as a loading control. After normalization with ACTB, the protein signal of the sham sample was arbitrarily set as 1, and the signals of other conditions were normalized to the sham to calculate fold changes. Data are expressed as mean ± SD. *, P < 0.05, significantly different from the sham group; #, P < 0.05, significantly different from I-R group.
Figure 2.
Figure 2.
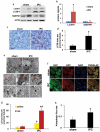
Induction of autophagy in proximal tubules during renal IPC. C57BL/6 (a–e) and CAGp-RFP-GFP-LC3 (f–h) mice were subjected to renal IPC only without subsequent renal IRI (C57BL/6 mice: sham: n = 3; IPC: n = 6; CAGp-RFP-GFP-LC3 mice: n = 3 for each). Kidneys were collected after preconditioning for histological and immunoblot analyses. (a) Representative blots of LC3B and SQSTM1. ACTB was used as a loading control. (b) Densitometric analysis of LC3B-II and SQSTM1. After normalization with ACTB, the protein signals of the sham were arbitrarily set as 1, and the signals of other conditions were normalized to the sham to calculate fold changes. (c) Representative images of immunohistochemical staining of LC3B. Scale bar: 20 µm. (d) Quantitative analysis of punctate LC3B staining. Data in (b and d) are expressed as mean ± SD. *, P < 0.05, significantly different from the sham group. (e) Representative electron micrographs showing autophagic vacuoles (arrows) (n = 2 for each). Scale bar: 2 µm (3 upper panels) and 200 nm (6 lower panels). (f) Representative images of GFP-LC3 and RFP-LC3 fluorescence staining. Scale bar: 15 µm. (g) Quantitative analysis of yellow and red LC3 puncta. Data are expressed as mean ± SD. *, P < 0.05, significantly different from the sham group; #, P < 0.05, values of red LC3 puncta significantly different from the relevant values of yellow LC3 puncta. (h) Analysis of autophagic flux rate. Data are expressed as mean ± SD. *, P < 0.05, significantly different from the sham group.
Figure 3.
Figure 3.
The protective effects of IPC against renal IRI are abrogated in PT-atg7 KO mice. (a) Floxed control (PT-Atg7 FC) and PT-atg7 KO mice were treated with sham or IPC and kidneys were collected for immunoblot analysis of LC3B and SQSTM1 (n = 3 for each). ACTB was used as a loading control. Floxed control and PT-atg7 KO mice were subjected to: (1) sham (n = 3 for each); (2) I-R (n = 8 for FC; n = 9 for KO); (3) IPC + I-R (n = 10 for each). Blood and kidneys were collected at the indicated time points for renal function, histology and immunoblot analyses. (b) BUN. (c) Serum creatinine. Data are expressed as mean ± SD. *, P < 0.05, significantly different from the sham group; #, P < 0.05, significantly different from I-R group. (d) Representative histology of renal cortex and outer medulla H-E staining. Scale bar: 50 µm. (e) Pathological score of tubular damage. (f) Representative images of TUNEL staining. Scale bar: 50 µm. (g) Quantification of TUNEL-positive cells. Data in (e and g) are expressed as mean ± SD. *, P < 0.05, significantly different from I-R group. (h) Representative blots and densitometric analysis of cleaved CASP3. ACTB was used as a loading control. After normalization with ACTB, the protein signal of the sham was arbitrarily set as 1, and the signals of other conditions were normalized to the sham to calculate fold changes. Data are expressed as mean ± SD. *, P < 0.05, significantly different from the sham group; #, P < 0.05, significantly different from I-R group.
Figure 4.
Figure 4.
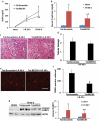
Pharmacological preconditioning with Tat-BECN1 protects against renal IRI in C57BL/6 mice. C57BL/6 mice were pretreated with Tat-BECN1 and its control peptide (Tat-Scramble) at a single dose of 20 mg/kg i.p. injection. Four h after preconditioning, mice were subjected to 27-min bilateral renal ischemia followed by 24 to 48 h of reperfusion (sham: n = 3 for each; Tat-Scramble + I-R: n = 8; Tat-BECN1 + I-R: n = 10). Blood and kidneys were collected at the indicated time points for renal function, histology and immunoblot analyses. (a and b) BUN and serum creatinine. Data are expressed as mean ± SD. *, P < 0.05, significantly different from the sham group; #, P < 0.05, significantly different from Tat-Scramble + I-R group. (c) Representative histology of renal cortex and outer medulla H-E staining. Scale bar: 50 µm. (d) Pathological score of tubular damage. (e) Representative images of TUNEL staining. Scale bar: 50 µm. (f) Quantification of TUNEL-positive cells. Data in (d and f) are expressed as mean ± SD. *, P < 0.05, significantly different from Tat-Scramble + I-R group. (g) Representative blots and densitometric analysis of cleaved CASP3. ACTB was used as a loading control. After normalization with ACTB, the protein signal of Tat-Scramble + sham was arbitrarily set as 1, and the signals of other conditions were normalized to the Tat-Scramble + sham to calculate fold changes. Data are expressed as mean ± SD. *, P < 0.05, significantly different from the sham group; #, P < 0.05, significantly different from Tat-Scramble + I-R group.
Figure 5.
Figure 5.
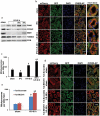
Both renal IPC and Tat-BECN1 preconditioning enhance mitophagy in proximal tubules during subsequent renal IRI in mice. (a) C57BL/6 mice were subjected to: (1) sham (n = 3); (2) I-R (n = 7); (3) IPC + I-R (n = 10). Kidneys were collected for immunoblot analysis of PINK1, COX4I1, IMMT/MIC60, and TOMM20. PPIB (peptidylprolyl isomerase B) was used as a loading control. Mito-QC mice were subjected to: (1) sham (n = 3); (2) IPC (n = 3); (3) I-R (n = 4); (4) IPC + I-R (n = 5). Kidneys were collected to determine mitophagy flux by fluorescence microscopy. (b) Representative images of the formation of mitolysosomes. Scale bar: 20 µm for low magnification and 5 µm for high magnification. (c) Quantitative analysis of the number of mitolysosomes per 400× field (renal cortex and outer stripe of outer medulla, glomeruli excluded). Data are expressed as mean ± SD. *, P < 0.05, significantly different from the sham group; #, P < 0.05, significantly different from I-R group. Furthermore, mito-QC mice were pretreated with Tat-BECN1 and its control peptide (Tat-Scramble) at a single dose of 20 mg/kg i.p. injection. Four h after preconditioning, mice were subjected to sham surgery or 27-min bilateral renal ischemia followed by 48 h of reperfusion (n = 3 for each). Kidneys were collected to determine mitophagy flux by fluorescence microscopy. (d) Representative images of the formation of mitolysosomes. Scale bar: 20 µm. (e) Quantitative analysis of the number of mitolysosomes per 400× field (renal cortex and outer stripe of outer medulla, glomeruli excluded). Data are expressed as mean ± SD. *, P < 0.05, significantly different from the sham group; #, P < 0.05, significantly different from Tat-Scramble + I-R group.
Figure 6.
Figure 6.
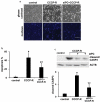
In vitro sIPC attenuates prolonged CCCP-induced apoptosis in RPTC cells. In vitro sIPC was induced by incubating RPTC cells with 20 μM CCCP for 30 min followed by 40 min of recovery. The cells were then treated with prolonged CCCP (20 μM) for 3 h followed by 2 h of recovery to model in vivo renal IRI. Cells were collected for analysis of apoptosis by morphology and caspase activation. (a) Representative images of phase contrast and fluorescence microscopy showing cellular and nuclear morphology of apoptosis. Scale bar: 200 μm. (b) Quantification of cell apoptosis. (c) Representative blots and densitometric analysis of cleaved CASP3. ACTB was used as a loading control. After normalization with ACTB, the protein signal of the control was arbitrarily set as 1, and the signals of other conditions were normalized to the control to calculate fold changes. Data in (b and c) are expressed as mean ± SD. *, P < 0.05, significantly different from the control group; #, P < 0.05, significantly different from CCCP-R group.
Figure 7.
Figure 7.
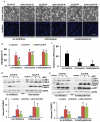
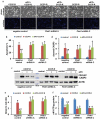
The cytoprotection of in vitro sIPC is diminished by autophagy inhibitors in RPTC cells. RPTC cells were subjected to: (1) control; (2) CCCP-R; (3) sIPC + CCCP-R in the absence or presence of chloroquine (20 μM) and 3-methyladenine (10 mM). Both inhibitors were used for 1-h pretreatment and during 2-h recovery from prolonged CCCP treatment. Cells were collected for morphological and immunoblot analyses. (a) Representative images of phase contrast and fluorescence microscopy showing cellular and nuclear morphology of apoptosis. Scale bar: 200 μm. (b) Quantification of cell apoptosis. Data are expressed as mean ± SD. *, P < 0.05, significantly different from the control group; #, P < 0.05, significantly different from CCCP-R group. (c) Analysis of apoptosis inhibitory efficiency by sIPC. Data are expressed as mean ± SD. *, P < 0.05, significantly different from the group without inhibitors. (d and e) Immunoblots of LC3B and cleaved CASP3. ACTB was used as a loading control. The molecular mass marker lanes were labelled as kDa. For densitometric analysis of cleaved CASP3, after normalization with ACTB, the protein signals of the control were arbitrarily set as 1, and the signals of other conditions were normalized to the control to calculate fold changes. Data are expressed as mean ± SD. *, P < 0.05, significantly different from the control group; #, P < 0.05, significantly different from CCCP-R group.
Figure 8.
Figure 8.
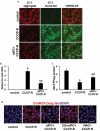
In vitro sIPC suppresses mitochondrial depolarization, improves ATP production and reduces ROS generation in prolonged CCCP-treated RPTC cells. RPTC cells were incubated with 1 μg/ml JC-1 for 1 h and then treated with: (1) control; (2) CCCP-R; (3) sIPC + CCCP-R. Live cells were collected 1 h after reperfusion for fluorescence microscopy. (a) Representative images of JC-1 staining showing red fluorescence of JC-1 aggregate and green signal of monomer. Scale bar: 50 μm. (b) Quantification of the ratio of green to red fluorescence. (c) RPTC cells were subjected to: (1) control; (2) CCCP-R; (3) sIPC + CCCP-R. Thirty min after reperfusion cells were collected for quantitative determination of ATP by a luciferin-luciferase luminescence assay. Data in (b and c) are expressed as mean ± SD. *, P < 0.05, significantly different from the control group; #, P < 0.05, significantly different from CCCP-R group. (d) RPTC cells were subjected to: (1) control; (2) CCCP-R; (3) sIPC + CCCP-R; (4) CQ + sIPC + CCCP-R; (5) NAC + CCCP-R. After treatment cells were incubated with 5 μM CellROX Deep Red reagent for 30 min. ROS generation was visualized by fluorescence microscopy. Scale bar: 50 μm.
Figure 9.
Figure 9.
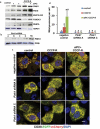
Knockdown of Pink1 inhibits mitophagy flux in CCCP-treated RPTC cells. (a) RPTC cells were subjected to: (1) control; (2) sIPC; (3) CCCP-R; (4) sIPC + CCCP-R. After treatment mitochondrial fractions were collected for immunoblot analysis of multiple mitophagy-related proteins including PINK1, PRKN, BNIP3L/NIX, FUNDC1 and DNM1L. HSPD1, a mitochondrial matrix protein, was used as a loading control. (b) RPTC cells were infected with retroviral Pink1 shRNA constructs (A–D) and a negative control (NC) construct. Upon puromycin selection, stable cells were collected for immunoblot analysis of PINK1. PPIB was used as a loading control. Based on the inhibitory effects, the stable cells (negative control, Pink1 shRNA A, Pink1 shRNA C) were transfected with COX8-EGFP-mCherry and then treated with: (1) control; (2) CCCP-R; (3) sIPC + CCCP-R. Cells were collected for fluorescence microscopy. (c) Representative images of mitolysosome formation. Scale bar: 10 μm. (d) Quantitative analysis of the number of mitolysosomes per cell. Data are expressed as mean ± SD. *, P < 0.05, significantly different from the control group; #, P < 0.05, significantly different from CCCP-R group; ^, P < 0.05, significantly different from the corresponding groups in negative control cells.
Figure 10.
Figure 10.
In vitro sIPC-mediated cytoprotection is compromised by Pink1 knockdown in RPTC cells. RPTC stable cell lines (negative control, Pink1 shRNA A, Pink1 shRNA C) were established as described in Figure 9. The cells were then treated with: (1) control; (2) CCCP-R; (3) sIPC + CCCP-R. After treatment cells were collected for morphological, biochemical and immunoblot analyses. (a) Representative images of phase contrast and fluorescence microscopy showing cellular and nuclear morphology of apoptosis. Scale bar: 200 μm. (b) Quantification of cell apoptosis. (c) Representative images of cleaved CASP3 immunoblot. ACTB was used as a loading control. The molecular mass marker lane was labelled as kDa. (d) Densitometric analysis of cleaved CASP3 immunoblots. After normalization with ACTB, the protein signals of the control in negative control cells were arbitrarily set as 1, and the signals of other conditions were normalized to calculate fold changes. (e) Quantitative analysis of JC-1 staining (the ratio of green to red fluorescence). Cells were loaded with 1 μg/ml JC-1 for 1 h prior to CCCP treatment. Live cells were collected for fluorescence microscopy. (f) Bioluminescence assay of ATP production. Data in (b,d–f) are expressed as mean ± SD. *, P < 0.05, significantly different from the control group; #, P < 0.05, significantly different from CCCP-R group.

Similar articles

Cited by

References

    1. Yellon DM, Downey JM.. Preconditioning the myocardium: from cellular physiology to clinical cardiology. Physiol Rev. 2003. October;83(4):1113–1151. . PubMed PMID: 14506302. - PubMed
    1. Pasupathy S, Homer-Vanniasinkam S. Ischaemic preconditioning protects against ischaemia/reperfusion injury: emerging concepts. Eur J Vasc Endovasc Surg. 2005. February;29(2):106–115. . PubMed PMID: 15649715. - PubMed
    1. Bonventre JV. Kidney ischemic preconditioning. Curr Opin Nephrol Hypertens. 2002. January;11(1):43–48. PubMed PMID: 11753086. - PubMed
    1. Wever KE, Menting TP, Rovers M, et al. Ischemic preconditioning in the animal kidney, a systematic review and meta-analysis. PLoS One. 2012;7(2):e32296 . PubMed PMID: 22389693; PubMed Central PMCID: PMCPMC3289650. - PMC - PubMed
    1. Kapitsinou PP, Haase VH. Molecular mechanisms of ischemic preconditioning in the kidney. Am J Physiol Renal Physiol. 2015. November 15;309(10):F821–34. . PubMed PMID: 26311114; PubMed Central PMCID: PMCPMC4652073. - PMC - PubMed

Publication types

MeSH terms