. 2019 May;569(7758):723-728.
doi: 10.1038/s41586-019-1173-8. Epub 2019 May 1.

Proteomics reveals NNMT as a master metabolic regulator of cancer-associated fibroblasts

Affiliations

Proteomics reveals NNMT as a master metabolic regulator of cancer-associated fibroblasts

Mark A Eckert et al. Nature. 2019 May.

Abstract

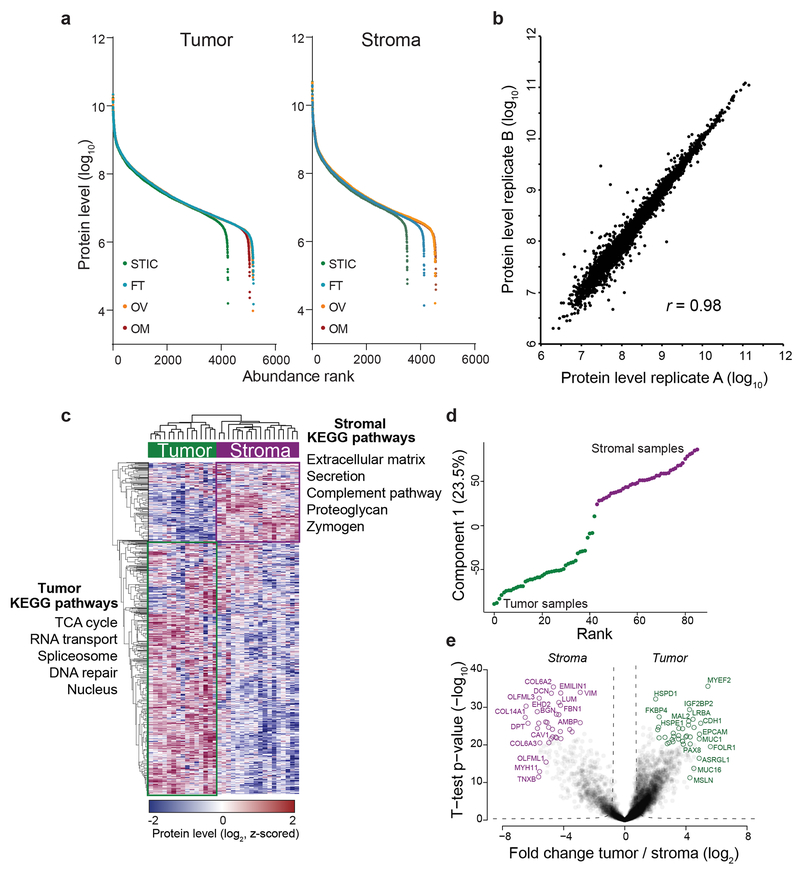
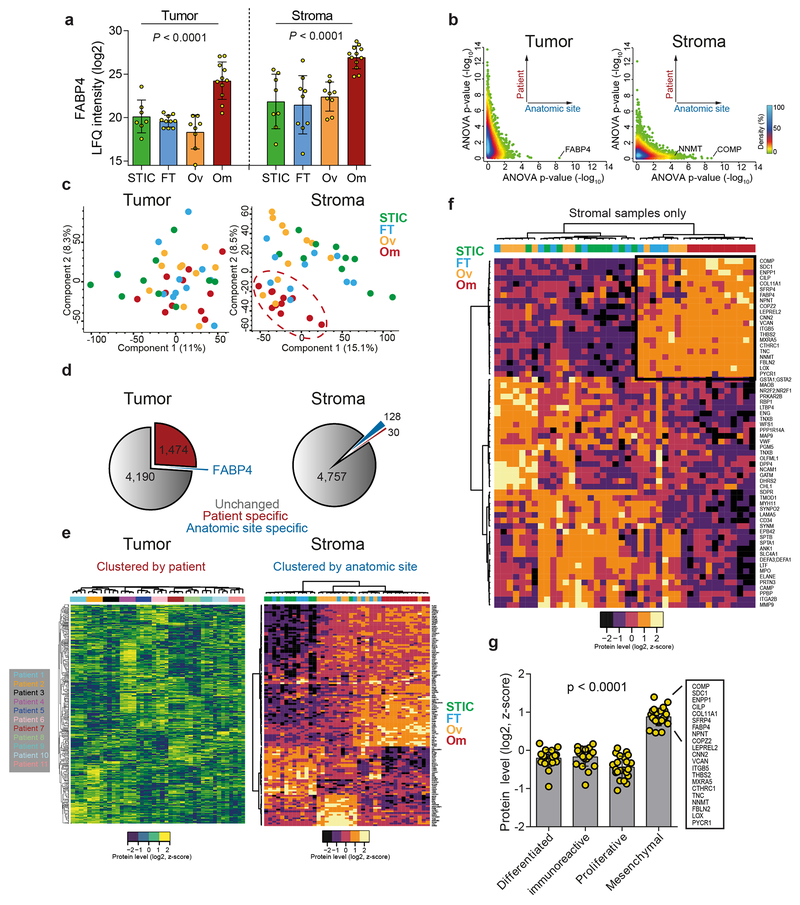
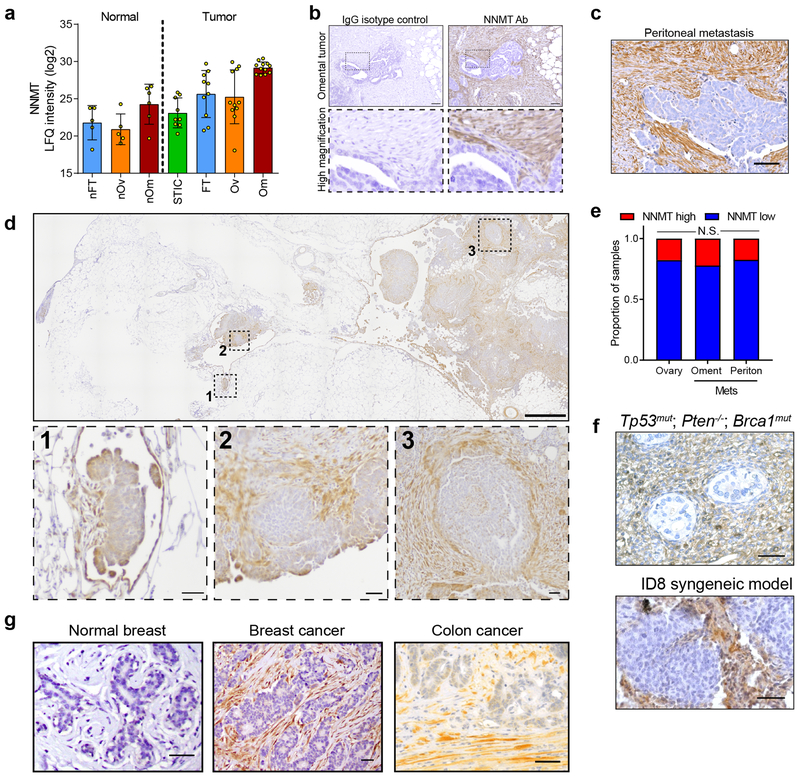
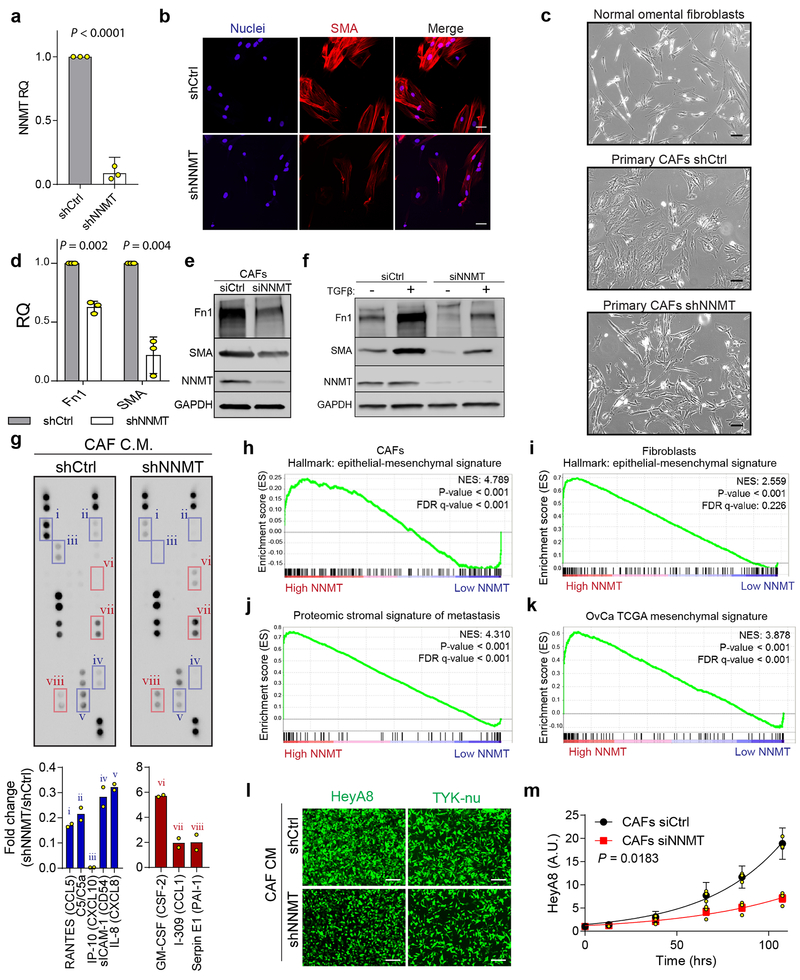
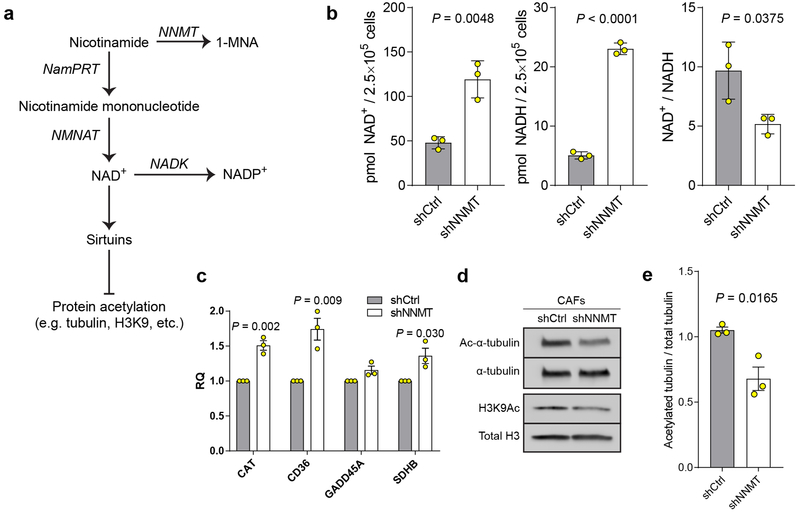
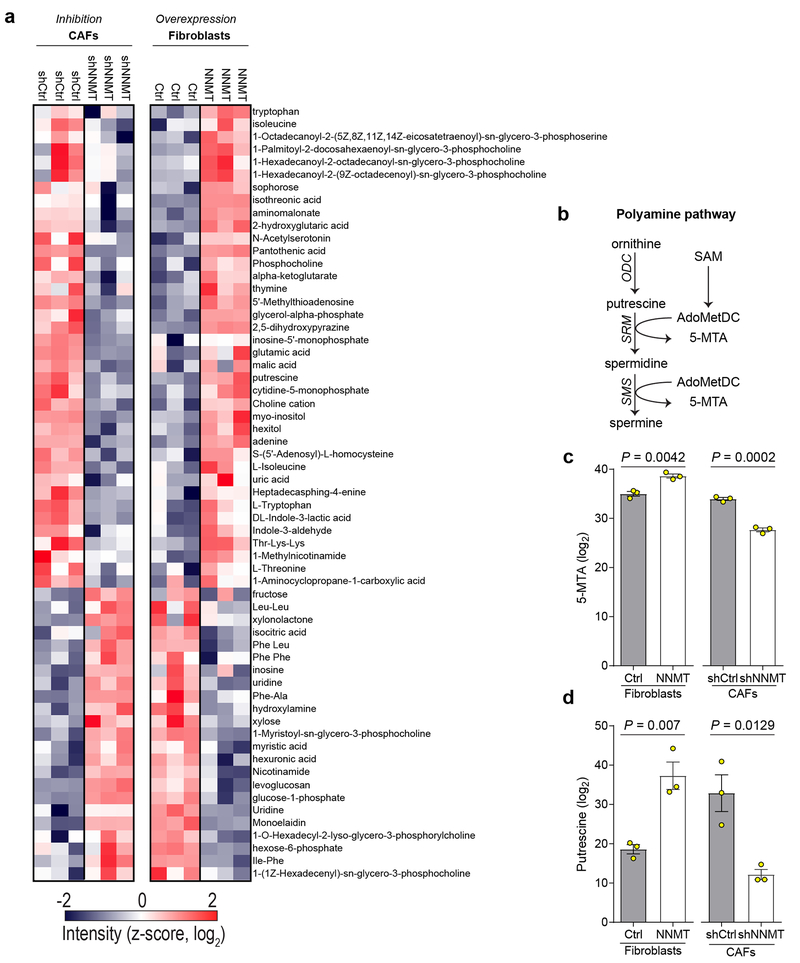
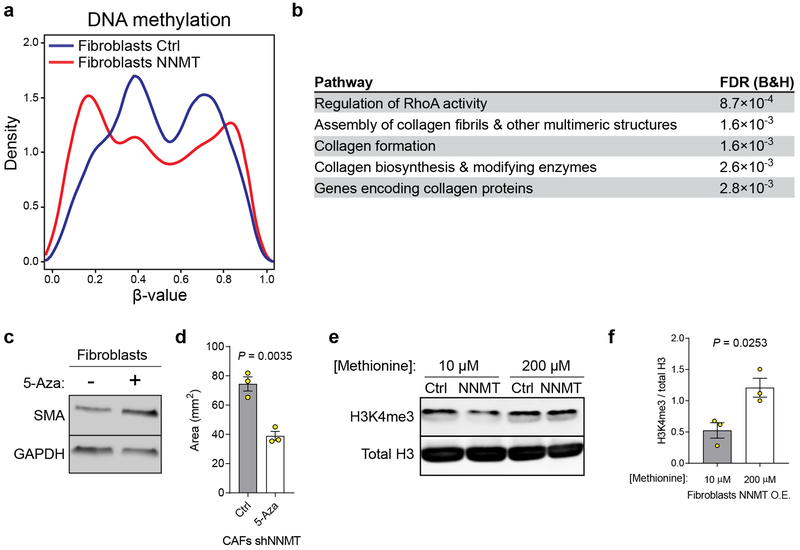
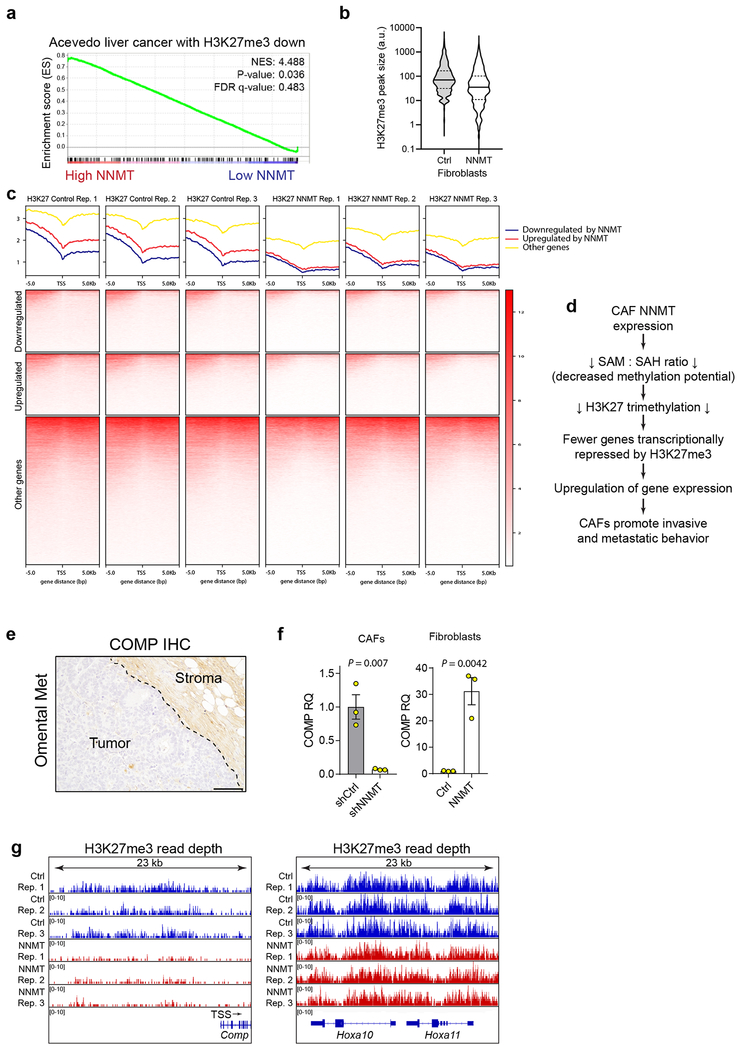
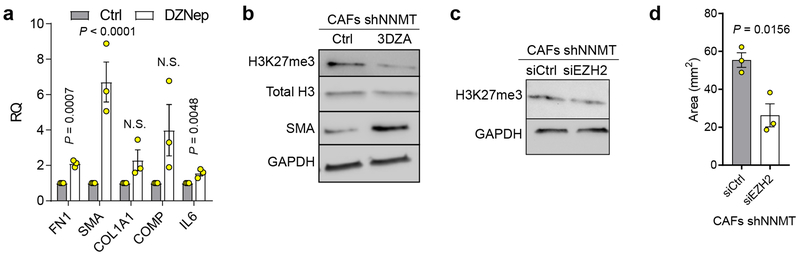
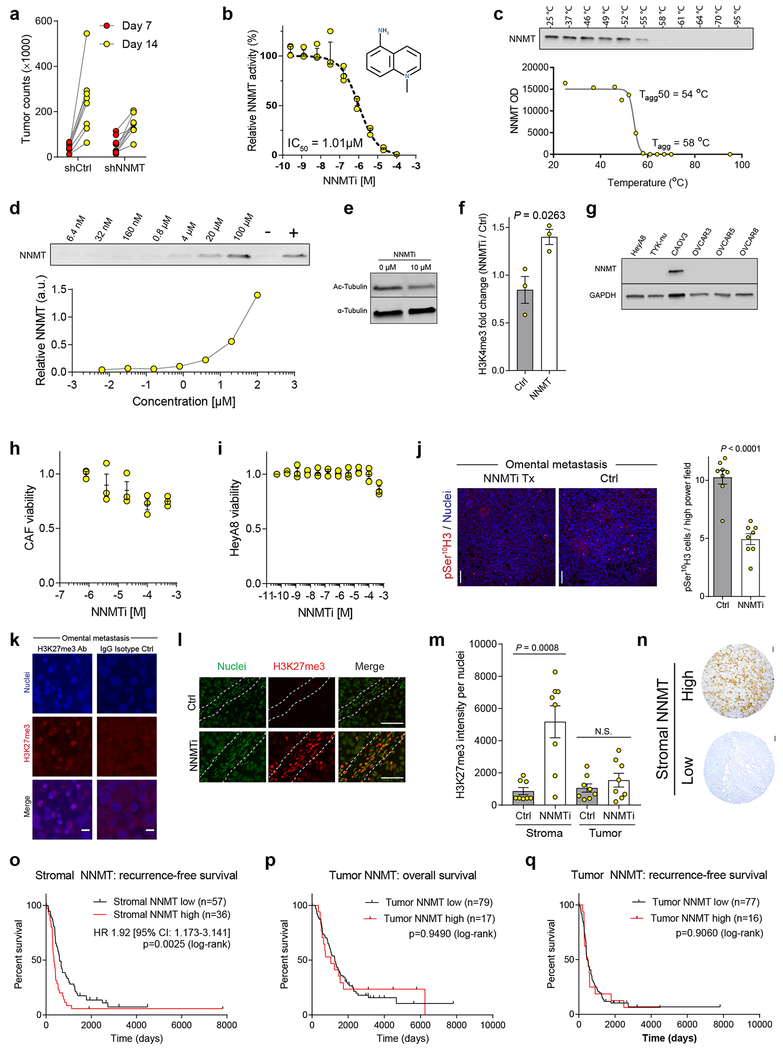
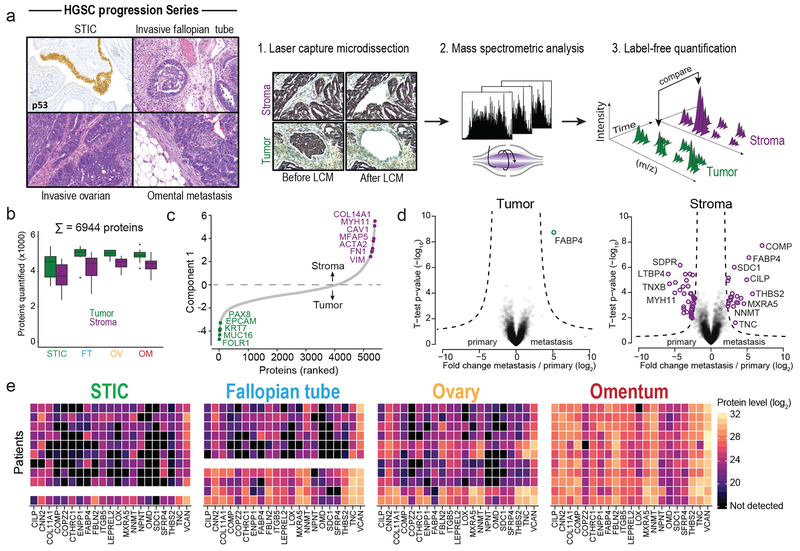
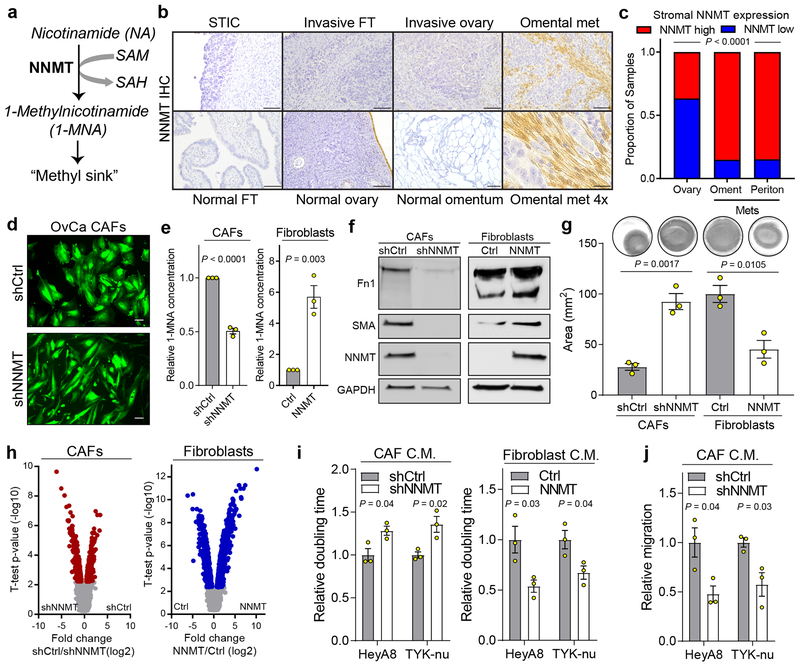
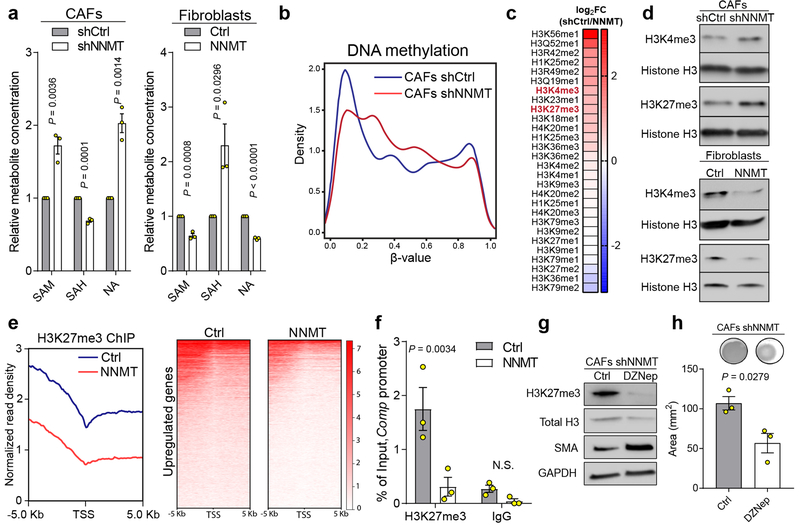
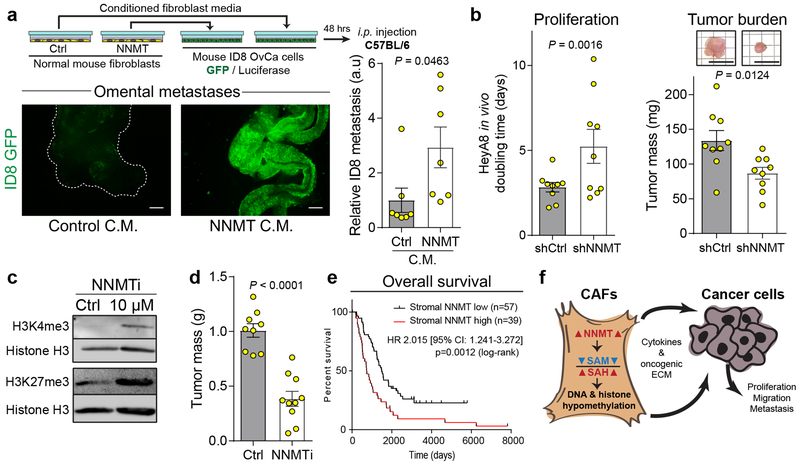
High-grade serous carcinoma has a poor prognosis, owing primarily to its early dissemination throughout the abdominal cavity. Genomic and proteomic approaches have provided snapshots of the proteogenomics of ovarian cancer1,2, but a systematic examination of both the tumour and stromal compartments is critical in understanding ovarian cancer metastasis. Here we develop a label-free proteomic workflow to analyse as few as 5,000 formalin-fixed, paraffin-embedded cells microdissected from each compartment. The tumour proteome was stable during progression from in situ lesions to metastatic disease; however, the metastasis-associated stroma was characterized by a highly conserved proteomic signature, prominently including the methyltransferase nicotinamide N-methyltransferase (NNMT) and several of the proteins that it regulates. Stromal NNMT expression was necessary and sufficient for functional aspects of the cancer-associated fibroblast (CAF) phenotype, including the expression of CAF markers and the secretion of cytokines and oncogenic extracellular matrix. Stromal NNMT expression supported ovarian cancer migration, proliferation and in vivo growth and metastasis. Expression of NNMT in CAFs led to depletion of S-adenosyl methionine and reduction in histone methylation associated with widespread gene expression changes in the tumour stroma. This work supports the use of ultra-low-input proteomics to identify candidate drivers of disease phenotypes. NNMT is a central, metabolic regulator of CAF differentiation and cancer progression in the stroma that may be therapeutically targeted.


Conflict of interest statement

The authors declare no competing financial interests.

Figures

Extended Data Fig. 1:
Extended Data Fig. 1:. Quantitative proteomics of low-input samples.
(a) MaxLFQ label-free quantitation values and dynamic range are similar across all anatomic sites and in both tumor (left) and stroma (right) samples. (b) Example of experimental replicates of microdissection, protein extraction, and quantitative proteomics with Pearson correlation of 0.98. n = 2 technical replicates. (c) Unsupervised hierarchical clustering of all proteomic samples leads to clustering of tumor (n = 43) and stromal (n=42) samples characterized by proteomic signatures associated with the indicated pathways (green and purple boxes, respectively). Enriched KEGG pathways for tumor (left) and stroma (right) are annotated. (d) One-dimensional principal component analysis of all tumor (n=43) and stromal (n = 42) samples. Component 1 accounts for 23.5% of the total data variation. (e) Volcano plot comparing all tumor and all stromal samples reveals enrichment of known markers characterizing tumor (green; n = 43 samples) and stromal (purple; n = 42 samples) components of the tumor (MUC16 is CA-125). ANOVA FDR < 0.01, n = 11 patients.
Extended Data Fig. 2:
Extended Data Fig. 2:. HGSC progression is characterized by patient-specific signatures in the tumor compartment and anatomic site-specific signatures in the stroma.
(a) FABP4 expression in tumor (n = 36) and stromal (n = 38) compartments derived from label-free, quantitative proteomics. One-way ANOVA. (b) Plot of ANOVA p-values of tumor (left; n = 43) or stroma (right; n =42) samples calculated by patient (y-axis) or anatomic site (x-axis). In the tumor compartment, differential expression of proteins is driven by the patient grouping; in the stromal compartment, anatomic site-specific differences are more pertinent. (c) Principal component analysis resolves an omental stromal cluster (n =42). No anatomic-site specific clusters are present in tumor samples (n =43). (d) Left and right panels show proportions of all proteins that are significantly different by patient (red) or anatomic site/compartment (blue). 1,474 proteins are differentially expressed in the tumor compartment between patients while only 30 stromal proteins are significantly different between patients. In respect to the compartment (tumor/stroma, blue; gray is undetected) one protein is differentially expressed in the tumor compartment (FABP4) while 128 proteins are differentially expressed in the stroma. (e) Unsupervised hierarchical clustering of tumor (left, 1,474 significant proteins from panel d) and stroma (right, 128 significant proteins from panel d) proteins reveals patient-specific clustering in the tumor compartment (n = 43) while the stromal samples (n = 42) cluster by anatomic site. Note, all omental samples (red) across all patients cluster together. (f) Unsupervised hierarchical clustering of only stromal proteins (n =42) that are differentially expressed between primary sites (FT and Ov) and metastases (Om) reveal anatomic site-specific clusters, including a core signature of 21 proteins consistently upregulated in the stroma of omental metastases (box). (g) Expression of the 21 protein signature in the TCGA subtypes reveals enhanced expression in mesenchymal subtype (n = 21 proteins).
Extended Data Fig. 3:
Extended Data Fig. 3:. NNMT is highly expressed in the stroma of ovarian cancers.
(a) Quantitative proteomics of the stroma finds elevated expression of NNMT in omental metastases (n = 11) compared to normal (normal fallopian tube (nFT; n = 5), normal ovarian (nOv; n = 5), and normal omentum (nOm; n = 6) and primary tumor tissues (STIC, n = 9; invasive fallopian tube (FT), n = 10; and invasive ovarian (Ov), n = 11). (b) Human omental metastasis tissue stained with NNMT-specific antibody or IgG isotype control; no non-specific staining is observed. Scale bar = 50 μm. (c) Representative NNMT IHC of peritoneal metastasis. (d) NNMT IHC of an omentum with micrometastases (1) and larger metastases (2 and 3). NNMT is detected in the stroma of very early metastases. (e) Quantification of tumor NNMT staining in TMA analysis. Chi-square test, n = 169 ovarian, 135 omental, and 92 peritoneal samples. (f) Representative IHC of NNMT in the stroma of metastases in an autochthonous model of ovarian cancer (top, PAX8:TP53mut;PTEN−/− ;BRCA1mut) and a syngeneic model (bottom, ID8 intraperitoneal xenograft). (g) NNMT is expressed in the stroma of breast and colon cancers, but not normal breast stroma.
Extended Data Fig. 4:
Extended Data Fig. 4:. NNMT promotes acquisition and maintenance of the CAF phenotype.
(a) qRT-PCR for NNMT in CAFs expressing an shRNA against NNMT. Two-sided t-test, n = 3 biological replicates. (b) Immunofluorescence analysis of smooth-muscle actin (SMA) reveals a decrease of SMA stress fibers upon knockdown of NNMT in CAFs. (c) Representative phase contrast images of normal omental fibroblasts and primary CAFs expressing shCtrl and shNNMT constructs. Upon knockdown of NNMT a reversion of CAF morphology to more closely resemble normal omental fibroblasts is observed. Scale bar = 50 μm. (d) Relative mRNA (two-sided t-test, n = 3 biological replicates) and (e) immunoblotting of fibronectin and SMA in CAFs transfected with the indicated siRNAs. (f) Knockdown of NNMT in stromal cells attenuates expression of fibronectin, SMA, and Snai1 following TGF-β treatment. (g) Cytokine array. A shNNMT construct was expressed in primary human CAFs and a cytokine array performed on the conditioned media. Cytokines downregulated upon knockdown of NNMT are highlighted in blue, those increased in red. Individual cytokines are indicated by Roman numerals. n = 2 technical replicates. (h-k) Gene set enrichment analysis (GSEA) of genes regulated by NNMT in stromal cells reveals associations with (h-i) the epithelial-mesenchymal transition hallmark gene set; (j) proteins enriched in the metastatic stroma compared to primary tumor stroma (proteomics-our data); and (k) the TCGA mesenchymal signature (RNA). (l) Representative images of chemotaxis of indicated HGSC cells in response to conditioned media from CAFs expressing shCtrl or shNNMT constructs. (m) Proliferation of HeyA8 cells grown in direct co-culture with CAFs transfected with the indicated siRNAs. Two-sided t-test, n = 3 biological replicates. All bar graphs represent mean of data and error bars are SEM.
Extended Data Fig. 5:
Extended Data Fig. 5:. NNMT regulates nicotinamide metabolism and sirtuins.
(a) NNMT depletes nicotinamide (NA), a precursor to NAD+ biosynthesis; NAD+ is an essential cofactor for sirtuin deacetylase activity which broadly regulates acetylation of proteins including tubulin and histones. NamPRT: nicotinamide phosphoribosyl transferase; NMNAT: nicotinamide mononucleotide adenylyltransferase; NADK: nicotinamide adenine dinucleotide kinase. (b) Quantification of NAD+, NADH, and the NAD+/NADH ratio in CAFs expressing shCtrl or shNNMT constructs. Two-sided t-test, n = 3 biological replicates. (c) Relative expression of genes regulated by sirtuin activity in CAFs expressing shCtrl or shNNMT constructs. Two-sided t-test, n = 3 biological replicates. Catalase (CAT), Succinate dehydrogenase subunit B (SDHB) (d) Acetylation of α-tubulin and histone H3K9 are reduced upon knockdown of NNMT in CAFs. (e) Quantification of α-tubulin acetylation immunoblots in CAFs expressing the indicated constructs. Two-sided t-test, n = 3 biological replicates. All bar graphs represent mean of data and error bars are SEM.
Extended Data Fig. 6:
Extended Data Fig. 6:. NNMT regulates global metabolism.
(a) Untargeted metabolite profiling reveals that NNMT induces conserved metabolic changes. Metabolites that are significantly changed upon both knockdown and overexpression of NNMT are shown (p < 0.05). Samples cluster by NNMT expression status rather than cell of origin. (b) The polyamine pathway consumes decarboxylated SAM (AdoMetDC, generated from SAM by the action of SAM decarboxylase; SAMDC) and generates 5-methylthioadenosine (5-MTA) during the conversion of putrescine to spermidine and spermine. ODC: ornithine decarboxylase; SRM: spermidine synthase; SMS: spermine synthase. (c-d) 5-MTA and putrescine levels are positively associated with NNMT expression in both fibroblasts and CAFs. All bar graphs represent mean of data and error bars are SEM.
Extended Data Fig. 7:
Extended Data Fig. 7:. NNMT regulates DNA and histone methylation in the stroma.
(a) Overexpression of NNMT leads to hypomethylation. Distribution of significantly different β-values (Benjamini-Hochberg adjusted p-value < 0.01) within 1500 bp of transcriptional start sites in fibroblasts expressing the indicated constructs as assessed by global DNA methylation arrays. β-values are lower in cells overexpressing NNMT, indicating decreased DNA methylation associated with transcriptional start sites. n = 2 biological replicates. (b) KEGG pathway analysis of genes differentially methylated upon both NNMT overexpression and knockdown in normal fibroblasts and CAFs, respectively. FDR (B&H) = Benjamini and Hochberg p-value. (c) Treatment of normal fibroblasts with the DNA methylation inhibitor 5-Aza (100 nM) leads to an increase in SMA expression. (d) Collagen contractility of normal fibroblasts is increased following treatment with 5-Aza (100 nM). Two-sided t-test, n = 3 biological replicates. (e) NNMT-mediated attenuation of H3K4 trimethylation is metabolically regulated and can be rescued by high (200 μM) methionine concentrations. (f) Quantification of H3K4 trimethylation immunoblotting in cells cultured with media containing 10 or 200 μM methionine. Two-sided t-test, n = 3 biological replicates. All bar graphs represent mean of data and error bars are SEM.
Extended Data Fig. 8:
Extended Data Fig. 8:. NNMT regulates stromal histone methylation.
(a) Genes regulated by the downregulation of H3K27 trimethylation (Acevedo gene set from Molecule Signatures Database) are enriched in genes regulated by NNMT overexpression as assessed by GSEA. (b) Overexpression of NNMT in normal fibroblasts followed by H3K27me3 immunoprecipitation and ChIP-seq. Violin plot of ChIP-seq peak size distribution corresponding to H3K27me3 occupancy at the promoter of genes significantly upregulated (gene expression FDR p < 0.05 from RNA-sequencing analysis) in NNMT overexpressing fibroblasts; NNMT overexpression leads to a significant reduction in H3K27me3 occupancy. Solid black line indicates median, dashed lines the quartiles. (c) Same experimental setup as in (b). H3K27me3 ChIP-sequencing of normal fibroblasts overexpressing NNMT. H3K27me3 read density plots (top) and heatmaps (bottom) in relationship to genes downregulated, upregulated, or unchanged (gene expression FDR p < 0.05 from RNA sequencing analysis) in response to NNMT overexpression. ChIP-seq data are binned into expression groups from parallel RNA sequencing analysis. TSS = transcriptional start site, n = 3 biological replicates. (d) Overexpression of NNMT leads to genome-wide H3K27 hypomethylation (reduced H3K27me3 occupancy) at gene promoters adjacent to transcriptional start sites (TSS). Thus, NNMT expression upregulates expression of a significant number of genes by relieving H3K27me3-mediated transcriptional suppression. (e) Immunohistochemistry of COMP in an omental metastasis. TSS = transcriptional start site. Scale bar = 100 μm. (f) COMP gene expression in CAFs or fibroblasts expressing the indicated constructs. Two-sided t-test, n = 3 biological replicates. (g) Coverage tracks of H3K27me3 ChIP-sequencing analysis of fibroblasts expressing control or NNMT overexpression constructs. Genes regulated by NNMT expression (Comp) display reduced coverage depth while non-perturbed loci (Hoxa10/Hoxa11) are sequenced to similar depths. Comp, Hoxa10, and Hoxa11 exon/intro structure are indicated and Comp gene direction and TSS. All bar graphs represent mean of data and error bars are SEM.
Extended Data Fig. 9:
Extended Data Fig. 9:. Inhibition of H3K27 trimethylation restores features of the CAF phenotype.
(a) Expression of CAF marker genes in CAFs expressing shNNMT and treated with the EZH2 histone methyltransferase inhibitor DZNep. Two-sided t-test, n = 3 biological replicates. (b) Immunoblot of CAFs expressing a shNNMT construct treated with the general methyltransferase inhibitor 3-DZA. Knockdown of EZH2 in CAFs expressing a shNNMT construct leads to (c) decreased H3K27 trimethylation, and (d) increased collagen contractility. Two-sided t-test, n = 3 biological replicates. All bar graphs represent mean of data and error bars are SEM.
Extended Data Fig. 10:
Extended Data Fig. 10:. NNMT inhibition.
(a) Raw tumor luminescence values of HeyA8/CAF subcutaneous xenograft at 7 and 14 days following implantation. CAF expressing shNNMT construct (or control; shNNMT) (b) In vitro NNMT enzymatic activity assay in response to NNMTi treatment, n = 3 experimental replicates. (c) Cellular thermal shift assay (CETSA) performed with CAOV3 cells at the indicated temperatures to establish aggregation temperature for NNMT. (d) CETSA suggests cellular target engagement of NNMTi at micromolar concentrations. (e) Small molecule inhibition of NNMT in CAFs leads to reduction in tubulin acetylation. (f) Quantification of H3K4me3 immunoblotting in fibroblasts expressing the indicated constructs following treatment with NNMTi; H3K4 trimethylation is only increased in cells expressing NNMT after treatment with the inhibitor, indicating that effects on histone methylation are NNMT-specific. Two-sided t-test, n = 3 biological replicates. (g) Immunoblotting: NNMT is only expressed in the CAOV3 OvCa cell line. Treatment of (h) OvCa cells or (i) CAFs with the NNMTi only reduced cell viability at high concentrations, n = 3 biological replicates. (j) Representative images and quantification of cancer cell proliferation in murine tumors treated with NNMTi or vehicle control. Two-sided t-test, n = 8 biological replicates. Scale bar = 100 μm. (k) Murine omental tumor tissue stained with H3K27me3 or IgG isotype control antibody demonstrates specificity of antibody. Scale bar = 10 μm. (l) Immunofluorescence of H3K27me3 in omental metastases from mice in Fig. 4d confirms that NNMT inhibition increases histone methylation in the TME. Stromal compartment is highlighted by dashed lines. Scale bar = 50 μm. (m) Quantification of H3K27me3 nuclear staining intensity of stroma or tumor compartment in omental tumors from mice treated with vehicle or NNMTi. H3K27 trimethylation is increased in the stromal compartment. Two-sided t-test, n = 8 biological replicates. (n) Representative images of ovarian tumors expressing stromal NNMT. (o) Kaplan-Meier curve of recurrence-free survival of patients with low (black) or high (red) stromal NNMT expression in primary tumor sites (Two-tailed test). Kaplan-Meier curve of (p) overall and (q) recurrence-free survival of patients with low (black) or high (red) tumor NNMT expression in primary sites (Two-tailed test). All bar graphs represent mean of data and error bars are SEM.
Fig. 1:
Fig. 1:. Compartment-resolved proteomics of ovarian cancer progression reveals a stromal signature of HGSC metastasis.
(a) Tumor and stromal compartments were microdissected from different anatomic sites (serous tubal intraepithelial carcinoma, STIC; invasive fallopian tube, FT; ovarian lesions, Ov; and omental metastases, Om) and label-free, quantitative shotgun proteomics performed to identify proteins differentially expressed across all anatomic sites. (b) Number of unique proteins quantified by MaxLFQ in each anatomic compartment (n = 11 patients). (c) Ranking of proteins by expression in tumor compartment (green; n = 43 samples) versus stromal compartment (purple; n = 42 samples) shows known markers. (d) Volcano plots comparing primary sites (FT and Ov) to omental metastases in tumor (left) and stromal (right) compartments. Significantly differentially expressed proteins are highlighted in green (tumor) or purple (stroma). ANOVA FDR < 0.01, n = 11 patients. (e) Heatmap of proteins upregulated in omental stromal signature of metastasis across all patients (rows) and anatomic sites (STIC, FT, Ov, and Om). Undetected values are black; missing samples are white. The box plots in b define the range of the data (whiskers), 25th and 75th percentiles (box), and medians (solid line).
Fig. 2:
Fig. 2:. NNMT is upregulated in the stroma of HGSC metastases and regulates the CAF phenotype.
(a) NNMT catalyzes the transfer of a reactive methyl group from S-adenosyl-L-methionine (SAM) to nicotinamide (NA), generating S-adenosyl-L-homocysteine (SAH) and the metabolically inert product 1-methylnicotinamide (1-MNA), thus depleting SAM and reducing global cellular methylation potential. (b) NNMT immunohistochemistry (IHC) finds elevated expression in the stroma of omental metastases. NNMT is not expressed in the stroma of normal fallopian tube, ovary, or omentum. Scale bars = 100 μm (25 μm for omental met 4×). (c) Stromal NNMT expression is elevated in omental and peritoneal metastases compared to ovarian sites (Chi-square test). (d) Knockdown of NNMT in CAFs leads to a more elongated morphology resembling normal omental fibroblasts (GFP). Scale bar = 10 μm. (e) Production of 1-MNA is attenuated upon knockdown and enhanced upon overexpression of NNMT. Two-sided t-test, n = 3 biological replicates. (f) Immunoblot of CAF markers (fibronectin, Fn1; smooth muscle actin, SMA) upon knockdown or overexpression of NNMT. (g) Effect of NNMT overexpression or knockdown on collagen contractility. Two-sided t-test, n = 3 biological replicates. (h) Gene expression analysis identified thousands of genes that were significantly differentially expressed (red or blue) upon knockdown (left) or overexpression (right) of NNMT. FDR ANOVA < 0.01, n = 3 biological replicates. (i) Proliferation (doubling time) of HeyA8 and TYK-nu OvCa cells following treatment with the indicated conditioned media (CM). Proliferation rate increases (doubling time decreases) with NNMT overexpression and decreases (doubling time increases) upon knockdown. Two-sided t-test, n = 3 biological replicates. (j) Quantification of chemotaxis in response to conditioned media from CAFs expressing shCtrl or shNNMT constructs. Two-sided t-test, n = 3 biological replicates. All bar graphs represent mean of data and error bars are SEM.
Fig. 3:
Fig. 3:. NNMT regulates DNA and histone methylation to drive the CAF phenotype.
(a) Quantification of SAM, SAH, and NA upon knockdown or overexpression of NNMT, n = 3 biological replicates. (b) Distribution of significantly different β-values (Benjamini-Hochberg adjusted p-value < 0.01) corresponding to the degree of DNA methylation within 1500 bp of transcriptional start sites in CAFs as assessed by global DNA methylation arrays. n = 2 biological replicates. (c) Quantitative histone methylation proteomics in CAFs expressing shCtrl or shNNMT constructs following chromatin extraction. me1=mono-methylation; me2=dimethylation; me3=trimethylation. (d) Immunoblotting of H3K4me3 and H3K27me3 in primary human CAFs when NNMT is inhibited (sh) or in primary fibroblasts overexpressing NNMT. (e) H3K27me3 ChIP-sequencing of normal fibroblasts overexpressing NNMT reveals that NNMT expression reduces H3K27me3 occupancy adjacent to transcriptional start sites (TSS) of genes significantly upregulated upon NNMT expression (Benjamini-Hochberg adjusted p-value < 0.05, n = 3 biological replicates) (f) Enrichment of H3K27me3 at the Comp promoter as determined by qPCR in fibroblasts overexpressing NNMT. ANOVA, n = 3 biological replicates. (g) Immunoblot of fibroblast markers and (h) collagen contractility of CAFs expressing shNNMT and treated with the EZH2 histone methyltransferase inhibitor DZNep. Two-sided t-test, n = 3 biological replicates. All bar graphs represent mean of data and error bars are SEM.
Fig. 4:
Fig. 4:. Stromal NNMT supports HGSC progression and is associated with a poor prognosis.
(a) Schematic of experimental design (top). Representative images and quantification of omental adhesion following intraperitoneal injection of luciferase/GFP-labeled ID8 mouse OvCa cells treated with conditioned media from fibroblasts expressing the indicated constructs, n = 7 mice per group. Two-sided t-test. Scale bar = 500 μm. (b) In vivo proliferation and total tumor burden of luciferase-labeled OvCa cells co-injected with CAFs expressing shCtrl or shNNMT constructs, n = 9 tumors per group. Scale = 1 cm. (c) Treatment of CAFs with the NNMTi led to increased histone methylation. (d) Tumor burden of nude mice intraperitoneally injected with HeyA8 OvCa cells after 10 days of treatment with vehicle control (Ctrl; PBS; n = 9) or NNMTi (n = 10). Two-sided t-test. (e) Kaplan-Meier survival curves for patients with low (black) or high (red) stromal expression of NNMT in ovarian sites, as assessed by IHC. Two-tailed test. (f) Stromal NNMT drives ovarian cancer progression by metabolic regulation of histone methylation which causes epigenetic and transcriptional changes in stromal cells promoting cancer cell proliferation, migration, and metastasis. All bar graphs represent mean of data and error bars are SEM.

Similar articles

Cited by

References

REFERENCES.

    1. The Cancer Genome Atlas, N. Integrated genomic analyses of ovarian carcinoma. Nature 474, 609–615 (2011). - PMC - PubMed
    1. Zhang H et al. Integrated proteogenomic characterization of human high-grade serous ovarian cancer. Cell 166, 755–765, doi:10.1016/j.cell.2016.05.069 (2016). - DOI - PMC - PubMed
    1. Kuhn E et al. TP53 mutations in serous tubal intraepithelial carcinoma and concurrent pelvic high-grade serous carcinoma-evidence supporting the clonal relationship of the two lesions. J. Pathol 226, 421–426 (2012). - PMC - PubMed
    1. Alexandrov LB et al. Signatures of mutational processes in human cancer. Nature 500, 415–421, doi:10.1038/nature12477 (2013). - DOI - PMC - PubMed
    1. Francavilla C et al. Phosphoproteomics of primary cells reveals druggable kinase signatures in ovarian cancer. Cell reports 18, 3242–3256, doi:10.1016/j.celrep.2017.03.015 (2017). - DOI - PMC - PubMed

METHODS REFERENCES.

    1. Wang H et al. Development and evaluation of a micro- and nanoscale proteomic sample preparation method. J. Proteome Res 4, 2397–2403, doi:10.1021/pr050160f (2005). - DOI - PMC - PubMed
    1. Roulhac PL et al. Microproteomics: quantitative proteomic profiling of small numbers of laser-captured cells. Cold Spring Harb Protoc 2011, pdb prot5573, doi:10.1101/pdb.prot5573 (2011). - DOI - PMC - PubMed
    1. Scheltema RA et al. The Q Exactive HF, a benchtop mass spectrometer with a pre-filter, high-performance quadrupole and an ultra-high-field Orbitrap analyzer. Mol Cell Proteomics 13, 3698–3708 (2014). - PMC - PubMed
    1. Michalski A et al. Mass spectrometry-based proteomics using Q Exactive, a high-performance benchtop quadrupole Orbitrap mass spectrometer. Mol. Cell. Proteomics 10, M111 011015, doi:10.1074/mcp.M111.011015 (2011). - DOI - PMC - PubMed
    1. Cox J & Mann M MaxQuant enables high peptide identification rates, individualized p.p.b.-range mass accuracies and proteome-wide protein quantification. Nat. Biotechnol 26, 1367–1372 (2008). - PubMed

Publication types

MeSH terms