. 2019 Jun 20;74(6):1304-1316.e8.
doi: 10.1016/j.molcel.2019.03.036. Epub 2019 Apr 25.

Transcriptome-wide Mapping of Internal N7-Methylguanosine Methylome in Mammalian mRNA

Affiliations

Transcriptome-wide Mapping of Internal N7-Methylguanosine Methylome in Mammalian mRNA

Li-Sheng Zhang et al. Mol Cell. .

Abstract

N7-methylguanosine (m7G) is a positively charged, essential modification at the 5' cap of eukaryotic mRNA, regulating mRNA export, translation, and splicing. m7G also occurs internally within tRNA and rRNA, but its existence and distribution within eukaryotic mRNA remain to be investigated. Here, we show the presence of internal m7G sites within mammalian mRNA. We then performed transcriptome-wide profiling of internal m7G methylome using m7G-MeRIP sequencing (MeRIP-seq). To map this modification at base resolution, we developed a chemical-assisted sequencing approach that selectively converts internal m7G sites into abasic sites, inducing misincorporation at these sites during reverse transcription. This base-resolution m7G-seq enabled transcriptome-wide mapping of m7G in human tRNA and mRNA, revealing distribution features of the internal m7G methylome in human cells. We also identified METTL1 as a methyltransferase that installs a subset of m7G within mRNA and showed that internal m7G methylation could affect mRNA translation.

Keywords: METTL1; N(7)-methylguanosine; RNA modification; base-resolution; epitranscriptomics; m(7)G; m(7)G-MeRIP-seq; m(7)G-seq; mRNA modification; tRNA modification; translation regulation.


Conflict of interest statement

DECLARATION OF INTERESTS

C.H. is a scientific founder and a scientific advisory board member of Accent Therapeutics. Inc. and a shareholder of Epican Genetech.

Figures

Figure 1.
Figure 1.. Quantitative Detection of Internal m7G Sites in Mammalian Messenger RNA and MeRIP-seq Profile in Mammalian Cells.
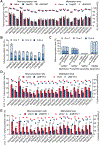
(A) Chemical structure of N7-methylguanosine (m7G). (B) LC-MS/MS quantification of m7G/G levels in polyA+ RNA (HEK293T cells) using a three-step RNA digestion (red) or a two-step digestion (blue). Mean values ± s.d. are shown, n = 3. (C) LC-MS/MS quantification of m7G/G and m6A/A levels in cap-depleted polyA+ mRNA isolated from human and mouse cells. Mean values ± s.d. are shown, n = 3. (D) LC-MS/MS quantification of m7G/G, Gm/G, m6A/A, Am/A, m1A/A levels showing enrichment of m7G after immunoprecipitation using anti-m7G specific antibody (MBL), without enriching other modifications. Cap-depleted polyA+ mRNA (HEK293T cells) was used as the input control. Mean values ± s.d. are shown, n = 3. (E) The overlap of m7G-MeRIP-seq m7G peaks among three human cell lines (left) and two mouse cell lines (right) (fold change (FC) ≥ 3, false discovery rate (FDR) ≤ 0.05, FPKM ≥ 1.0). (F) The percentage of methylated genes with 1, 2, 3, 4 or 5+ peaks per gene in the indicated human and mouse cell types. (G) Top three motifs identified with m7G-MeRIP-seq by HOMER software.
Figure 2.
Figure 2.. m7G-MeRIP-seq Mapped Transcriptome-wide Distributions of Internal m7G Sites in Human and Mouse Cell Lines.
(A) The percentages of methylated genes out of all genes (within one expression bin) in HepG2 and mESC cells exhibit a progressively larger fraction as gene expression level increases (the expression level is equally divided into ten bins in a range of 1≤FPKM≤50). (B) Pie charts presenting the fraction of m7G peaks in each of three transcript segments in HeLa and MEF cells. (C) Metagene profiles of the distribution of the antibody-enriched m7G peaks in HeLa cells along a normalized transcript composed of three rescaled non-overlapping segments (5’ UTR, CDS, and 3’ UTR)(fold change (FC) ≥ 4, false discovery rate (FDR) ≤ 0.05, FPKM ≥ 1.0). (D) Human–mouse m7G conservation shown as percent of orthologous positions versus shared m7G peaks according to their locations in the transcript (between HepG2 cells and mESC cells). (E) Gene ontology (GO) analysis of internal m7G-methylated transcripts relative to all adequately expressed genes in HEK293T and mESC cells (FPKM ≥ 1.0).
Figure 3.
Figure 3.. m7G-seq Chemical Principle and Sequencing Protocol Design.
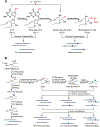
(A) Schematic diagram showing the chemical reactivity of m7G under reduction and biotin labeling conditions in m7G-seq. Only the reduced form of m7G can generate biotinylated AP sites with biotin hydrazide under mildly acidic conditions. Biotinylated AP sites could induce misincorporation when using HIV reverse transcriptase. (B) Schematic outline of m7G-seq. RNA fragments are firstly ligated at 3’ end before the chemical reactions. They, whether undergo biotin pulldown or not, are then subject to reverse transcription before 3’ adaptor ligation to the resulting cDNA. Only those fragments with internal m7G sites are expected to generate misincorporation during reverse transcription that can be further detected using high-throughput sequencing.
Figure 4.
Figure 4.. Base-resolution Mappings of m7G in Human rRNA and tRNAs by m7G-seq.
(A) The misincorporation rates (without enrichment) for m7G1639 in human 18S ribosomal RNA and 22 cytoplasmic tRNAs containing internal m7G46 are shown in bars for three human cell lines. Mean values ± s.d. are shown, n = 2. The corresponding estimated methylation levels are shown in dot. (B) The misincorporation distribution pattern (without enrichment) shown for different internal m7G motifs in tRNAs and 18S rRNA. Mean values ± s.d. are shown, n = 2. (C) The misincorporation distribution patterns (input, before pulldown and after pulldown) for other G modifications in tRNAs. Mean values ± s.d. are shown, n = 2. (D) The misincorporation levels for m7G46 in 22 human tRNAs upon METTL1 transient knockdown vs control in HeLa cells are shown in bars. Mean values ± s.d. are shown, n = 2. P values were determined using two-tailed Student’s t test for paired samples. *p < 0.05; **p < 0.01. The corresponding estimated methylation levels are shown in dots. (E) The misincorporation levels for m7G46 in 22 human tRNAs upon METTL1 stable knockdown vs control in HepG2 cells are shown in bars. Mean values ± s.d. are shown, n = 2. P values were determined as Figure 4D. The corresponding estimated methylation levels are shown in dots.
Figure 5.
Figure 5.. Single-nucleotide Resolution m7G Maps in Human Messenger RNAs.
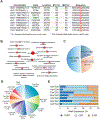
(A) Ten representative internal m7G sites shared in both HeLa and HepG2 cells are identified by m7G-seq in replicates (without enrichment). Sequence motifs at base resolution and the estimated methylation levels in two human cell lines are shown. (B) GO analysis for 801 m7G sites from high confident base-resolution m7G-seq results shared between HeLa and HepG2 cells in replicates as well as overlapping with m7G-MeRIP peaks. (C) Pie chart showing the fraction of 801 m7G peaks shown in Figure 5B in each of three non-overlapping transcript segments. (D) Pie chart displaying the fraction of main internal m7G motifs in mRNA based on confident targets shown in Figure 5B. (E) m7G peak distribution of the top seven m7G motifs in mRNA along a normalized transcript composed of three rescaled segments.
Figure 6.
Figure 6.. METTL1 Mediates Internal mRNA m7G Methylation.
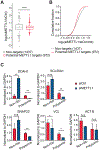
(A) Pie chart showing the fraction of hypo-methylated m7G peaks from m7G-MeRIP-seq of siMETTL1 HeLa and shMETTL1 HepG2 cells in each of three non-overlapping transcript segments. (B) Top two motifs identified from hypo-methylated m7G peaks for siMETTL1 HeLa cells and shMETTL1 HepG2 cells. (C) A global reduction of m7G-meRIP-seq intensity was observed within hypo-methylated peaks upon METTL1 knockdown. Two sided Mann-Whitney test. (D) GO analysis for potential METTL1 target transcripts that contains hypo-methylated peaks in siMETTL1 HeLa cells. (E) Left (light blue): LC-MS/MS results of internal m7G/G levels in HepG2 small RNA (<200 nt) from shControl vs shMETTL1 vs Treated. Right (dark blue): LC-MS/MS results of internal m7G/G levels in HeLa mRNA from siControl vs siMETTL1 vs Treated. Mean values ± s.d. are shown, n = 3.
Figure 7.
Figure 7.. Internal m7G Promotes Translation of m7G-modified mRNA.
(A) Cumulative distribution log2-fold changes of the translation efficiency between siMETTL1 and siControl transfection for non-targets (grey), potential targets (METTL1 hypo-methylated targets) (red). P values were calculated from a two-sided Mann-Whitney test compared to non-targets.***p<0.001 (B) Cumulative distribution log2-fold changes of translation efficiency (ratio of ribosome bound fragments to mRNA input) between siMETTL1 and siControl transfection for non-targets (grey), potential targets (red). (C) Redistribution of representative targets in non-ribosome and polysome portions of mRNPs upon depletion of METTL1 measured by RT-qPCR. DDAH1, SCL20A1, SNAP23, and VCL are potential METTL1 m7G targets, and ACTB is a non-target control. Mean values ± s.d. are shown, n = 2, technical replicates. P values were determined using two-tailed Student’s t test for paired samples. *p < 0.05; **p < 0.01.

Comment in

Similar articles

Cited by

References

    1. Zhao BS, Roundtree IA, and He C (2017). Post-transcriptional gene regulation by mRNA modifications. Nat. Rev. Mol. Cell Biol. 18, 31–42. - PMC - PubMed
    1. Gilbert WV, Bell1 TA, and Schaening C (2016). Messenger RNA modifications: Form, distribution, and function. Science 352, 1408–1412. - PMC - PubMed
    1. Helm M, and Motorin Y (2017). Detecting RNA modifications in the epitranscriptome: predict and validate. Nat. Rev. Genet 18, 275–291. - PubMed
    1. Frye M, Harada BT, Behm M, and He C (2018). RNA modifications modulate gene expression during development. Science 361, 1346–1349. - PMC - PubMed
    1. Roundtree IA, Evans ME, Pan T, and He C (2017). Dynamic RNA modifications in gene expression regulation. Cell 169, 1187–1200. - PMC - PubMed

Publication types

MeSH terms