. 2019 May;569(7754):131-135.
doi: 10.1038/s41586-019-1130-6. Epub 2019 Apr 17.

Targeting LIF-mediated paracrine interaction for pancreatic cancer therapy and monitoring

Affiliations

Targeting LIF-mediated paracrine interaction for pancreatic cancer therapy and monitoring

Yu Shi et al. Nature. 2019 May.

Erratum in

  • Author Correction: Targeting LIF-mediated paracrine interaction for pancreatic cancer therapy and monitoring.
    Shi Y, Gao W, Lytle NK, Huang P, Yuan X, Dann AM, Ridinger-Saison M, DelGiorno KE, Antal CE, Liang G, Atkins AR, Erikson G, Sun H, Meisenhelder J, Terenziani E, Woo G, Fang L, Santisakultarm TP, Manor U, Xu R, Becerra CR, Borazanci E, Von Hoff DD, Grandgenett PM, Hollingsworth MA, Leblanc M, Umetsu SE, Collisson EA, Scadeng M, Lowy AM, Donahue TR, Reya T, Downes M, Evans RM, Wahl GM, Pawson T, Tian R, Hunter T. Shi Y, et al. Nature. 2021 Dec;600(7889):E18. doi: 10.1038/s41586-021-04176-w. Nature. 2021. PMID: 34848876 No abstract available.

Abstract

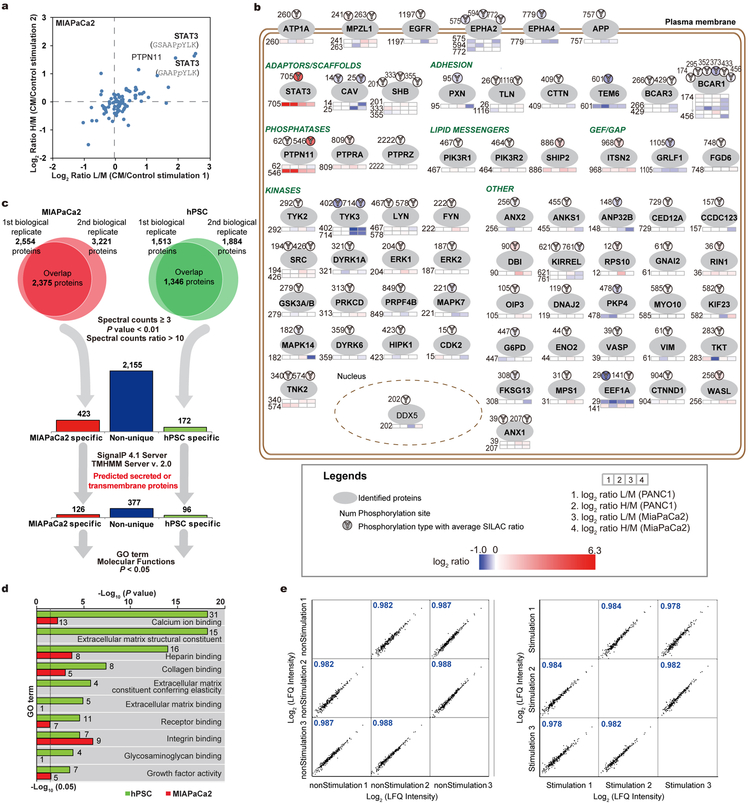
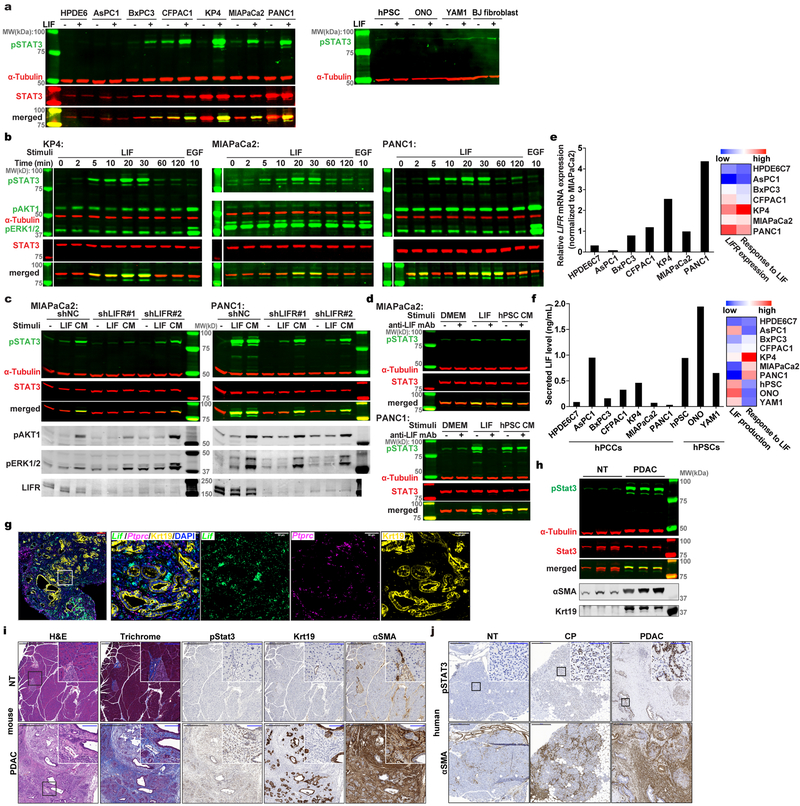
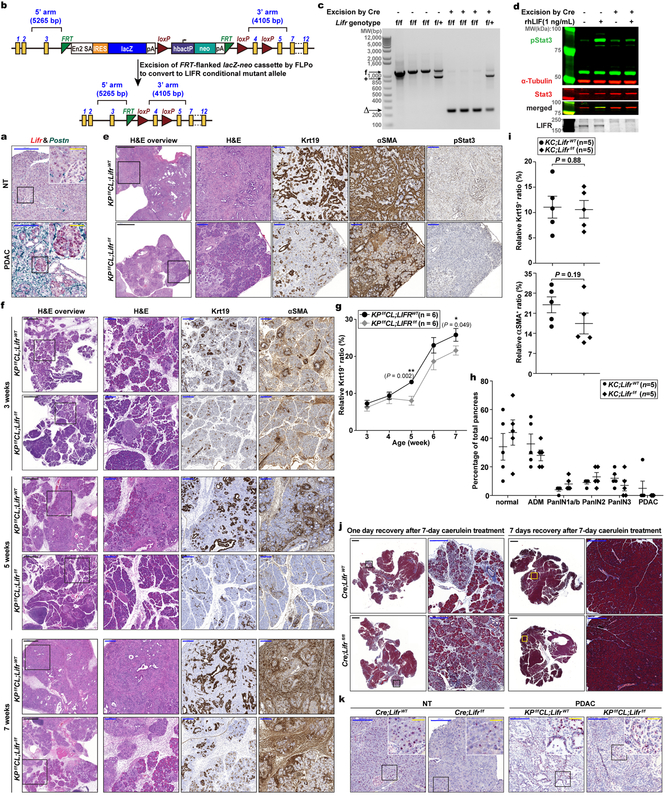
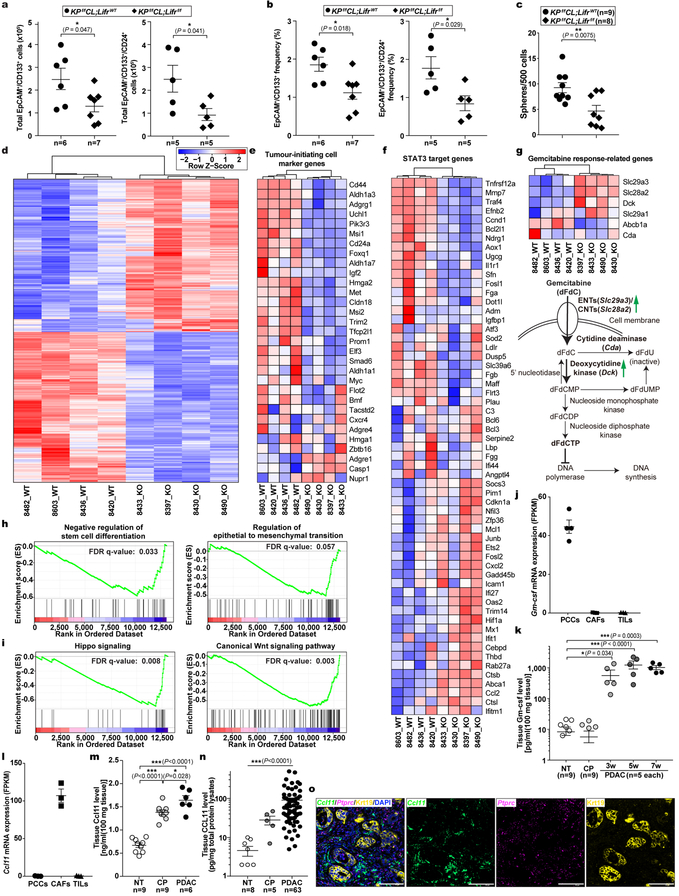
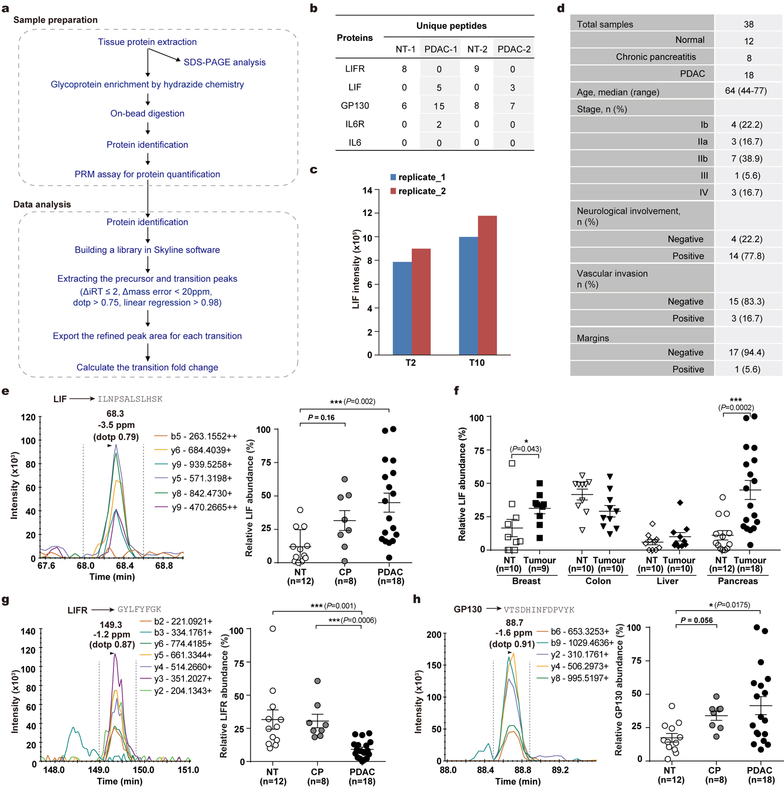
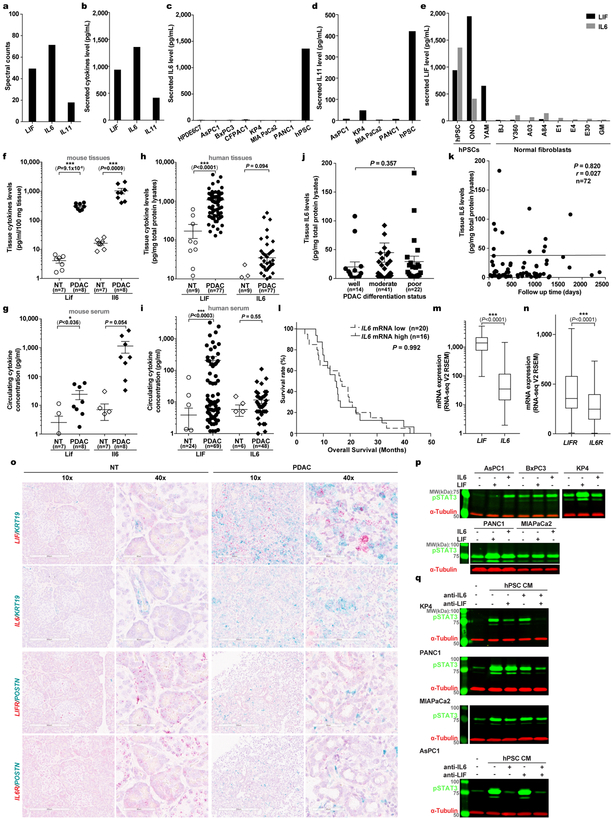
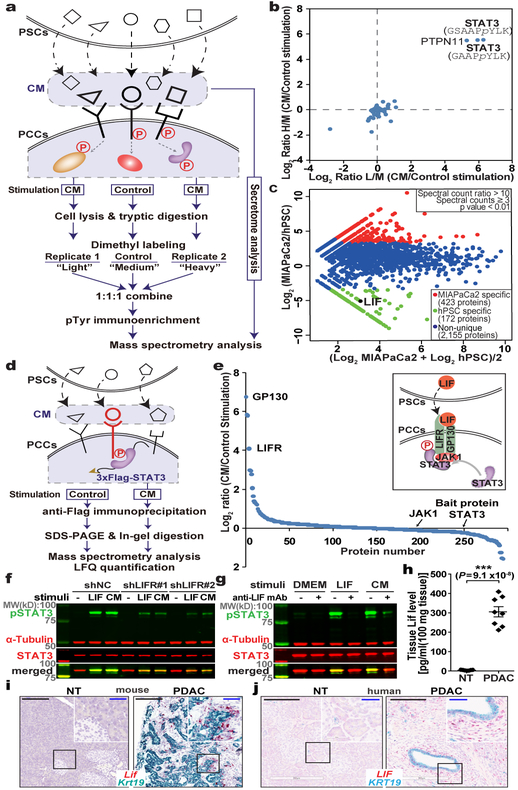
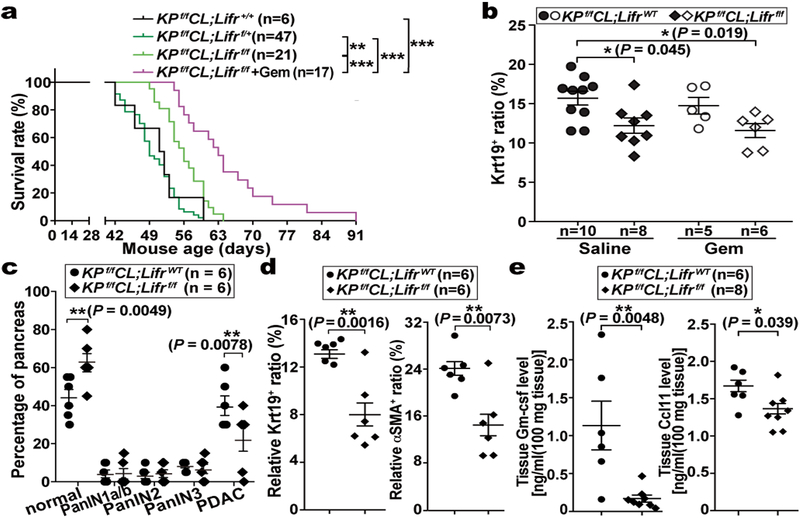
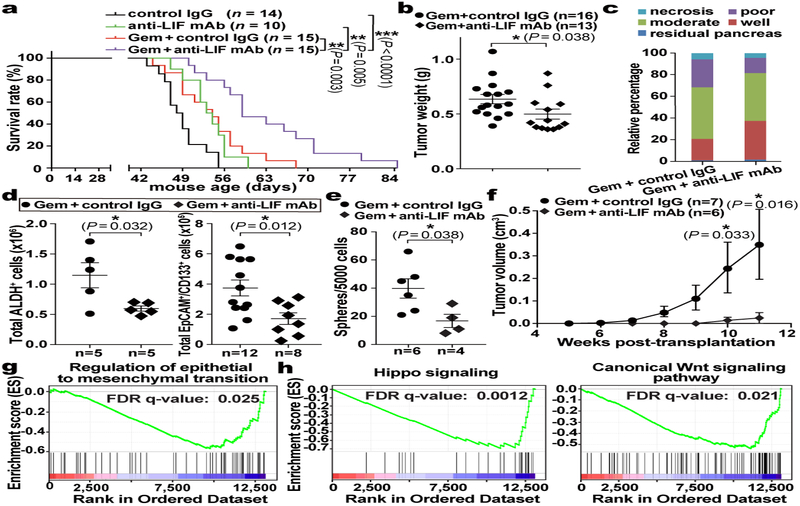
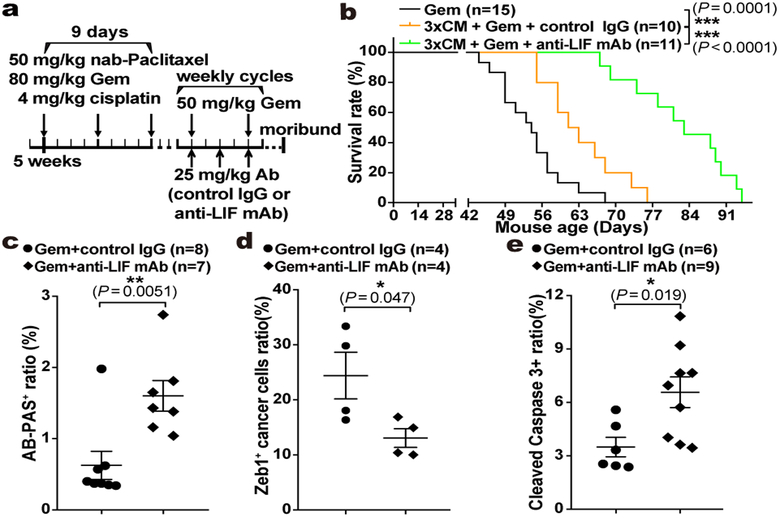
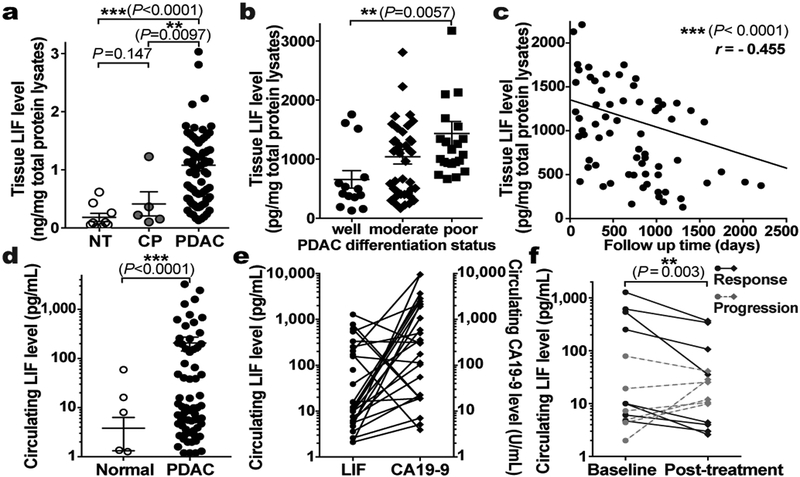
Pancreatic ductal adenocarcinoma (PDAC) has a dismal prognosis largely owing to inefficient diagnosis and tenacious drug resistance. Activation of pancreatic stellate cells (PSCs) and consequent development of dense stroma are prominent features accounting for this aggressive biology1,2. The reciprocal interplay between PSCs and pancreatic cancer cells (PCCs) not only enhances tumour progression and metastasis but also sustains their own activation, facilitating a vicious cycle to exacerbate tumorigenesis and drug resistance3-7. Furthermore, PSC activation occurs very early during PDAC tumorigenesis8-10, and activated PSCs comprise a substantial fraction of the tumour mass, providing a rich source of readily detectable factors. Therefore, we hypothesized that the communication between PSCs and PCCs could be an exploitable target to develop effective strategies for PDAC therapy and diagnosis. Here, starting with a systematic proteomic investigation of secreted disease mediators and underlying molecular mechanisms, we reveal that leukaemia inhibitory factor (LIF) is a key paracrine factor from activated PSCs acting on cancer cells. Both pharmacologic LIF blockade and genetic Lifr deletion markedly slow tumour progression and augment the efficacy of chemotherapy to prolong survival of PDAC mouse models, mainly by modulating cancer cell differentiation and epithelial-mesenchymal transition status. Moreover, in both mouse models and human PDAC, aberrant production of LIF in the pancreas is restricted to pathological conditions and correlates with PDAC pathogenesis, and changes in the levels of circulating LIF correlate well with tumour response to therapy. Collectively, these findings reveal a function of LIF in PDAC tumorigenesis, and suggest its translational potential as an attractive therapeutic target and circulating marker. Our studies underscore how a better understanding of cell-cell communication within the tumour microenvironment can suggest novel strategies for cancer therapy.


Conflict of interest statement

Additional information Reprints and permissions information is available at www.nature.com/reprints. The authors declare competing financial interests: details are available in the online version of the paper. Readers are welcome to comment on the online version of the paper.

Figures

Extended Data Figure 1 |
Extended Data Figure 1 |. Combinatorial MS analyses to characterize the paracrine communication between PSCs and PCCs.
a, Phosphotyrosine proteomic analysis of intracellular signaling changes in MIAPaCa2 cells in response to hPSC CM stimulation. n=2 biological replicates. b. Summary of phosphotyrosine proteomic analysis data in PANC1 and MIAPaCa2 in response to hPSC CM stimulation. c, Workflow of the analysis of secretome proteomic assays. Proteins identified with at least three spectral counts were counted, and only those identified in both biological replicates were considered. Proteins uniquely secreted by each cell type were defined as those with more than 10-fold differences in spectral count. n=2 biological replicates. d, DAVID gene ontology (GO) analysis of the protein sets uniquely secreted by MiaPaCa2 and hPSC respectively identified the top ten enriched GO terms of molecular function for each cell type. e, Pearson correlation analysis to validate the quantification reproducibility of STAT3 IP-MS assays by label-free quantification (LFQ) between biological replicates. n=3 biological replicates for both control and PSC CM stimulation.
Extended Data Figure 2 |
Extended Data Figure 2 |. Dysregulated LIF is a key driver for STAT3 activation in PDAC.
a, IB analyses of the response of various human PCC and PSC cell lines to LIF stimulation, using STAT3 phosphorylation at Y705 (pSTAT3) as a readout. b, IB analyses of LIF-stimulated downstream intracellular signaling changes in three representative PCC lines, KP4, MIAPaCa2 and PANC1, over a two-hr time course. 10 ng/mL recombinant human EGF stimulation for 10 min was used as positive control for pAKT1 and pERK1/2 activation. c,d, IB analyses of pSTAT3 in MIAPaCa2 and PANC1 cells when LIF signaling was blocked by either shRNA knockdown of LIFR (c) or immune-inactivation of LIF using anti-LIF mAb (d). For LIF stimulation (a-d), 1 ng/mL recombinant human LIF was applied for 15 min, and at least three independent experiments were performed and representative images were presented. e, LIFR expression in PCCs by qPCR and its positive correlation with the response intensity to LIF as illustrated in the heatmap. n=2 biological replicates. f, LIF secretion by PCCs and PSCs quantified by ELISA, and its negative correlation with the corresponding response intensity to LIF. n=2 biological replicates. g, Cellular localization of Lif mRNA in pancreatic tumour tissues from KPf/fCL mice was examined by multiplex fluorescent RNAscope assays. Ptprc/Cd45 mRNA was co-stained to mark immune cells, and Krt19 was stained by IF to mark cancer cells. Scale bars: red, 200 μm; white, 50 μm. h-j, pSTAT3 analyzed by IB (h) and immunohistochemistry (IHC) (i) in mouse pancreatic tissues, and by IHC in human pancreatic tissues during the pathogenesis of PDAC (j). NT, mouse normal tissues or non-tumour parts resected from the human tumour trunks; CP, chronic pancreatitis; PDAC, pancreatic tumour tissues collected from KPf/fCL mice or PDAC patients. Scale bars: black, 500 μm; blue, 100 μm. For the histology assays on tissue sections (g,i,j), at least three tumour samples were stained and analyzed, and representative images were presented.
Extended Data Figure 3 |
Extended Data Figure 3 |. Intrinsic LIFR signaling in PCCs affected pancreatic cancer progression but not initiation and ADM development.
a, Cellular localization of Lifr mRNA in mouse pancreatic tissues by RNAscope assays. Postn mRNA was co-stained to mark the stromal PSC cells. b, Schematic illustration of Lifr mutant allele structure and conversion into conditional deletion mutant allele by FLPo excision. c,d, Characterization of primary mouse embryonic fibroblasts isolated from Lifrf/f and LIFRf/+ mice respectively, by PCR analysis to determine the genotype of the Lifr allele and loxP-flanked exon deletion by Adenovirus-introduced Cre (c), and by IB analysis to validate the knockout of Lifr proteins and loss of response to LIF (d). +, wildtype allele; f, loxP-flanked mutant allele; ∆, mutant allele with the loxP-flanked exon deleted. e, Representative histological images characterizing the tumours from LifrWT- or Lifrf/f- KPf/fCL mice respectively at the endpoint of survival study presented in Fig. 2b. f,g, Histology characterization of tumour development in LifrWT- or Lifrf/f- KPf/fCL mice at 3, 5, and 7 weeks of age (f), and quantification of cancer cell abundance (g); n=6 mice per condition. h,i, Pathological grade of tumour stage (h) and histological quantification of cancer and stromal PSC cell abundance (i) for pancreatic tissues collected from LifrWT- or Lifrf/f- KC mice treated with 250 mg/kg caerulein by daily IP injection, starting at 7 weeks of age, for 5 days and rested for 5 days to allow tumour development. j, Histology characterization of caerulein-induced ADM development and resolution in LifrWT;Pdx1-Cre or Lifrf/f;Pdx1-Cre mice by Masson’s trichrome stain. Littermates at 7 weeks of age were subjected to daily 250 mg/kg body weight caerulein treatment by IP injection for 7 days, and pancreas tissues were collected 1 or 7 days after the last injection to examine the ADM formation and resolution. No differences were noticed between two genotypes. n=5 mice per condition. k, RNA in situ hybridization by BaseScope assays using probes specifically targeting the loxP-flanked exon 4 of Lifr to examine the escaper cancer cells still maintaining Lifr expression due to incomplete deletion. Scale bars: black, 1000μm; blue, 200μm; yellow, 50μm. Statistical significance was determined by two-way ANOVA (h) or two-tailed unpaired Student’s t-test.
Extended Data Figure 4 |
Extended Data Figure 4 |. LIFR signaling in PCCs modulated cancer cell differentiation.
a,b, Flow cytometry analysis of the total cell counts (a) and relative frequency (b) of tumour-initiating cell populations in individual tumours. c, Functional evaluation of tumour-initiating cell abundance by in vitro sphere formation. d-i, Differential gene expression comparing the EpCAM+ cancer cells purified from individual tumours of LifrWT- or Lifrf/f- KPf/fCL mice, are shown in heat maps. Colors correspond to standardized expression of genes. n=4 mice per treatment. d, Hierarchical clustering of all the 1129 differentially expressed genes (FDR < 0.05, log2 fold change > 0.8 and FPKM>2 in at least 4 samples). Heat maps of genes related to tumour-initiating cell markers (e), STAT3 downstream targets (f), and Gem response (g). h,i, Gene set enrichment analysis (GSEA). j,l, Csf2 (encoding Gm-csf) and Ccl11 genes expression in EpCAM+ PCCs, Pdgfrα+ CAFs and Ptprc/Cd45+ tumour infiltrating lymphocytes (TILs), purified by FACS from tumours of KPf/fCL mice, by RNA-seq analysis. n=4, 3, 3 respectively. k,m,n, Multiplex ELISA analysis of Gm-csf and Ccl11 levels in normal, caerulein-induced chronic pancreatitis (CP), and PDAC tissues of KPf/fCL mice showed that the increase in Gm-csf was induced only when tumours developed (k), while the increase in Ccl1l level was induced in both CP and PDAC consistently both in mouse models (m) and human disease (n), supporting the notion that Ccl11 is a cytokine specifically produced by PSCs while Gm-csf specifically by PCCs. o, Cellular localization of Ccl11 mRNA in pancreatic cancer tissues from KPf/fCL mice was examined by multiplex fluorescent RNAscope assays. Ptprc/Cd45 mRNA was co-stained to mark immune cells, and Krt19 stained by IF to mark cancer cells. n=3 tumours. Scale bars: yellow, 500μm; white, 100μm.
Extended Data Figure 5 |
Extended Data Figure 5 |. Preclinical study in KPf/fCL mouse model revealed therapeutic beneficial effects of LIF blockade by anti-LIF mAb.
a-d. Anti-LIF mAb production and characterization. a, Silver staining of control mouse IgG and purified anti-LIF mAb used for preclinical treatment. b,c, IB analysis to evaluate the activity and specificity of anti-LIF mAb against various forms of LIF (rhLIF, recombinant human LIF; ehLIF, eukaryotically secreted human LIF; rmLIF, recombinant mouse LIF) and IL6 (b) and revealed that the anti-LIF mAb has weaker neutralizing activity against mLIF compared to hLIF (c). d, Pilot test of anti-LIF mAb in KPf/fCL mice for dosage optimization. KPf/fCL mice at 42 days of age were administered with 25 mg/kg body weight of anti-LIF mAb by IP injection every other day for three times, and one day after the last injection tumours were collected for histology analysis. Adjacent sections were used for the indicated staining. Representative images from three independent experiments or mice were showed. e, Regimen for the preclinical therapeutic treatment. KPf/fCL mice at 5 weeks of age were randomly enrolled into four cohorts. For the first 12 days as phase one, 25 mg/kg anti-LIF mAb or control IgG were administered by IP injection, together with 50 mg/kg Gem or vehicle at standard Q3D4 dosage. This was followed by weekly cycles as phase two with antibodies thrice and Gem twice weekly. f, Histological characterization with representative images and cell abundance quantification. g, Relative abundance of EpCAM+ cancer cells quantified by flow cytometry analysis. h, Double immunofluorescence staining to confirm the cell type specific expression of cytosolic protein Krt19 and nuclear protein Pdx1 as the PCC marker. n=3 tumour tissues. i, Double immunofluorescence staining of nucleus-localized proteins Ki67 (used as a proliferation marker) and Pdx1 (as the PCC marker), and quantification of proliferating cancer cell frequency as the fraction of proliferating cancer cells (Ki67+/Pdx1+/DAPI+) over total cancer cells (Pdx1+/DAPI+). j, Cleaved Caspase 3 IHC analysis to assess apoptosis. Scale bar, yellow, 300 μm; black, 100μm; white, 50 μm. Statistical significance was determined by two-tailed unpaired Student’s t-tests.
Extended Data Figure 6 |
Extended Data Figure 6 |. LIF blockade alleviated chemoresistance directly by affecting cancer cell differentiation.
a, Representative histological images showing different tumour differentiation status. b-d, Flow cytometry analysis of the total cell count (b) and relative frequency (c) of tumour-initiating cell populations in individual tumours, and the gating strategy exemplified with representative contour plots (d). e, Multiplex immunofluorescence staining of nuclear proteins Zeb1 (as a mesenchymal cell marker) and Pdx1 (as the PCC marker) and quantification of mesenchymal cancer cell frequency as the fraction of Zeb1+/Pdx1+/DAPI+ cancer cells over Pdx1+/DAPI+ total cancer cells. f, Sphere formation assays on primary PCCs with or without Lifr deficiency in response to low concentration (3 nM) Gem treatment. n=9 per condition. g-i, Histological characterization of tumour tissues from the maintenance study (ref to Fig. 4c–e), and representative images of AB-PAS staining for well-differentiated cancer cells with acidic and neutral mucin stained in blue and magenta (g), of multiplex immunofluorescence staining of Zeb1 and Pdx1 proteins for the mesenchymal cancer cell frequency quantification and EMT (h), and of Cleaved Caspase 3 IHC analysis for apoptosis (i). Scale bars: black, white, 300μm; blue, 100μm; yellow, 50μm. Statistical significance was determined by two-tailed unpaired Student’s t-test.
Extended Data Figure 7 |
Extended Data Figure 7 |. LIF blockade profoundly affected genes expression in cancer cells analyzed by RNA-seq.
a-e, Differential gene expression comparing the EpCAM+ cancer cells purified from individual tumours of KPf/fCL mice treated with either Gem+control IgG (GI) or Gem+anti-LIF mAb (GA) are shown in heat maps. Colors correspond to standardized expression of genes. a, Hierarchical clustering of all the 1624 differentially expressed genes (FDR < 0.05, log2 fold change > 0.8 and FPKM>2 in at least 4 samples). b, Gene set enrichment analysis. Heat maps presenting the expression levels of genes related to tumour-initiating cell markers (c), STAT3 downstream targets (d), and Gem response (e). f, Venn diagram comparing the differentially expressed genes by pharmacologic LIF blockade and genetic Lifr deficiency revealed 811 consensus genes. g, Hierarchical clustering of 811 consensus genes with differential expression by either pharmacologic LIF blockade and genetic Lifr deficiency.
Extended Data Figure 8 |
Extended Data Figure 8 |. Correlation analysis between tissue LIF levels and clinical parameters of PDAC.
a-c, ELISA analysis of Lif levels (a), and IB and IHC analyses of STAT3 activation in mouse pancreatic tissues at various stages of PDAC pathogenesis. Scale bars: black, 200μm; blue, 50μm. d, Mouse serum Lif levels at various stages of pancreas pathogenesis analyzed by ELISA. e, Summary table of clinical parameters of the human cases from whom pancreatic tissue samples were collected for ELISA assays and correlation analysis. f, Correlation analysis of human tissue LIF levels and indicated clinical parameters by Chi square analysis. g, Correlation analysis between tissue LIF mRNA levels and disease free survival of patients with stage I or IIa PDAC at diagnosis by Mantel-Cox Log-rank test and presented as Kaplan-Meier survival curve. Data derived from TCGA database. h, Correlation analysis between the changes in circulating LIF or CA19–9 levels and tumour status scored by RECIST grade during multi-cycle therapeutic treatment by the receiver operating characteristic (ROC) analysis. n=51 data points. i, Serum LIF levels in various solid cancer patients by Simoa ELISA. j, Graphic summary of LIF action in pancreatic carcinogenesis.
Extended Data Figure 9 |
Extended Data Figure 9 |. PRM-MS assay development and analysis.
a, Schematic workflow of the glycoprotein enrichment strategy followed with PRM-MS assays. b, Identified unique peptides of the targeted proteins in human pancreatic tissues. c, Reproducibility evaluation of the tissue sample preparation and PRM-MS analysis. d, Summary table of clinical parameters of the human cases from whom pancreatic tissue samples were collected for PRM-MS analysis. e,f, LIF protein levels in human primary tumour and paired normal tissue samples from pancreatic cancer patients (e) and various solid cancer patients (f) quantified by PRM-MS assays. g,h, LIFR and GP130 protein levels in human pancreatic tissues quantified by PRM-MS assays. Statistical significance was determined by two-tailed unpaired Student’s t-test (f) or one-way ANOVA (e,g,h); *, p<0.05; ***, p<0.001.
Extended Data Figure 10 |
Extended Data Figure 10 |. Comparison of LIF and IL6 in PDAC.
a,b, MS and ELISA quantification of IL6 family cytokines in hPSC CM. n=2 biological replicates. c-e, ELISA quantification of IL6 (c) and IL11 (d) in CMs of various human PCC lines, and LIF and IL6 in CMs from various human PSC or normal fibroblast cells (e). n=2 biological replicates. f-i, ELISA quantification of LIF and IL6 levels in mouse and human pancreatic tissues (f,g) and sera respectively (h,i). j,k, Correlation analysis between human tissue IL6 levels and tumour differentiation status by Kruskal-Wallis test (j) or overall survival by Pearson correlation test (k). l-n, Correlation analysis between tissue IL6 mRNA levels and overall survival by Mantel-Cox Log-rank test presented as Kaplan-Meier survival curve (l), and mRNA expression compared by Wilcoxon matched-pairs rank test and presented as Tukey box-and-whisker plots (m,n); RNA-seq data of 170 PDAC tissues were derived from TCGA database. o, Cellular localization of mRNA expression in human pancreatic tissues examined by RNAscope assays. KRT19 or POSTN were co-stained to mark PCC and PSC cells respectively. p,q, IB analysis of pSTAT3 activation in indicated human pancreatic cancer cell lines in response to 1 ng/mL recombinant human IL6 or LIF stimulation (p) or the stimulation by hPSC CM with or without immune-inactivation of LIF and/or IL6 using neutralizing antibodies (q). 15 min stimulation were carried out for all. Representative images from three independent experiments were showed.
Figure 1 |
Figure 1 |. Combinatorial MS analyses identified LIF as a key paracrine factor.
a, Schematic workflow of the MS strategy combining secretome and phosphoproteomic analyses. Matched serum-free medium was used as control stimulation. b, Phosphotyrosine proteomic analysis of CM-stimulated intracellular signalling in PANC1 cells. c, Proteomic analysis and comparison of MIAPaCa2 and hPSC secretome presented as an MA plot. n=2 biological replicates (b,c). d,e, IP-MS assay on 3xFlag-STAT3-expressing PANC1 cells to identify CM stimulation-dependent STAT3-associated proteins. n=3 biological replicates. f,g, IB analyses of pSTAT3 in KP4 cells with LIF blockade by LIFR knockdown or anti-LIF mAb. CM harvested from hPSC. h, Lif levels in mouse pancreatic normal and tumour tissues by ELISA. NT=7; PDAC=8. i,j, RNAscope assays to examine cellular sources of LIF mRNA expression in mouse (i) and human (j) pancreatic tissues. Krt19 mRNA was co-stained to mark cancer cells. NT, mouse normal pancreatic tissues or non-tumour parts resected from the human tumour trunks; PDAC, tumour tissues collected from KPf/fCL mice or PDAC patients. Scale bars: black, 200 μm; blue, 50 μm. Representative images from at least three biological replicates per experiment were presented (f,g,i,j).
Figure 2 |
Figure 2 |. LIF acted on PCCs to affect tumour progression.
a, Kaplan–Meier survival curve. b, Relative abundance of Krt19+ cancer cell in tumours at the endpoint of the survival study. c-e, Pathological grade of tumour stage, histological quantification of cancer and stromal PSC cell abundance, and levels of PCC-produced Gm-csf and PSC-produced Ccl11 by Luminex multiplex ELISA assays in tumour tissues collected from five-week LifrWT- or Lifrf/f- KPf/fCL mice. Statistical significance was determined by one-way ANOVA with Tukey’s multiple comparisons test (a,b), two-way ANOVA (c), or two-tailed unpaired Student’s t-test (d,e).
Figure 3 |
Figure 3 |. LIF blockade by anti-LIF mAb provided therapeutic benefit in PDAC by affecting cancer cell differentiation.
a, Kaplan–Meier survival curve. b, Total tumour weights at the endpoint of treatment. c, Pathological grade of tumour differentiation. n=6 mice per treatment. d, Flow cytometry analysis of total count of tumour-initiating cells, defined as ALDH+ or EpCAM+/CD133+, in individual tumours. e,f, Functional evaluation of tumour-initiating cell abundance by in vitro sphere formation and in vivo flank transplantation assays. g,h, Gene set enrichment analysis (GSEA) for differential gene expression in EpCAM+ cancer cells freshly isolated by FACS from individual tumours of the in vivo Chemo or Combo treated KPf/fCL mice. n=4 mice per treatment. Statistical significance was determined by one-way ANOVA (a), or two-tailed unpaired Student’s t-test.
Figure 4 |
Figure 4 |. LIF blockade directly affected chemoresistance in PDAC.
a, Regimen for the preclinical maintenance therapeutic trial. b, Kaplan–Meier survival curve. c-e, Histological quantification of cancer cell differentiation by AB-PAS staining (c), mesenchymal transition by Zeb1/Pdx1 immunofluorescence co-staining (d), and apoptosis by Cleaved Caspase 3 IHC (e). Statistical significance was determined by one-way ANOVA (b), or two-tailed unpaired Student’s t-test.
Figure 5 |
Figure 5 |. LIF can be a biomarker for PDAC monitoring.
a-c. LIF levels in human pancreatic tissues quantified by ELISA (a), and their correlation with tumour differentiation status (b) and overall survival (c). n, NT=9; CP=5; PDAC=77. d, Human circulating LIF levels quantified by Simoa ELISA. n, NT=24; PDAC=69. e, Comparison of circulating LIF and CA19–9 levels in paired human PDAC plasma. Lines connect the paired samples from the same cases. n=28. f, Correlation of circulating LIF level changes and therapeutic responses in PDAC patients. Lines connect the paired samples per patients. n=14. Statistical significance was determined by Kruskal-Wallis test (a,b), nonparametric Spearman correlation test (c,e), Mann Whitney test (d), or Fisher’s Exact Test (f).

Similar articles

Cited by

References

    1. Chu GC, Kimmelman AC, Hezel AF & DePinho RA Stromal biology of pancreatic cancer. J. Cell. Biochem 101, 887–907 (2007). - PubMed
    1. Feig C et al. The pancreas cancer microenvironment. Clin. Cancer Res 18, 4266–4276 (2012). - PMC - PubMed
    1. Omary MB, Lugea A, Lowe AW & Pandol SJ The pancreatic stellate cell: a star on the rise in pancreatic diseases. J. Clin. Invest 117, 50–59 (2007). - PMC - PubMed
    1. Mahadevan D & Von Hoff DD Tumor-stroma interactions in pancreatic ductal adenocarcinoma. Mol. Cancer Ther 6, 1186–1197 (2007). - PubMed
    1. Erkan M et al. StellaTUM: current consensus and discussion on pancreatic stellate cell research. Gut 61, 172–178 (2012). - PMC - PubMed

Publication types

MeSH terms