. 2019 Apr 16;10(1):1768.
doi: 10.1038/s41467-019-09467-5.

Biosynthesis of DHGA12 and its roles in Arabidopsis seedling establishment

Affiliations

Biosynthesis of DHGA12 and its roles in Arabidopsis seedling establishment

Hao Liu et al. Nat Commun. .

Abstract

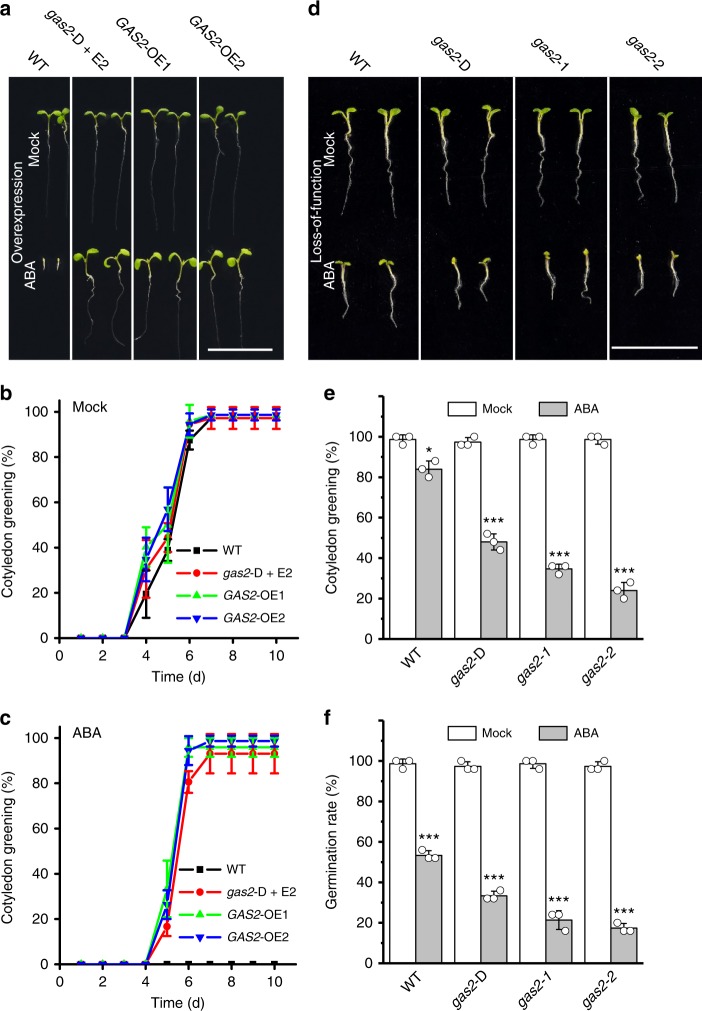
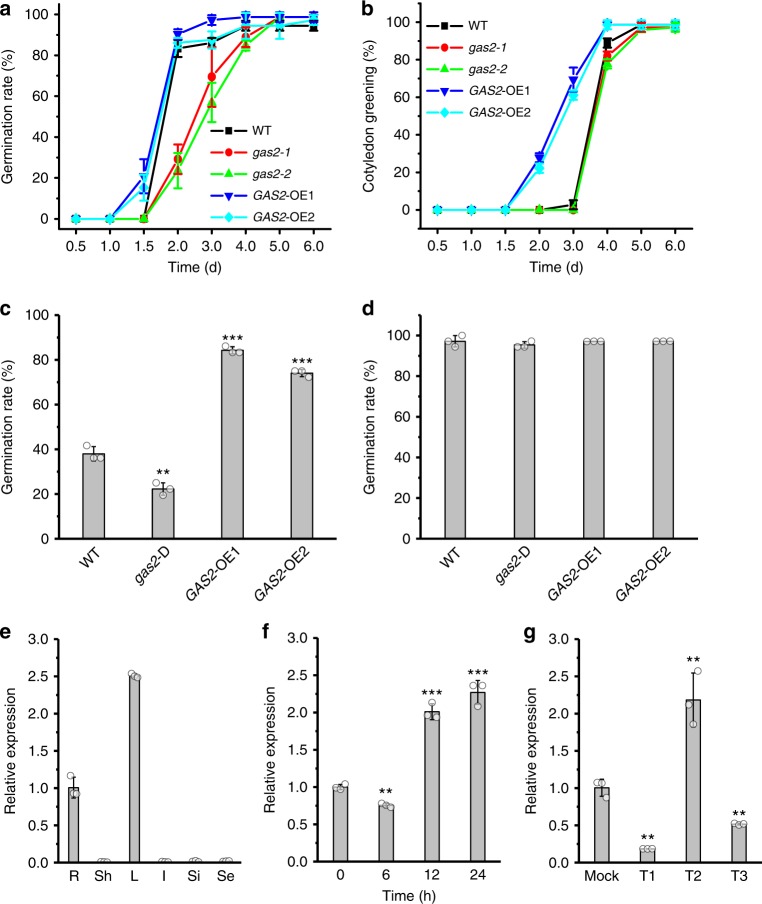
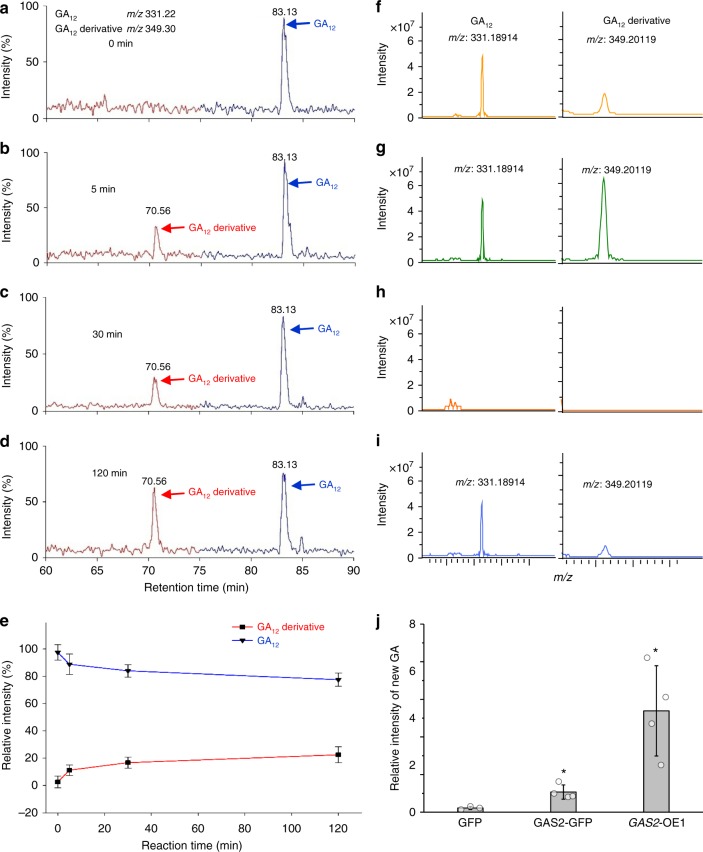
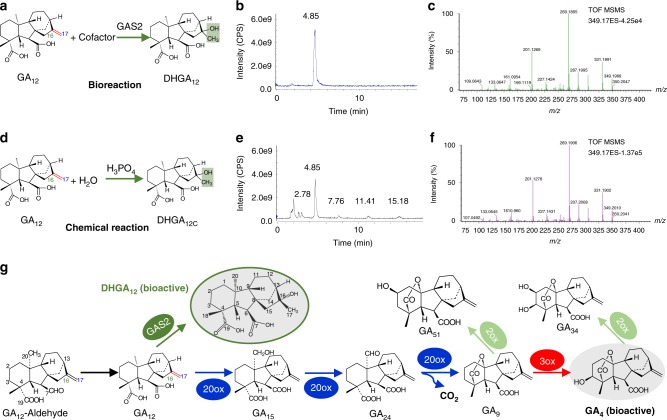
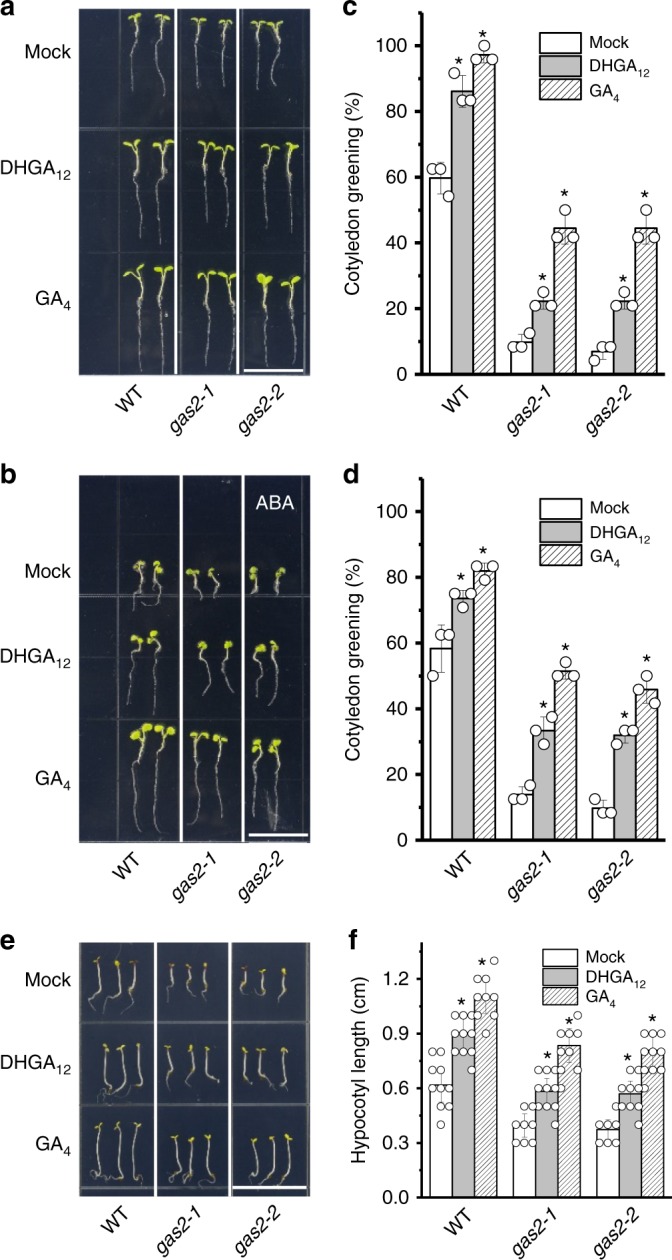
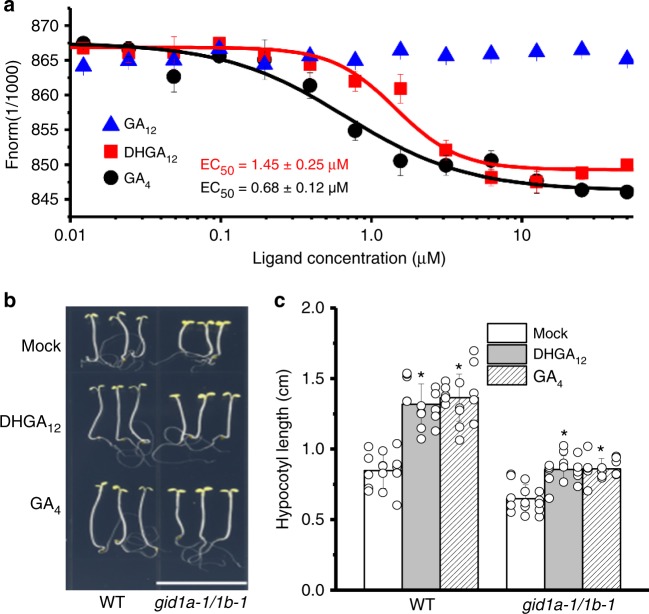
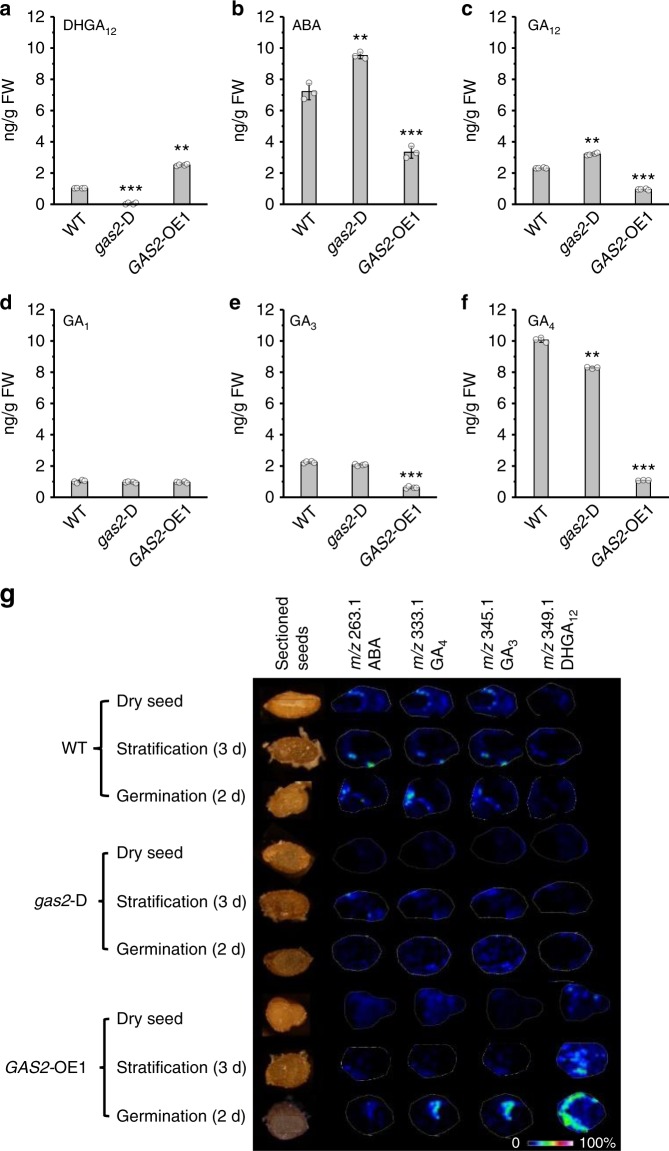
Seed germination and photoautotrophic establishment are controlled by the antagonistic activity of the phytohormones gibberellins (GAs) and abscisic acid (ABA). Here we show that Arabidopsis thaliana GAS2 (Gain of Function in ABA-modulated Seed Germination 2), a protein belonging to the Fe-dependent 2-oxoglutarate dioxygenase superfamily, catalyzes the stereospecific hydration of GA12 to produce GA12 16, 17-dihydro-16α-ol (DHGA12). We show that DHGA12, a C20-GA has an atypical structure compared to known active GAs but can bind to the GA receptor (GID1c). DHGA12 can promote seed germination, hypocotyl elongation and cotyledon greening. Silencing and over-expression of GAS2 alters the ABA/GA ratio and sensitivity to ABA during seed germination and photoautotrophic establishment. Hence, we propose that GAS2 acts to modulate hormonal balance during early seedling development.


Conflict of interest statement

The authors declare no competing interests.

Figures

Fig. 1
Fig. 1
GAS2 modulates the sensitivity to ABA in seed germination and seedling establishment. a Phenotypes of 10-d-old seedlings of wild-type, E2-induced gas2-D and two GAS2 overexpression transgenic lines (GAS2-OE1 and OE2), grown on MS in absence (Mock) or presence of 0.5 µM ABA (ABA). Bar = 1.5 cm. b, c Cotyledon greening analysis of 10-d-old seedlings of wild-type, E2-induced gas2-D and two GAS2 overexpression lines (GAS2-OE1 and OE2) grown on MS with or without the addition of 0.5 µM ABA. Error bars represent SD (standard deviations) (n = 72). d Phenotypes of 8-d-old seedlings of wild-type, noninduced gas2-D, gas2-1 and gas2-2, grown on MS in absence (Mock) or presence of 0.2 µM ABA (ABA). Bar = 1.5 cm. e Cotyledon greening analysis of 8-d-old seedlings of wild-type, noninduced gas2-D, gas2-1 and gas2-2 grown on MS in absence (Mock) or presence of 0.2 µM ABA (ABA). Error bars represent SD (standard deviations) (n = 72). f Seed germination analysis of wild-type, noninduced gas2-D, gas2-1 and gas2-2, grown on MS in absence (Mock) or presence of 0.2 µM ABA (ABA) at 48 h. Error bars represent SD (standard deviations) (n = 72). E2 stands for 17-β-estradiol. *P < 0.05, ***P < 0.001, t test versus mock (e and f). Source data are provided as a Source Data file. ABA abscisic acid, MS Murashige and Skoog agar
Fig. 2
Fig. 2
Silencing and overexpression of GAS2 affects seed germination and cotyledon greening. a, b Seed germination and cotyledon greening analysis of wild-type, gas2-1, gas2-2 and two GAS2 overexpression lines (GAS2-OE1 and OE2) grown on MS. Error bars represent SD (standard deviations) (n = 72). c, d Germination analysis of wild-type, noninduced gas2-D and overexpressing GAS2 fresh seeds (not allowed to dry) at the 2-d timepoint after sowing with no stratification (c) and stratification (at the 3-d timepoint after sowing) (d). Error bars represent SD (n = 108). **p< 0.01, ***p< 0.001, t test. e Relative GAS2 mRNA levels in roots (R), shoots (Sh), leaves (L), inflorescences (I), siliques (Si) and seeds (Se) analyzed by RT-qPCR. Error bars represent SD. f Relative GAS2 mRNA levels in hypocotyls of Arabidopsis after different light/dark treatment (dark 9 d, dark 9 d + light 6 h, dark 9 d + light 12 h and dark 9 d + light 24 h). The dark 9-d level was arbitrarily adjusted to 1 and the remaining levels were normalized to that value. Error bars represent SD. **p < 0.01, ***p < 0.001, t test. g Relative GAS2 mRNA levels of the seedlings in response to red and far-red light exposure, analyzed by RT-qPCR. Error bars represent SD. **p < 0.01, t test. Mock: Far red light 0 h; T1: Far red light 2 h; T2: Far red light 2 h + red light 2 h; T3: Far red light 2 h + red light 2 h + Far red light 2 h. Source data are provided as a Source Data file. MS Murashige and Skoog agar
Fig. 3
Fig. 3
Analysis of products produced by the catalytic conversion of GA12 by GAS2 in vivo and in vitro. ad LC-MS base peak chromatogram of the products generated by the catalytic conversion of GA12 by GAS2 at different time intervals (0, 5, 30, and 120 min). [17,17-2H2]-GA12 was used in this assay. e LC-MS dynamic analysis of GA12 and GA12 derivative in the reaction solution at different time intervals (0, 5, 30, and 120 min). LC-MS liquid chromatography/mass spectrometry. fi GA12 and GA12 derivative detection using MALDI FTICR-MS spectra in 35S::GAS2-GFP (GAS2-GFP) (f), 35S::GFP (i) transiently transformed in protoplasts and GAS2-OE1 plants (g) with GA12 (2.5 μg/mL), 35S::GFP transiently transformed into protoplasts was used as a negative control without GA12 treatment (h). j Relative intensity of GA12 derivative in Arabidopsis protoplasts transiently transformed with 35S::GAS2-GFP (GAS2-GFP) and 35S::GFP (GFP) overnight. The protoplasts from GAS2-OE1 plants (GAS2-OE1) were used as a control. GA12 (2.5 μg/mL) was supplemented as the substrate for GA12 derivative synthesis catalyzed by GAS2. Values shown are means ± SD (n = 3). *p < 0.05, t test. Source data are provided as a Source Data file
Fig. 4
Fig. 4
LC-MS analysis of the new gibberellin, DHGA12 and its position within the GA biosynthetic pathway. a Schematic of the GAS2-catalyzed conversion of GA12 to DHGA12. Cofactor: 24 µL, containing 133 mM 2-oxoglutarate, 133 mM ascorbate, 16.7 mM FeSO4, and 33.3 mg/mL catalase. b Total ion chromatogram (TIC) of DHGA12 by LC-MS. c MS spectrum of the peak at 4.85 min (retention time) in (b). d Schematic of the chemical synthesis of DHGA12C (subscript C denotes chemically synthesized DHGA12). The chemical synthesis was conducted in the phosphoric acid solution (0.125 mol/L) at 60 oC for 8 h. e TIC of DHGA12C by LC-MS. f MS spectrum of the peak at 4.85 min (retention time) in (e). g The stereochemical configuration of DHGA12 (green oval) and gibberellin biosynthetic pathway including the GAS2-catalyzed production of DHGA12. 20ox GA 20-oxidase, 3ox GA 3-oxidase, 2ox GA 2-oxidase, LC-MS liquid chromatography/mass spectrometry, GA gibberellins, MS Murashige and Skoog agar
Fig. 5
Fig. 5
DHGA12 antagonistically suppresses the effect of ABA in seedling establishment. a, b Effects of exogenous application of DHGA12 and GA4 on cotyledon greening of wild-type, gas2-1, and gas2-2, germinated 10-d on MS and MS + 0.2 µM ABA, with or without the addition of DHGA12 or GA4. Bars = 1.5 cm. c, d Cotyledon greening analysis of wild-type, gas2-1, and gas2-1, grown on MS at day 4 (c) and MS + 0.2 µM ABA at day 7 (d), with or without the addition of DHGA12 or GA4. Error bars represent SD (n = 72, t test, *P < 0.05). Values are the mean of three independent experiments. e, f Effects of exogenous application of DHGA12 and GA4 on hypocotyl elongation of 5-d wild-type, gas2-1 and gas2-2 seedlings grown under continuous far-red light illumination. Data represent means ± SD (n = 22, t test, *P < 0.05). Source data are provided as a Source Data file. ABA abscisic acid
Fig. 6
Fig. 6
DHGA12 can directly bind to the GA receptor (GID1c). a Microscale thermophoresis (MST) analysis of DHGA12 and GA4 binding to GID1c. Dissociation constants of DHGA12 and GA4 with GID1c are 1.45 ± 0.25 μM and 0.68 ± 0.12 μM, respectively. Error bars represent SD (n = 3). b, c Effect of exogenous application of 5 μM DHGA12 and 5 μM GA4 on hypocotyl elongation of 10-d wild-type and gid1a-1/1b-1 seedlings grown under continuous far-red light illumination. Data represent means ± SD (n = 15; t test; *P < 0.05). Bar = 1.5 cm. Source data are provided as a Source Data file. GA gibberellins
Fig. 7
Fig. 7
Endogenous GAs and ABA levels in seeds. af DHGA12, ABA, GA12, GA1, GA3 and GA4 levels in wild-type, noninduced gas2-D and GAS2-OE1 seeds. 600 mg Arabidopsis seeds imbibed in 4 °C overnight were used for each sample. Values are expressed as means ± SD (standard deviations) (n = 3), **P < 0.01, ***P < 0.001, t test versus WT. g Visualization of ABA, GA3, GA4 and DHGA12 in wild-type, noninduced gas2-D and GAS2-OE1 seeds by MALDI-TOF imaging. Representative images of >3 measurements are presented. Source data are provided as a Source Data file. GA gibberellins, ABA abscisic acid

Comment in

Similar articles

Cited by

References

    1. Finch-Savage WE, Footitt S. Seed dormancy cycling and the regulation of dormancy mechanisms to time germination in variable field environments. J. Exp. Bot. 2017;68:843–856. doi: 10.1093/jxb/erw477. - DOI - PubMed
    1. Huijser P, Schmid M. The control of developmental phase transitions in plants. Development. 2011;138:4117–4129. doi: 10.1242/dev.063511. - DOI - PubMed
    1. Shu K, Liu XD, Xie Q, He ZH. Two faces of one seed: hormonal regulation of dormancy and germination. Mol. Plant. 2016;9:34–45. doi: 10.1016/j.molp.2015.08.010. - DOI - PubMed
    1. Hoang HH, Sechet J, Bailly C, Leymarie J, Corbineau F. Inhibition of germination of dormant barley (H ordeum vulgare L.) grains by blue light as related to oxygen and hormonal regulation. Plant Cell Environ. 2014;37:1393–1403. doi: 10.1111/pce.12239. - DOI - PubMed
    1. Graeber K, Nakabayashi K, Miatton E, Leubner-Metzger G, Soppe WJ. Molecular mechanisms of seed dormancy. Plant Cell Environ. 2012;35:1769–1786. doi: 10.1111/j.1365-3040.2012.02542.x. - DOI - PubMed

Publication types

MeSH terms